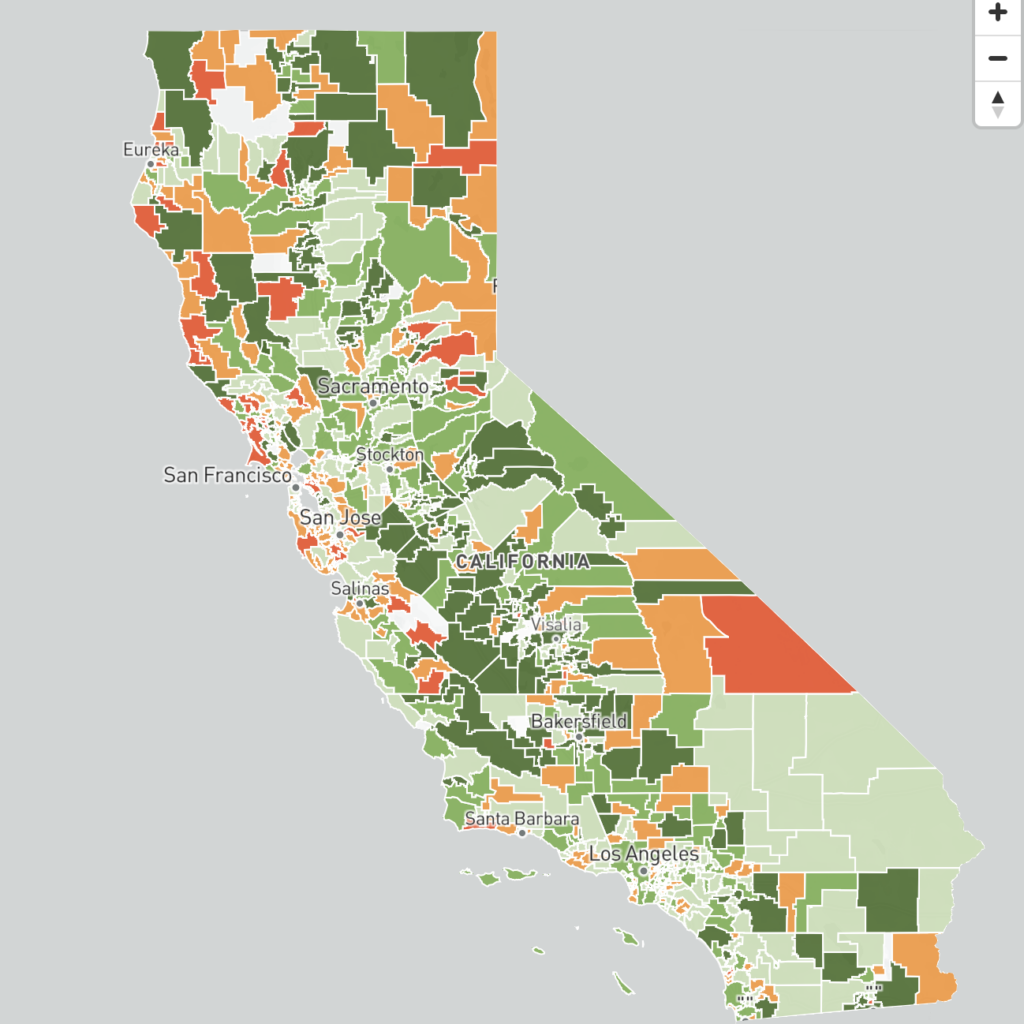
Nearly a third of the 930 districts statewide that reported data had a higher rate of chronic absenteeism in 2022-23 than the year before. Use this interactive map to explore rates of absenteeism by Unified and Elementary districts or High School districts and contrast rural, urban and suburban districts across California.
.errordiv padding:10px; margin:10px; border: 1px solid #555555;color: #000000;background-color: #f8f8f8; width:500px; #advanced_iframe_44 visibility:visible;opacity:1;vertical-align:top;.ai-info-bottom-iframe position: fixed; z-index: 10000; bottom:0; left: 0; margin: 0px; text-align: center; width: 100%; background-color: #ff9999; padding-left: 5px;padding-bottom: 5px; border-top: 1px solid #aaa a.ai-bold font-weight: bold;#ai-layer-div-advanced_iframe_44 p height:100%;margin:0;padding:0var ai_iframe_width_advanced_iframe_44 = 0;var ai_iframe_height_advanced_iframe_44 = 0;function aiReceiveMessageadvanced_iframe_44(event) aiProcessMessage(event,”advanced_iframe_44″, “true”);if (window.addEventListener) window.addEventListener(“message”, aiReceiveMessageadvanced_iframe_44); else if (el.attachEvent) el.attachEvent(“message”, aiReceiveMessageadvanced_iframe_44);var aiIsIe8=false;var aiOnloadScrollTop=”true”;var aiShowDebug=false;
if (typeof aiReadyCallbacks === ‘undefined’)
var aiReadyCallbacks = [];
else if (!(aiReadyCallbacks instanceof Array))
var aiReadyCallbacks = [];
function aiShowIframeId(id_iframe) jQuery(“#”+id_iframe).css(“visibility”, “visible”); function aiResizeIframeHeight(height) aiResizeIframeHeight(height,advanced_iframe_44); function aiResizeIframeHeightId(height,width,id) aiResizeIframeHeightById(id,height);var ifrm_advanced_iframe_44 = document.getElementById(“advanced_iframe_44”);var hiddenTabsDoneadvanced_iframe_44 = false;
function resizeCallbackadvanced_iframe_44()
Source: EdSource analysis of California Department of Education data

دیدگاهتان را بنویسید