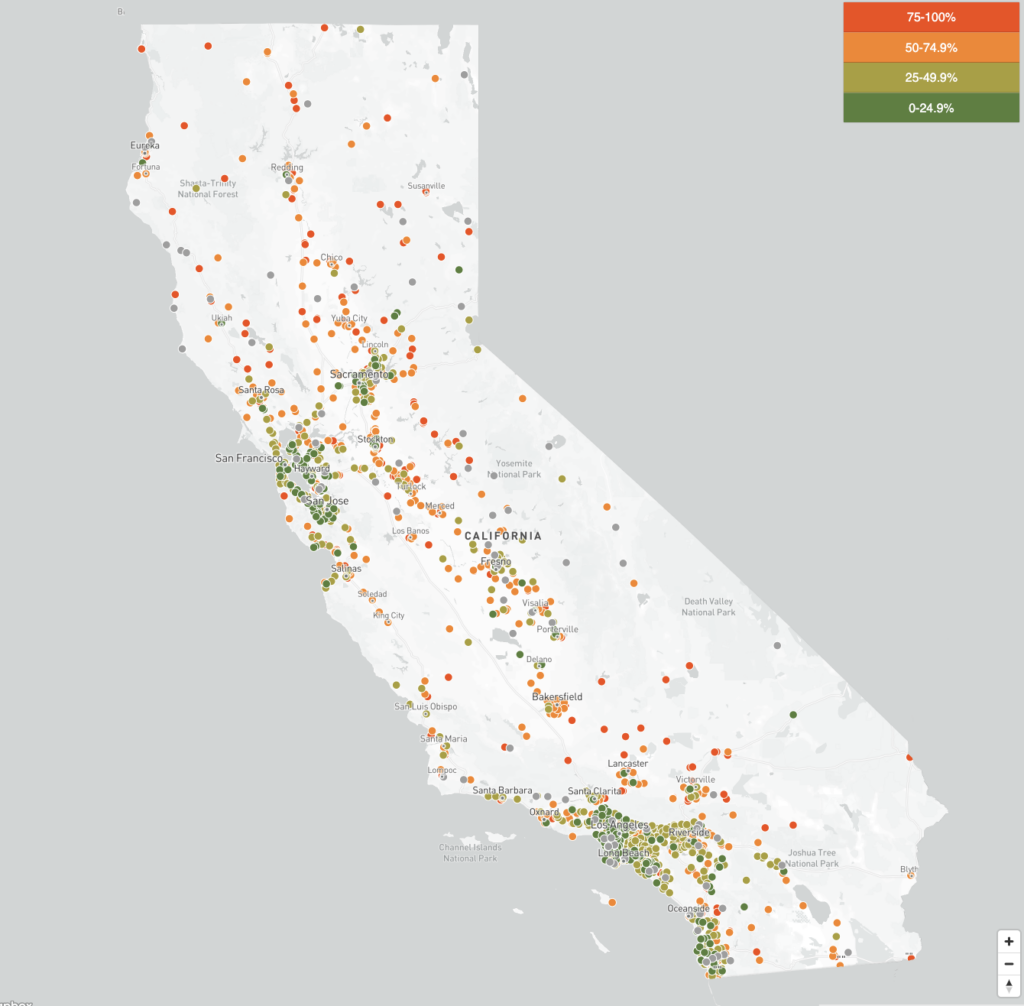
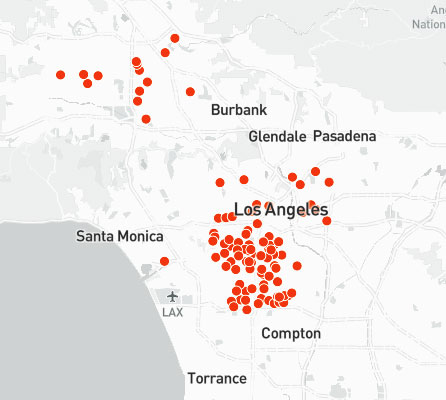
This map only includes schools that had 10% or more kindergartners not fully vaccinated.

This is a very important chart to raise awarement across schools, districts, and the state; however, I think it needs to be corrected that these are students who don’t pass these college-prep courses with a C or higher. It sends the wrong message to say that these “students don’t take courses needed to apply to CSU or UC” as I know that most students in many schools/districts do take these courses — they just … Read More
This is a very important chart to raise awarement across schools, districts, and the state; however, I think it needs to be corrected that these are students who don’t pass these college-prep courses with a C or higher. It sends the wrong message to say that these “students don’t take courses needed to apply to CSU or UC” as I know that most students in many schools/districts do take these courses — they just don’t get a passing grade, which is another systemic issue that needs to be tackled.

.errordiv padding:10px; margin:10px; border: 1px solid #555555;color: #000000;background-color: #f8f8f8; width:500px; #advanced_iframe_52 visibility:visible;opacity:1;vertical-align:top;.ai-info-bottom-iframe position: fixed; z-index: 10000; bottom:0; left: 0; margin: 0px; text-align: center; width: 100%; background-color: #ff9999; padding-left: 5px;padding-bottom: 5px; border-top: 1px solid #aaa a.ai-bold font-weight: bold;#ai-layer-div-advanced_iframe_52 p height:100%;margin:0;padding:0var ai_iframe_width_advanced_iframe_52 = 0;var ai_iframe_height_advanced_iframe_52 = 0;function aiReceiveMessageadvanced_iframe_52(event) aiProcessMessage(event,”advanced_iframe_52″, “true”);if (window.addEventListener) window.addEventListener(“message”, aiReceiveMessageadvanced_iframe_52); else if (el.attachEvent) el.attachEvent(“message”, aiReceiveMessageadvanced_iframe_52);var aiIsIe8=false;var aiOnloadScrollTop=”true”;var aiShowDebug=false;
if (typeof aiReadyCallbacks === ‘undefined’)
var aiReadyCallbacks = [];
else if (!(aiReadyCallbacks instanceof Array))
var aiReadyCallbacks = [];
function aiShowIframeId(id_iframe) jQuery(“#”+id_iframe).css(“visibility”, “visible”); function aiResizeIframeHeight(height) aiResizeIframeHeight(height,advanced_iframe_52); function aiResizeIframeHeightId(height,width,id) aiResizeIframeHeightById(id,height);var ifrm_advanced_iframe_52 = document.getElementById(“advanced_iframe_52”);var hiddenTabsDoneadvanced_iframe_52 = false;
function resizeCallbackadvanced_iframe_52()
Source: Los Angeles Unified District Open Data Catalog; California Department of Education

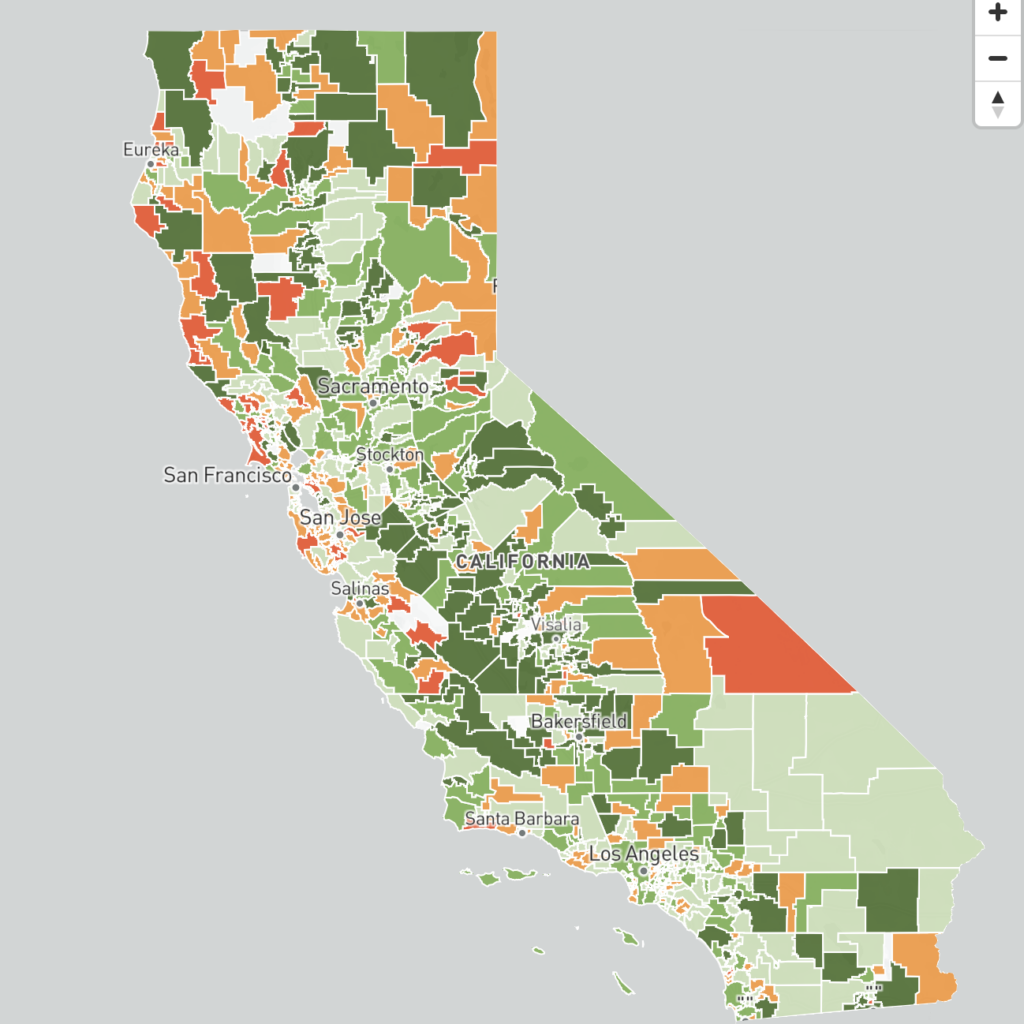
Nearly a third of the 930 districts statewide that reported data had a higher rate of chronic absenteeism in 2022-23 than the year before. Use this interactive map to explore rates of absenteeism by Unified and Elementary districts or High School districts and contrast rural, urban and suburban districts across California.
.errordiv padding:10px; margin:10px; border: 1px solid #555555;color: #000000;background-color: #f8f8f8; width:500px; #advanced_iframe_44 visibility:visible;opacity:1;vertical-align:top;.ai-info-bottom-iframe position: fixed; z-index: 10000; bottom:0; left: 0; margin: 0px; text-align: center; width: 100%; background-color: #ff9999; padding-left: 5px;padding-bottom: 5px; border-top: 1px solid #aaa a.ai-bold font-weight: bold;#ai-layer-div-advanced_iframe_44 p height:100%;margin:0;padding:0var ai_iframe_width_advanced_iframe_44 = 0;var ai_iframe_height_advanced_iframe_44 = 0;function aiReceiveMessageadvanced_iframe_44(event) aiProcessMessage(event,”advanced_iframe_44″, “true”);if (window.addEventListener) window.addEventListener(“message”, aiReceiveMessageadvanced_iframe_44); else if (el.attachEvent) el.attachEvent(“message”, aiReceiveMessageadvanced_iframe_44);var aiIsIe8=false;var aiOnloadScrollTop=”true”;var aiShowDebug=false;
if (typeof aiReadyCallbacks === ‘undefined’)
var aiReadyCallbacks = [];
else if (!(aiReadyCallbacks instanceof Array))
var aiReadyCallbacks = [];
function aiShowIframeId(id_iframe) jQuery(“#”+id_iframe).css(“visibility”, “visible”); function aiResizeIframeHeight(height) aiResizeIframeHeight(height,advanced_iframe_44); function aiResizeIframeHeightId(height,width,id) aiResizeIframeHeightById(id,height);var ifrm_advanced_iframe_44 = document.getElementById(“advanced_iframe_44”);var hiddenTabsDoneadvanced_iframe_44 = false;
function resizeCallbackadvanced_iframe_44()
Source: EdSource analysis of California Department of Education data