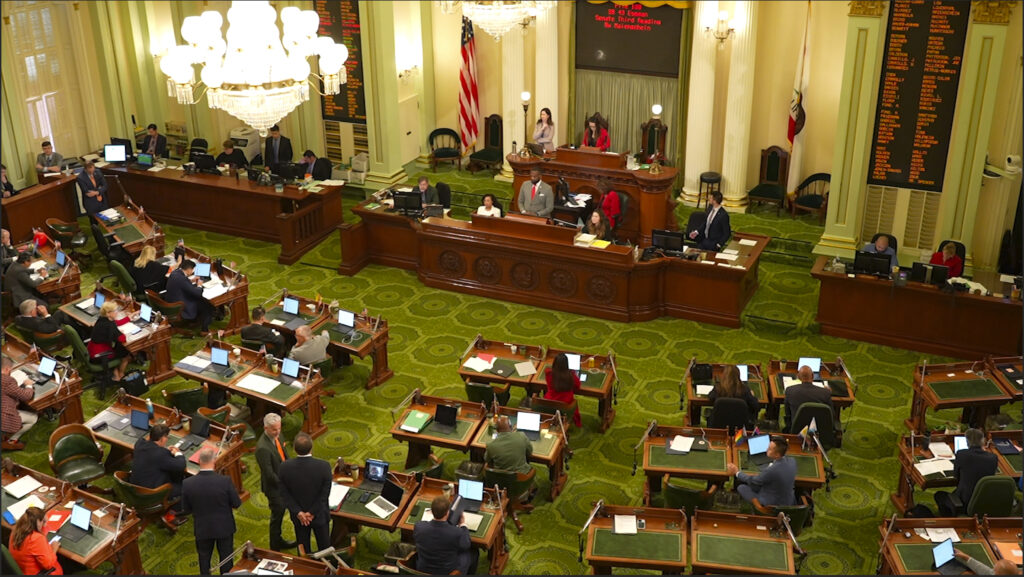
Senate Bill 1263 will be heard by the full Assembly if it makes it through the Assembly Appropriations Committee.
Credit: AP Photo/Terry Chea
Within the past week, the Legislature dispatched hundreds of bills, including several dozen affecting TK-12 and higher education.
Important education bills heading to Gov. Gavin Newsom include extending the ban on suspending students for willful defiance in high schools, creating more training for bilingual teachers, requiring gender-neutral student bathrooms by 2026, and enticing retired teachers to return to the classroom for the next few years.
We include one bill dealing with the Local Control Funding Formula that was withdrawn at the last minute but could find its way into next year’s budget. Newsom has through Oct. 14 to sign or veto bills he received by Sept. 14. Two bills to place a school bond before voters next year were also pulled; negotiations with Gov. Gavin Newsom will determine which moves forward next year.
Teacher shortage
Retired teachers: Senate Bill 765 would temporarily increase the amount teachers can earn post-retirement so that they can return to the classroom to take teaching positions that districts otherwise can’t fill. If the governor signs the bill, retired teachers will be able to earn 70% of the median final compensation of all California State Teachers Retirement members who retired the previous year, instead of the current 50%. The temporary measure would start July 1, 2024, and end on July 1, 2026.
“California has a teacher shortage, and we must do more to get teachers back in the classroom,” said state Sen. Anthony Portantino on Friday. “This is the most critical investment we can make and one that our students deserve. SB 765 makes it easier for retired teachers to come back to their teaching positions, and I look forward to the governor’s signature on this important measure.”
The bill originally called for increasing the grant award for teacher candidates participating in the Teacher Residency Grant program from $25,000 to $40,000, but the increase was included as part of the state budget earlier this year.
Teacher recruitment: Assembly Bill 934, authored by Assemblymember Al Muratsuchi, D-Torrance, would require the California Commission on Teacher Credentialing to spend up to $900,000 to contract with a public relations organization to develop a campaign highlighting the value of educators and urging people to become preschool to 12th-grade teachers. The campaign would also include information about the various pathways teacher candidates can take to earn their credentials.
“Most districts have found teachers to be in short supply, especially for math, science, special education and bilingual education,” said Muratsuchi, in his author’s statement. “Most districts are filling hiring needs with teachers on substandard credentials and permits, reflecting a statewide trend of increasing reliance on underprepared teachers. AB 934 will support the state’s numerous efforts to recruit and retain high-quality teachers, by building public awareness about the exciting and meaningful career of teaching.”
Assembly Bill 238, also authored by Maratsuchi, would have paid student teachers. The bill did not make it through the Legislature by Thursday’s deadline and was put in the inactive file. Legislators will consider the bill again next session, said Kerry Jacob, communications director for Muratsuchi.
“We will continue to work with the administration and stakeholders on solutions to pay student teachers, which will improve teacher recruitment to address California’s teacher shortage,” Jacob said.
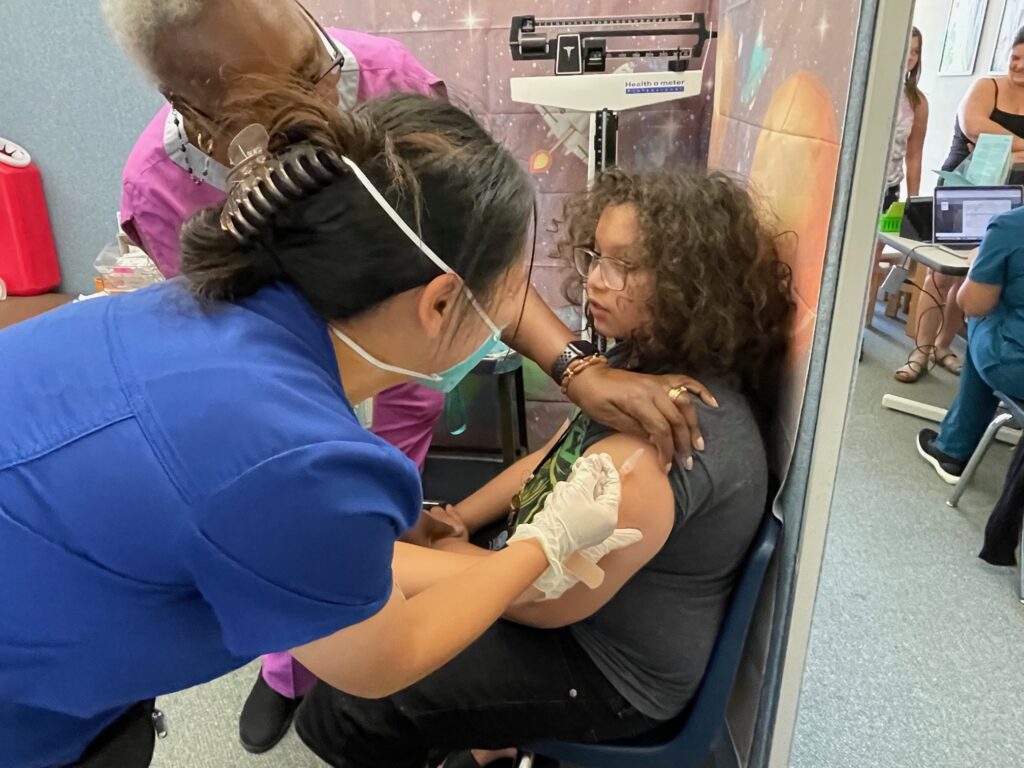
School nurse shortage
Vocational nurses in schools: Senate Bill 1722 will allow licensed vocational nurses to serve as school nurses when there are not enough credentialed school nurses. The licensed vocational nurses must be supervised by a credentialed school nurse.
There has been a shortage of credentialed school nurses for years. Although school nurses often work fewer days than their peers in hospitals and clinics, they are paid less and must take additional classes and pay more fees to get the job, which requires a school nurse services credential.
School districts can only hire a licensed vocational nurse if they can not find a credentialed school nurse for the job and if their school board votes to approve the hire.
“AB 1722 is a step toward enhancing the health and safety of our students in the face of a growing school nurse shortage,” said Assemblymember Megan Dahle, author of the bill. “This legislation recognizes the urgency of the situation — especially in rural areas of California, such as the 1st Assembly District — and provides schools with a viable solution to ensure trained medical professionals are available to address students’ medical needs.”
English learners and immigrant students
Seal of biliteracy: In order to earn the state seal of biliteracy on their high school diploma, students must show proficiency in English and another language. Assembly Bill 370 gives more opportunities for students to show proficiency in English, including high school GPA, standardized test scores, college-level English language arts class, Advanced Placement exams or SAT scores.
This is similar to what is required of students to show proficiency in a language other than English to obtain the seal.
Advocates say that many bilingual students, particularly English learners, have not received the state seal of biliteracy because there weren’t enough options to show students are proficient in English.
Newcomer data: Assembly Bill 714 requires the state to report the number of newcomer students, defined as students who were born in another country and arrived in the U.S. within the past three years.
It would also require the state to consider including resources specifically for teaching newcomers in the next revision of the English Language Arts and English Language Development framework. Currently, the framework includes resources for teaching all English learners, but not specifically for newcomer students.
In addition, the bill allows schools to exempt all newcomer students in middle and high school from some required coursework. Current law only exempts students enrolled in programs just for newcomers.
“AB 714 will ensure that newcomer students are more visible in our education system and receive the support they need for success,” said Martha Hernández, executive director of Californians Together, an organization that advocates for English learners.
Child care language surveys: Assembly Bill 393 requires child care centers and family child care homes that serve low-income children with state subsidies to ask all families about the languages they speak at home.
The idea is to incorporate more of children’s home languages in the child care program, to help support them in maintaining those languages and learning English. The information will also be shared with the state to monitor how many children speak languages other than English at home.
State-subsidized preschool programs have already been conducting the language surveys.
Bilingual teacher preparation: Assembly Bill 1127 re-establishes the Bilingual Teacher Professional Development Program to help prepare more teachers to work in dual-immersion schools or with English language learners.
The budget included $20 million to re-establish the program for five years. School districts in California have struggled for years to hire teachers with bilingual authorizations — a specialized credential required to teach English language learners.
In-state tuition for Mexico residents: Students who live in Mexico within 45 miles of the border would be eligible for in-state tuition at community colleges under Assembly Bill 91.
The bill would apply to community colleges near the border — Cuyamaca College, Grossmont College, Imperial Valley College, MiraCosta College, Palomar College, San Diego City College, San Diego Mesa College, San Diego Miramar College, and Southwestern College. Each college could enroll the equivalent of up to 150 full-time students.
In order for the bill to go into effect, however, the governing board of the California Community Colleges would have to enter into a similar agreement with a university in the state of Baja California, to allow California residents to attend there with in-state tuition as well.
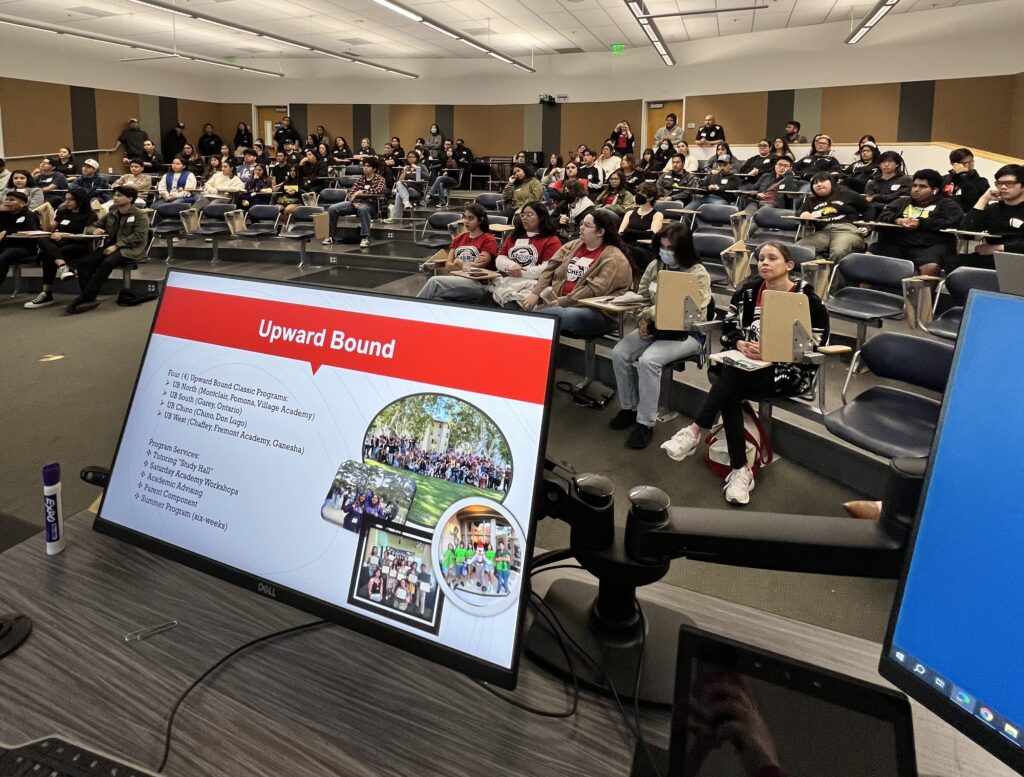
Dream resource centers: Assembly Bill 278 would establish a grant program to help more high schools set up Dream Resource Centers. Dream Resource Centers provide counseling on financial aid, immigration law, and other resources to help immigrant students and children of immigrants.
There is no funding in the budget for this grant, however, and the bill would not go into effect until the Legislature funds it.
School finance and funding
School facilities bonds: Given the choice of two very different bills to place a large school facilities bond issue before state voters in 2024, the bills’ authors and legislative leaders chose to hold back both in the final days of the legislative session. It will be up to the Newsom administration, through negotiations, to determine which version — or a blend of the two — makes the ballot.
Assembly Bill 247, authored by Assembly Education Committee Chair Muratsuchi, calls for a $14 billion bond issue for TK-12 and community colleges. Muratsuchi said it would include money for renovations and new construction, including transitional kindergarten facilities; seismic retrofits and safety repairs; improvements to adapt to climate change, reflecting the dangers of extreme heat, fire and flooding; and abatements from lead in water. The bill doesn’t say how the money will be apportioned. Senate Bill 28, authored by Sen. Steve Glazer, D-Orinda, would be for $15 billion, and would provide $9 billion for TK-12, including $500 million for charter schools and $500 million for career education, and $6 billion for UC, CSU and community colleges. It would be similar to a Proposition 13 that voters defeated by 47% to 53% in March 2020.
Advocates for a TK-12-community college bond will point to Proposition 13’s rejection as evidence that including higher ed bonding reduces the odds of passage. But others argue there were other reasons for the loss, including confusion over the number 13: a previous Proposition 13, still much in voters’ minds, was the 1978 anti-tax initiative. What’s clear is the need. Voters last passed a state bond, for $9 billion, in 2016, and there is already a nearly $4 billion backlog of school projects waiting for new money.
Raising LCFF funding: Legislation that would aim to increase funding for the Local Control Funding Formula by 50% over the next seven years almost made it to Newsom’s desk. But uncertainty about whether Newsom would sign it led the author of Assembly Bill 938 to pull the bill in the last week of the session.
The bill would re-establish a long-term funding target that was a feature of the 2013 law phasing in the funding formula. Since reaching the target amount in 2018-19, two years early, the Legislature has annually increased LCFF based on the cost-of-living (last year being an exception, with several billion dollars beyond the growing cost of living). AB 938 would increase base funding by 50% by 2030-31, while encouraging districts to use the new money to increase staff pay by that percentage over that time.
The author, Muratsuchi, said he would continue talks with Newsom’s finance team with the intent of incorporating the bill in the 2024-25 budget. He said it is needed to address staff shortages, although critics say districts should decide, without state pressure, how to balance the need for higher pay with other priorities, like reducing class sizes.
Instruction and testing
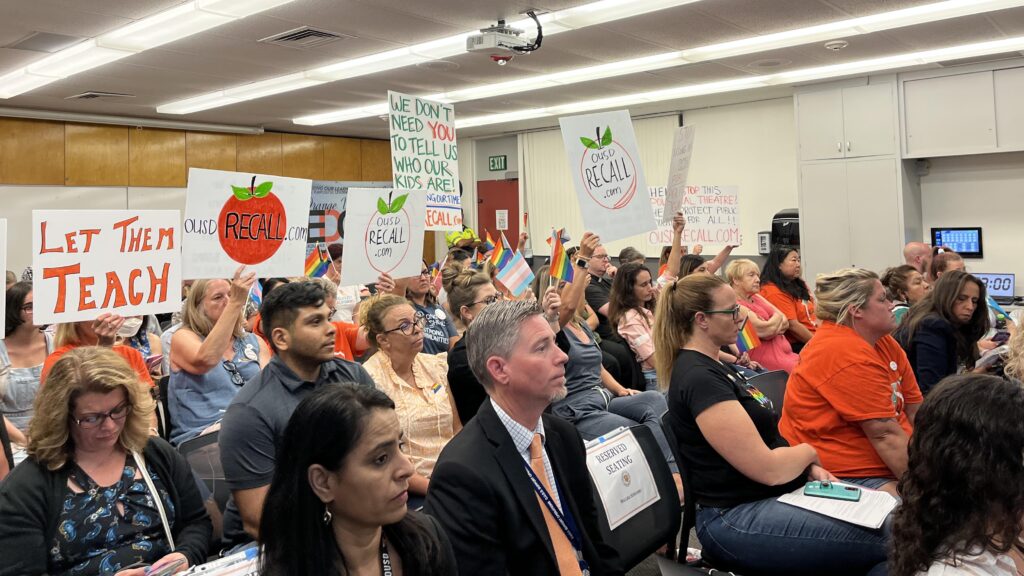
Textbook and library book censorship: Pushed by Newsom after a confrontation with the Temecula Valley Unified school board, Assembly Bill 1072 states that school boards would be committing censorship and discrimination if they refused to include materials or removed library books or textbooks that would interfere with California’s FAIR Education Act. The Fair, Accurate, Inclusive, and Respectful Education Act, passed in 2011, requires instructional materials to accurately portray the history, viewpoints and experiences of California’s diverse and underrepresented racial, ethnic and other groups, including LGBTQ+ Californians.
The bill, authored by first-term Assemblymember Corey Jackson, D-Perris, would enable parents and others to file a complaint charging a violation with their county superintendent or directly with the state superintendent of public instruction, who could order a remedy, such as the purchase of a library book or instructional material. If a school district refuses to update a curriculum or textbook intentionally to avoid FAIR Act compliance, the state superintendent could order a FAIR Act-compliant textbook for students, charge the district, and impose a one-time penalty of about $95 per student or $950,000 for an average district with 10,000 students.
Passed with an urgency provision, AB 1078 will take effect as soon as Newsom signs it, which is expected any day.
Reporting Smarter Balanced results: The California Department of Education will face a deadline to release Smarter Balanced results and other state testing data by Oct. 15 each year, starting in the fall of 2024, as a result of legislation that Newsom signed earlier this month.
Senate Bill 293,otherauthored by Sen. Shannon Grove, R-Bakersfield, comes one year after EdSource challenged the department’s decision to delay the release of the statewide test results until December 2022 to coincide with the release of data measures, such as chronic absentee data, in the California State Dashboard. EdSource argued that there was no legal justification for withholding test results because school districts and schools receive their numbers in late summer.
The Association of California School Administrators agreed in its letter supporting the bill. School districts will use the earlier release “to make informed decisions on many issues, including how to effectively distribute resources to maximize support for students,” the group wrote. “Parents and guardians will better understand how well their children are performing and how best to help them.”
Eliminating willful defiance: Senate Bill 274 would prohibit teachers from suspending fifth- through 12th-grade students for willful defiance until July 1, 2029. It would also extend the ban on willful defiance suspensions for sixth through eighth grades until July 1, 2029.
Willful defiance, as defined by the bill, involves disrupting school activities or the “valid authority” present.
The bill would expand on current California law, where students in first through fifth grades cannot be suspended for willful defiance, and first through 12th grade students cannot be expelled for the same reason. SB 274 would retain a teacher’s current authority to suspend any pupil in any grade from class for willful defiance for the day of the suspension and the following day, as long as the student is under supervision during an in-house suspension.
Basic Needs
CalFresh eligibility: Under Assembly Bill 274, grants, awards, scholarships, loans and fellowships will not be considered as income when determining eligibility for CalFresh.
Additionally, lump sums would only be considered for the month it is received, with the exception of social insurance payments such as veteran’s benefits, social security income, railroad retirement benefits and disability insurance.
Income from the U.S. Census Bureau and other government entities – along with federal pandemic unemployment aid – would also not be considered.
Mental health access: AB 665, authored by Assemblywoman Wendy Carrillo, D-Los Angeles, would allow children 12 years and older to consent to mental health treatment or counseling without the involvement of their parent or guardian. Under existing law, children 12 and older are allowed to consent to mental health treatment or counseling without the involvement of parents, but only after they demonstrate that they are in danger of serious physical or mental harm to themselves or to others, or be the alleged victim of incest or child abuse.
This bill, which would take effect July 1, 2024, would require the mental health professional to consult with the child before determining whether involvement of the child’s parent or guardian would be appropriate.
Lead in school water: California would expand its testing and treatment for lead found in public school water with more stringent standards under new legislation.
Water companies serving schools receiving federal Title I funding would be required to test all water outlets by Jan. 1, 2027, and report the findings to the state and school districts. Districts would be required to shut down the contaminated outlet immediately, notify parents within 30 days, and then replace the outlet or take measures other than running the water before school to dilute concentrations of lead, a standard remediation until now.
Assembly Bill 249, authored by Assemblyman Chris Holden, D-Pasadena, would cover all outlets, not just some, as a 2017 law requires, and also cover all pre-schools built on public property. The standard for taking action would be 5 parts per billion instead of the current 15 parts per billion. A 2018 analysis by EdSource estimated that 4% of outlets in schools had more than 15 parts per billion and 1 in 5 school outlets tested between 5 and 15 parts per billion. Scientists have concluded that tiny exposures to lead could damage children’s nervous system and organs and cause learning and attention difficulties.
State analysts project significant one-time costs for districts to do the remediation — money that might be reimbursable as a state mandate or funded through federal or perhaps state construction bonds.
Narcotic abuse treatment: Assembly Bill 816 would allow 16- and 17-year-olds to consent to replacement narcotic abuse treatment that uses buprenorphine by a medical professional or other medication-based opioid use disorder treatment by a licensed narcotic treatment program without the consent of their parent or guardian. Buprenorphine, one of the active ingredients in Suboxone, partially activates opioid receptors in order to reduce withdrawal symptoms in opioid addicts as they wean off of the drug.
LGBTQ students
Gender-neutral bathrooms: Senate Bill 760 requires all public K–12 schools in the state to provide gender-neutral restrooms for students to use during school hours by 2026, as long as they have more than one male and female restroom for students.
State law already allows students to use the bathroom that corresponds to their gender identity. However, some students who identify as non-binary require gender-neutral bathrooms, and some students who identify as transgender feel safer using a gender-neutral bathroom. This bill was written after meetings of an ad hoc committee on safe school bathrooms that was created by State Superintendent Thurmond in response to a 2021 proposal by Chino Valley Unified School District that would have required students to use the bathroom of their biological sex. That proposal did not pass.
According to a 2019 National School Climate Survey, 45% of LGTBQ+ and nonbinary students avoid gender-segregated school bathrooms because they feel uncomfortable and unsafe using them. Thurmond, who sponsored the bill, said providing an all-gender restroom at every public school is a “critical step toward preparing California students to succeed by ensuring the necessary steps of having a safe foundation to rely on: having a safe and inclusive place to use the restroom.”
Safe and supportive schools: Assembly Bill 5, authored by Assemblymember Rick Chavez Zbur, D-Hollywood, would require public school teachers and credentialed staff to take online training in LGBTQ+ cultural competency starting with the 2025-26 school year. Previously, the state “encouraged” schools to provide training on these topics every two years.
Zbur, in his comments supporting the bill, said despite progress, LGBTQ+ students still often experience harassment, violence and a lack of affirmation at school.
“AB 5 will provide public school teachers and staff, who are on the front lines of supporting California students, with the training and support they need to better serve LGBTQ+ and all students,” Zbur said.
Higher education
Community college transfer – Assembly Bill 1291, which the Legislature passed last week, attempts to simplify the process of transferring from a California community college to a University of California campus. Under a new pilot program starting at UCLA, students who complete an associate degree for transfer in select majors would be prioritized for admission. The program would later expand to additional campuses in limited majors.
Proponents say it would streamline the state’s transfer system since students can get a guaranteed spot somewhere in the California State University system by completing an associate degree for transfer. But the student associations representing UC and the community college system are opposed to the bill.
“The pilot ADT admissions program this bill would create does not contain any assurances for students that their hard-earned ADT can be used for admission at a UC or CSU of their choice. … Instead of attempting to pass a hastily drafted and last-minute legislation with no student input, we urge you to veto AB 1291,” the students wrote in a message to Newsom.
EdSource reporters Michael Burke, John Fensterwald, Diana Lambert, Mallika Seshadri, Zaidee Stavely and Ali Tadayon contributed to this story.
Correction: Two competing bills to create a state school facilities bond did not move forward, as first reported; they were held back for negotiations to determine which version will go to voters in 2024.


)