برچسب: school

  • Advanced algebra, data science and more: UC rethinks contested issues of high school math

    Advanced algebra, data science and more: UC rethinks contested issues of high school math


    Credit: JeswinThomas / Pexels

    Next month, a panel of University of California professors in the sciences and math will give their recommendations on the contentious issue of how much math high school students should know before taking a college-qualifying course in data science. Its answer could influence future course offerings and admissions requirements in math for UC and CSU.

    “There’s a tension between the interest in adhering to math standards and ensuring students learn math and also recognizing the changes that are happening in the uses of math in industry and the world in general,” said Pamela Burdman, executive director of Just Equations, a nonprofit that promotes policies that prepare students with quantitative skills to succeed in college. 

    “How UC resolves this issue will have a bearing on that, and the signals that UC sends to high schools about what is and isn’t approved will have a big impact on what this next generation of students learns.”

    The issue has embroiled California’s higher education decision-makers, and it mired proponents and opponents of California’s new TK-12 math framework in an acrimonious debate earlier this year.

    Advocates have cited the appeal of introductory data science as a way to broaden the boundaries of math to students who were turned off by it.  Traditionalists – STEM professors and professionals – countered that courses like introductory data science that include little advanced math content create the illusion that students are prepared for college-level quantitative work while discouraging them from pursuing STEM majors.

    Separate from this immediate question, a second group of UC, CSU and community college math professors is revisiting a more fundamental question: How much math knowledge is essential for any high school graduate with college aspirations, and separately for those interested in pursuing STEM, the social sciences or majors needing few quantitative skills?

    For the past two decades, the answer was cut-and-dried — and uniform. The CSU and UC defined foundational high school math as the topics and concepts covered by the three math courses – Algebra I, Geometry, and Advanced Algebra, which is Algebra II — that both systems require students to pass for admission. 

    With the state’s adoption of the Common Core math standards for K-12 in 2010, the options expanded to include Integrated I, II and III, which cover the same Common Core topics in a different order. Both UC and CSU encourage students to take a fourth year of math, and most do.

    The debate has centered on Algebra II. For future science, engineering and math majors, Algebra II is the gateway to the path from trigonometry and Pre-calculus to Calculus, which they must eventually take. But for the majority of non-STEM-bound students, Algebra II can be a slog: difficult, abstract and irrelevant to the college plans.

    Despite a general agreement that high school math should be more relatable and relevant, there is intense disagreement on the fix.

    New course offerings in the burgeoning fields of data science and statistics “present new ways to engage students. At the same time, they can foster the quantitative literacy — or competency with numerical data — that math courses are intended to provide,” Burdman wrote in a commentary in EdSource. “They have the potential to improve equity and ensure that quantitative literacy is a right, not a privilege.”  

    But with 17% of Black children, 23% of Hispanic children and 23% of low-income children scoring proficient in the latest Smarter Balanced tests, the need for effective and engaging math instruction must begin long before high school. The new TK-12 math framework, approved in July after multiple revisions and four years of debate, forcefully calls for fundamental changes in math instruction. 

    “Arguments about what content should be included in high school mathematics fail to acknowledge the elephant in the room: We haven’t yet figured out how to teach the concepts of algebra well to most students,” wrote psychology professors Ji Song of CSU Los Angeles and James Stigler of UCLA in an Edsource commentary.

    Committees of faculty senates of both UC and CSU have restated that Algebra II, along with geometry and Algebra I, provide the skills and quantitative reasoning needed for college work, in whatever paths students eventually choose.  

    “College and career readiness expectations include completion of these sequences or their equivalent that cover all of the Common Core standards,” the CSU Math Council wrote in a January resolution.

    But in 2020, the influential UC academic senate, which is authorized to oversee course content for admissions, sent a critical mixed message. In a statement, the Board of Admissions and Relations with Schools or BOARS invited proposals for a broader range of math courses for consideration that would enable students to “complete certain mathematics courses other than Algebra II or Mathematics III in their junior year of high school to fulfill the minimum admissions requirement.” BOARS said it saw the expanded options “as both a college preparation and equity issue.”

    Proponents of data science seized the opportunity, launching an end-run around what they perceived to be the inflexibility of math professors to change.

    New courses

    BOARS oversees policy, but the High School Articulation Unit, a small office in the UC President’s Office, does the evaluating and vetting of the tens of thousands of courses that course developers and high school teachers submit annually for approval. The office began authorizing new data science courses as meeting or “validating” the content requirements of Algebra II and Integrated III. The validation exemption presumed that the new course would build upon concepts and standards that students had covered in previous courses — in this case, Algebra II — or would be covered in the new course.

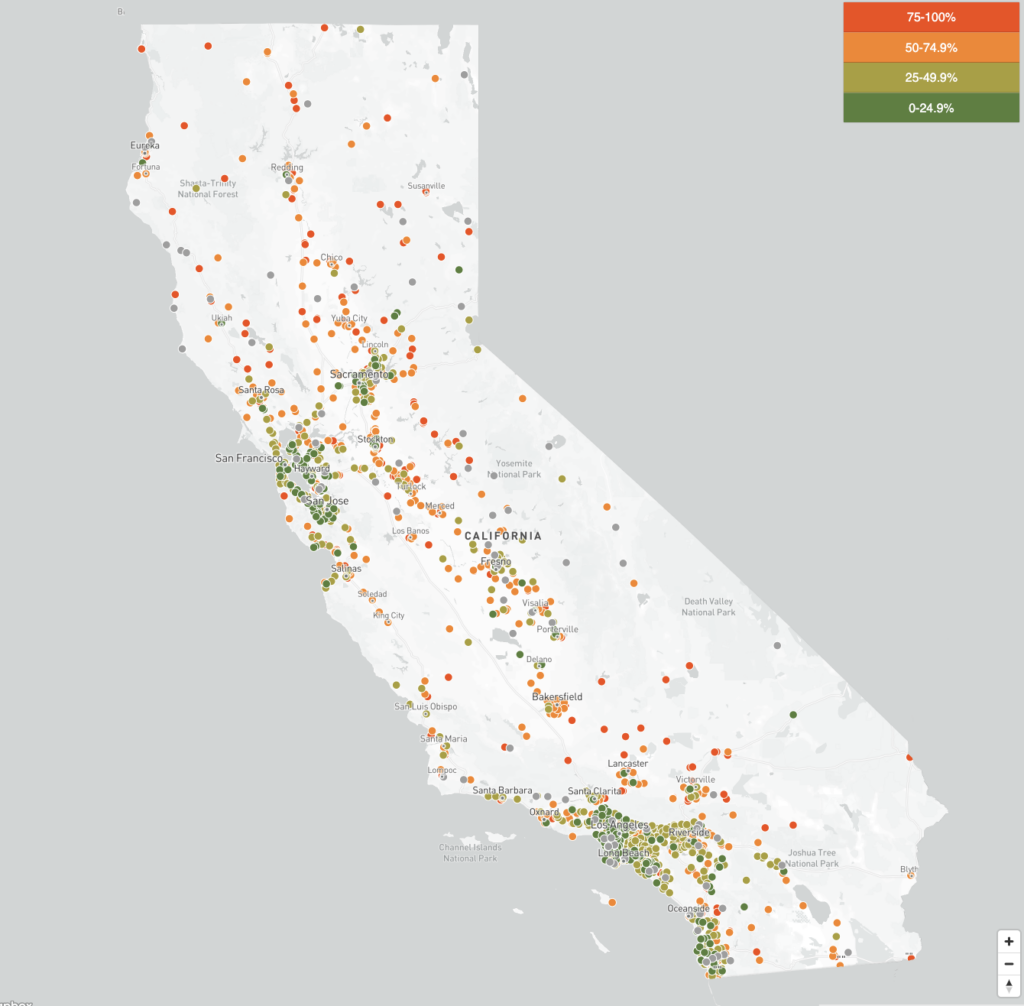
    Subsequently, 368 data science and related courses received approval for 2022-23 and 435 for 2023-24. Nearly all use one of a half-dozen or so data science curricula developed for high schools.

    There had been a precedent. As early as 2014, the UC had questionably validated statistics courses as satisfying Algebra II because they cover statistics standards that many Algebra II teachers frequently don’t get to, while not teaching other Algebra II content. However, extending validation to data science is more problematic since California has not established standards for the subject. As a result, there are no guidelines for what standards the courses should be teaching.

    A flaw in implementation or policy?

    In a detailed Nov. 12 letter to UC regents, Jelani Nelson, a professor of electrical engineering and computer sciences at UC Berkeley and a leading critic of weakening math requirements through course substitution, put the blame not on policy changes but on the course-approval process. An Articulation Unit with a small staff, none of whom had a background in STEM, was overwhelmed, he wrote.

    Others agree. Rick Ford, professor emeritus and former chair of the department of mathematics at CSU Chico, said that what once was a rigorous process for course approval had become a “horrendous” pro-forma exercise, “primarily reliant on the fidelity of submitters” to follow BOARS guidelines.

    The oldest and most popular course, Introduction to Data Science, developed by UCLA statistics professor Robert Gould through funding from the National Science Foundation and used throughout Los Angeles Unified, covered only the statistics standards, not other content in Algebra II. The same was the case with another popular course validated for Algebra II, “Explorations in Data Science,” developed by YouCubed, a Stanford University research center.

    Most students who had taken Introduction to Data Science so far had taken Algebra II, so that was not a problem. But those who took it as juniors in lieu of Algebra II might find the course shut doors instead of opening them. Those who might later decide they want to major in biology, computer science, chemistry, neurology or statistics, all of which require passing Calculus, would find themselves struggling for lack of Algebra II; the CSU, meanwhile, no longer offers remediation courses in math.

    “You’re asking a 14- or 15-year-old kid to make a lifelong decision in the spring of sophomore year,” said Ford, who chaired the influential Academic Preparation and Education Programs Committee of the CSU academic senate. “Watering down content is creating a multitrack system instead of giving all students the greatest chance of success.”

    A backlash followed

    News that UC was approving the substitution of data science for third-year Common Core math frustrated the faculty of CSU, which has relied on BOARS and the UC faculty for policy decisions since the two systems agreed to common course requirements, known as A-G, in 2003. Approving coursework that does not meet Common Core standards “brought to light the complete lack of control that the CSU has over the A-G high school requirements that are used for admission to our system,” the CSU senate stated in a January resolution. It called for the academic senates of both systems “to explore establishing joint decision-making” over new courses and changes to the A-G standards.

    In July, during the lead-up to the anticipated approval of the final version of the updated California Math Framework by the State Board of Education, tensions came to a head. Thousands of STEM professionals and UC and CSU faculty had signed petitions sharply criticizing earlier drafts of the math guidelines. The proposed framework had discouraged districts from offering Algebra I in eighth grade, compounding the challenge of taking Calculus before high school graduation, while encouraging students to take data science over STEM professions that were described as less interesting and collaborative. One of the five authors of the drafts was Jo Boaler, a prominent professor of mathematics education at the Stanford Graduate School of Education and co-founder of YouCubed.

    In the framework it adopted in July, the State Board of Education left it to districts to decide who should take Algebra in the eighth grade. The final version revised language conflating courses in data literacy, which all 21st-century students need, with math-intensive data science courses that, together with Calculus, would prepare students for a data science major in college. It also dropped a new third pathway for data science next to the traditional pathway leading to Calculus. 

    But the final framework hasn’t fully mollified critics, including Elizabeth Statmore, a math teacher at Lowell High in San Francisco and former software executive.

    “By encouraging students to abandon algebra before they’ve solidified their understanding, the (framework) makes it even more difficult for them to get back on that track — even more so now that our community colleges and CSUs have done away with remedial courses,” she wrote in an email. 

    “The only way we’re going to diversify STEM fields is to keep historically excluded young students on the algebraic thinking pathway just a little bit longer. That will give them the mathematical competencies they will need to make their own decisions about whether or not they want to pursue rigorous quantitative majors and careers.”

    Feeling the heat, BOARS hastily reversed positions on July 7 — days before the State Board meeting — revoking validation for meeting Algebra II requirements for all data science courses. And, in a letter to the State Board, BOARS Chair Barbara Knowlton requested wording changes to the proposed framework, which the board did, including deleting a diagram that showed data science as an option to sub for Algebra II.   

    “The data science courses that have to date been approved by UCOP’s high school articulation team appear not to have been designed as third- or fourth-year mathematics courses,” wrote Knowlton, a professor of psychology at UCLA.

    Ten days later, BOARS met again and clarified that there might be some exceptions for granting validation to those data science courses with “a prerequisite mastery of Algebra II content.” It also reiterated that the revocation of A-G credit would exempt students who are currently taking data science courses, with credit for Algebra II, or who had taken data science courses in past years.  

    “It’s been unfortunate that UC’s process of determining the rules has caused far more confusion than was needed,” said Burdman, the executive director of Just Equations.

    The minutes of the meeting revealed that BOARS members professed they didn’t know how the articulation unit in the President’s Office determined if courses could be substituted. Nor could they determine how many data science courses were designated as advanced math. The President’s Office said about 400 data science courses were being taught in California high schools.

    The minutes said that BOARS would appoint a working group, including professors of computer science, neuroscience, statistics and math, to clarify how to enforce the July 7 revocation vote, incorporate Algebra II as a course prerequisite, and determine the criteria for course validation.

    BOARS, whose meetings are not public,  hasn’t disclosed who’s in the group, although it includes no CSU faculty. The group has been meeting ahead of a December deadline so that BOARS can review and take action in January; only then will its recommendations be made public, Knowlton said in an interview. 

    There’s pressure to complete work in time for the next course cycle for the fall of 2024, starting in February, so that applicants know the new rules. “There is a concern among some people that if we don’t send this message quickly, there will be a proliferation of these courses,” she said.

    Knowlton hopes the work group will identify elements of algebra that are critical for student success and evaluate courses to see which ones don’t cover them. 

    “Some validated courses may leave out really very important foundational aspects of math, and we want to reiterate what those are,” she said. Course developers could choose to add concepts to qualify for validation for Algebra II; that’s what the developers of financial math have done. Or instead, they could offer courses like data science as advanced math in the fourth year of high school, with a prerequisite of Algebra II.

    Knowlton said BOARS is committed to equity in college admissions. But the challenge is balancing access and preparation, she said. “We want as much access as possible, yet it has to mean that students are prepared.”

    But Aly Martinez, the former math coordinator for San Diego Unified, is worried that efforts to create innovative and rigorous courses in data science and statistics will be swept aside if BOARS applies restrictions too broadly.

    After surveying students about their math interests, the district worked with the creators of CourseKata to turn its college statistics and data science course into two-year high school courses incorporating Algebra II standards and college and career pathway requirements. The courses can lead to Calculus for STEM majors; others can apply the knowledge to social science and other majors. The first-year course is popular and should be validated as satisfying Algebra II, she said.

    “There is momentum and excitement about this work,” said Martinez, who is now the director of math for the nonprofit Student Achievement Partners. “Those who are innovative should not be the ones getting hurt.”

    A fresh look at standards

    The second committee commissioned will take a broader and longer view of math content. Its members will include math professors from the CSU and community colleges, as well as UC, as a math subcommittee of a joint faculty body, the Intersegmental Committee of Academic Senates.

    Kate Stevenson, a math professor at CSU Northridge and member of the new workgroup, said, “It’s not our goal to rewrite the standards, but to emphasize what parts of the standards are really critical to all students’ success and which are critical to life sciences as opposed to engineers, physicists and chemists.”

    The committee will probably not recommend dropping math standards but could look at reorganizing or de-emphasizing them, she said.

    Few Algebra II teachers find time for statistics standards, she said. “So what would a third year look like with a better balance between statistics and algebraic skills? Could we repeat less of Algebra I if we did the integrated pathway?”  she asked. “Or what parts of the algebra curriculum could really belong in Pre-calculus rather than in Algebra II?”

    Although it is not the role of the committee, Stevenson said she thinks the Common Core standards deserve revisiting. “It’s not that I don’t like the standards. But it’s very unlikely the mathematics that we agreed to in 2013 is the mathematics that we think students should have in 2030.”

    Clarification: The article was updated Dec. 15 with the exact number of data science courses that the Articulation Unit of the UC Office of the President approved for 2022 and 2023; they were fewer than the article had implied.


    Source link

  • Salaries, benefits increase as school superintendents become harder to find

    Salaries, benefits increase as school superintendents become harder to find


    LAUSD Superintendent Alberto Carvalho is among the highest paid superintendents in the state.

    Credit: Credit: Julie Leopo / EdSource

    Superintendent candidates are in the driver’s seat in California, where openings are plenty and fewer veteran candidates are interested. The result is higher salaries, better perks and less experience required.

    Superintendent pay in California has skyrocketed in the last decade, with salaries in some districts growing more than 60%, according to an EdSource analysis of 53 California superintendent contracts.

    Contracts show salaries that range from $130,000 in rural McKinleyville in Humboldt County, where Julie Giannini-Previde leads a district of 928 students, to $441,092 in suburban Elk Grove, near Sacramento, where Christopher Hoffman is at the helm of a district of 63,000 students.

    Districts must pay a good salary to attract and retain qualified superintendents, said Nancy Chaires Espinoza, Elk Grove Unified school board president. Even with good salaries, some qualified people aren’t interested in applying for superintendent positions, she said.

    “It’s really hard to recruit and retain superintendents because the job has changed, and the job of superintendent has become much more difficult, given the political environment,” she said.

    A survey of 2,443 superintendents nationwide by the School Superintendents Association showed a median annual salary of $156,468 last school year, with pay increasing at districts with higher enrollment. No comparative salary data is available for California, although the California Department of Education has salary information for 2021-22. That year, superintendents in unified districts with 10,000 to 20,000 students earned an average yearly salary of $278,268 and superintendents in districts with 20,000 or more students averaged $319,443 a year. 

    “If the district really wants somebody, and they’re holding out for a higher salary, they’re probably going to get it because it is hard to find people,” said Cathy Nichols-Washer, who retired as superintendent of Lodi Unified School District last school year. 

    Superintendent contract highlights

    Alberto Carvalho, Los Angeles Unified: Car, driver, security, $1.5 million life insurance policy, $50,000 moving allowance, $50,000 for tax-sheltered annuity, can ask to cash out unused vacation days.

    James Hammond, Ontario-Montclair School District: Lifetime health benefits for himself and family, can cash out vacation days, $66,000 annual contribution to tax-deferred annuity.

    Donald Austin, Palo Alto Unified: Can choose to rent a house from the district for $1,800 a month or take an annual salary increase of $25,000.

    Samuel Buenrostro, Corona Norco Unified: He can’t take employees with him when he leaves the district.

    Bryon Schaefer, Kern High School District: Contract allows him to work as a consultant for the district up to 30 days a year for up to five years after retirement at the same daily rate he made as superintendent, with requisite raises.

    Kayla Johnson-Trammel, Oakland Unified:  Three-month paid sabbatical included in 2022 contract.

    Superintendent of fifth-largest district, one of highest paid

    Elk Grove’s Hoffman makes $1,000 more a year in salary than Alberto Carvalho, the superintendent of Los Angeles Unified, the state’s largest school district, according to the most recent employment contracts available to EdSource. Carvalho, who leads a district of 538,000 students, earns a $440,000 base salary, with no promise of annual raises.

    Hoffman’s current salary is a 63% increase over the $270,000 salary he received when he was hired in 2014. He also earned 2% bonuses this school year and last, as well as retroactive pay raises, according to his contract. Hoffman’s salary is higher because his car and expense allowances have been folded into his pay, said Chaires Espinoza. Last year Hoffman’s benefit package was worth $133,780, she said.

    Carvalho’s benefit package more than makes up for the difference in salary. It includes a $1.5 million district-paid life insurance policy, use of a car, a $50,000 annual contribution to a retirement account, the ability to cash out some vacation days, and the use of security and a driver if needed. He was also paid $50,000 in 2022 to relocate from Florida to Los Angeles. 

    Chaires Espinoza says Hoffman earns his salary. She credits his relationship with the district’s unions with enabling Elk Grove Unified to be the first district to close schools in the wake of the Covid-19 pandemic. She also cited Hoffman’s longevity as superintendent — nine years — and his knowledge of the district, as other reasons he is worth the paycheck. 

    “I can tell you unequivocally that he is the best superintendent in the state,” she said.

    Superintendents of large school districts aren’t the only ones making big salaries. Some superintendents in smaller districts out-earned colleagues overseeing much larger districts. Bay Area superintendents Donald Austin of Palo Alto Unified and Michael Gallagher at Sunnyvale School District, who earn $378,000 and $374,000 respectively, make more than superintendents in much larger districts in the state, including San Francisco Unified. 

    Pay increasingly tied to employee pay raises

    Superintendents are increasingly asking for “me too clauses” in their contracts that give them the same raises as the employees whose contracts they help negotiate. Almost a fifth of the superintendent contracts reviewed by EdSource contained these clauses.

    “That is more standard than not,”  said Dennis Smith, managing search partner for Leadership Associates, a recruitment agency that does many of the superintendent searches in California. “The superintendent will get the same increases as credentialed staff and administrators. That’s common. People don’t want to see the superintendent get a bigger increase than others.”

    Smith doesn’t think that this impacts superintendents’ decisions when negotiating with their unions. “The superintendent is going to negotiate the best package possible for the district,” he said. “I’ve never seen any self-interest involved in it.”

    Chaires Espinoza says there is no conflict because the school board approves all raises.

    But others disagree.

    “This is a textbook example of a conflict,” said David Kline, spokesman for the California Taxpayers Association, a nonprofit tax advocacy association. “It’s definitely a conflict. You essentially have one person sitting on both sides of the bargaining table. We would like to see the end to that sort of contract. The superintendent should be paid based on performance.”

    Benefits add cost, value to contracts

    There is a lot more to a superintendent’s contract than salary. It spells out how many days the superintendent will work, how much the district will contribute to health and retirement benefits, how the manager will be reimbursed for expenses and whether the superintendent can accept outside jobs, earn overtime pay, or cash out sick leave and vacation time. It even spells out the number of months that a superintendent will be paid if he or she is fired without cause.

    A healthy benefit package can more than make up for a lower salary. Some superintendents receive life insurance policies, stipends for advanced degrees, housing allowances, expense accounts, extra pay for advanced degrees, deferred compensation and annuities, longevity bonuses, lifetime health benefits and district-paid security.

    Less common are things like the option for Palo Alto Superintendent Austin to live in a district-provided house or boost his salary by $25,000 or the three-month sabbatical that was part of Oakland Unified Superintendent Kayla Johnson-Trammel’s 2022 contract.

    “We have noticed in news stories on superintendents throughout the state, it does seem they are being paid very generously from taxpayer funds with many perks the private sector couldn’t dream of receiving,” Kline said.

    Going Deeper

    The salaries of school staff, including superintendents, are public information, according to California state law, but not all school districts make the information easy to find. Even if districts post the initial contract on their website, most do not post the addendums that show superintendent pay increases approved over the years.  

    The California Controller’s Office collects salary data for all state jobs and makes it available on its Government Compensation in California website, but only 22% of school  districts reported salary data for 2022 – the most recent year data is available on the site. Unlike other state agencies, K-12 school districts are voluntary reporters. Senate Bill 924, meant to close a loophole that allows districts to avoid reporting employee income, failed in the state legislature last year.

    Without publicly posted salary and benefit information, the public must ask school districts for the information, often with a California Public Records Act request. Los Angeles Unified was one of the few school districts who have not yet fulfilled a request for public records filed by EdSource in October for this story. EdSource obtained Alberto Carvalho’s contract from another source.

    Superintendent benefits put district in the spotlight

    One case in particular has put superintendent pay and perks in the spotlight. In 2021, Ontario-Montclair Superintendent James Hammond earned $542,988 in wages and $200,608 in retirement and health contributions, according to the State Controller’s website. His wages grew because he was able to cash out 85 days of sick time and 25 vacation days, according to media reports. The district has 18,471 students.

    In 2022 the school board capped Hammond’s annual sick days at 85 and required that he wait to cash out his accrued sick days until he leaves the district, instead of annually, according to the Daily Bulletin. The move reduced his total compensation by $100,000 that year, according to the State Controller’s website.

    The Ontario-Montclair school board continues to be generous to Hammond. In July, the district increased his base salary to $368,547. The contract continues to allow the superintendent to cash out any of his 25 vacation days annually, or to accrue them and cash them out when he leaves the district. 

    Hammond also receives $2,500 a month from the district to pay for a life insurance policy and $66,000 — the maximum contribution allowed — to a tax-sheltered annuity. He and eligible members of his family also receive lifetime medical insurance benefits.

    “I can confidently attest that Dr. Hammond has instrumentally helped to positively transform the Ontario-Montclair School District over the last 14 years,” said board President Sonia Alvarado.  “As one of the most senior superintendents in San Bernardino County, students and families have benefited from his strategic vision and shared leadership style.”

    The amount of compensation is meant to retain Hammond, who could leave for a similar compensation package in a large school district, at a university or in the private sector, Alvarado said.

    “It is a very competitive market, particularly for large, urban school systems where there is usually a high turnover in the superintendent positions that often results in severance packages and settlements that are both costly and disruptive,” Alvarado said. “Recruiting and retaining effective leadership is one of the primary responsibilities a school board should prioritize.”

    CSBA advises against ‘compensation schemes’

    A California School Boards Association template for superintendent contracts offers advice for school boards that are thinking about keeping salaries low and offering bigger perks to superintendents to stay under the radar. 

    “Even when faced with such pressures, boards should avoid using ‘creative’ compensation schemes that tend to erode public trust, such as low salary but exorbitant benefits,” according to the CSBA.

    Instead, the CSBA suggested that the district offer a competitive salary and reasonable benefits that are comparable to what other districts are paying. 

    Legislators try to regulate pay, benefits

    Some states’ legislative bodies are considering capping the amount school districts can pay their school superintendents. California hasn’t taken that step, although state lawmakers passed a bill in 2013 to limit the maximum cash settlement to a district superintendent who is fired without cause to the amount of time left on his or her contract, or 12 months, whichever is less. Before that decision, superintendent contracts could include a payout of up to 18 months.

     Almost every employment contract reviewed by EdSource required that the superintendent be paid if they are fired or, in some cases, if there is a mutual agreement that they resign.

    Rachel S. White, an assistant professor at the University of Tennessee, Knoxville, who runs a research lab that collects data about school superintendents, said, “They (superintendents) are saying they want that protection because they know elections can happen, and the board turns over, and they’re out the next month.” 


    Source link

  • A refresher on the California School Dashboard | Quick Guide

    A refresher on the California School Dashboard | Quick Guide


    Children working together on Chromebooks

    Media arts classes can help children learn how to mix digital skills with the creative impulse.

    Credit: Mountain View Whisman Elementary School District

    The California School Dashboard is back in full color for the first time in four years.

    The dashboard, which the California Department of Education will release on Friday, is the state’s academic accountability and improvement tool designed for parents and educators. It rates the performance of every school, district and charter school, along with any of 13 student groups that attend them, with a color on seven indicators of performance, including math and English language arts test scores, chronic absence rates and graduation rates.

    First introduced in 2016-17, the dashboard was suspended because of the pandemic in 2019-20 and 2020-21, and resumed this year with the collection of two consecutive years of data needed to generate color ratings.

    Here’s a guide to the dashboard for first-time viewers and for those who need a brush-up course on how to read and interpret the colors and the data behind them.

    Why the dashboard?

    The Local Control Funding Formula, passed by the Legislature in 2013, required it — or something close to it. 

    Dissatisfied with the Academic Performance Index, which assigned a three-digit ranking to districts based exclusively on test scores, legislators mandated a broader look at school performance and conditions of learning through multiple measures. There would be no summative ranking; instead, there would be components, such as suspension rates, that would provide evidence for specific actions for improvement. The Legislature required that districts and schools highlight lowest-performing student groups, not just districtwide averages for all students that can shroud inequalities. The intent was to tie actions in a district’s three-year improvement strategy, the Local Control and Accountability Plan, or LCAP, to results in the dashboard.

    The dashboard also marks a shift away from the mindset of the federal No Child Left Behind Act. Instead of punishment for low performance, the funding formula promises guidance and assistance to districts with low-performing student groups. As State Board of Education President Michael Kirst and then-state Superintendent of Public Instruction Tom Torlakson wrote in a 2017 commentary for EdSource, “We have a rare opportunity to turn data into direct action. The state is now able to identify specific challenges school districts are facing and is committed to providing assistance rather than the sanctions of the past.”

    Which are the 13 student groups?

    African American, American Indian, Asian, English learners, Filipino, foster youth, Hispanic, homeless, two or more races, Pacific Islander, socioeconomically disadvantaged, students with disabilities, and white.

    What are the performance indicators?

    Chronic absenteeism measures students from kindergarten through eighth grade who were absent at least 10% of school days during the academic year, or at least 18 days.

    English learner progress indicator, which is new this year, measures progress toward English language proficiency by measuring English language learners’ results on the English Language Proficiency Assessments for California from the current to the previous year.  

    Suspension rate measures the percentage of students who were suspended for a total of one full day anytime during the school year (multiple suspensions of the same student are not factored in).

    Graduation rate measures the percentage of students receiving a high school diploma within four or five years or who complete graduation requirements at an alternative school.

    College/career indicator measures the percentage of high school graduates who are prepared for college or a career. It looks at the number of students who completed or fulfilled one or some of the following metrics:  

    • Advanced Placement exams. 
    • A-G course requirements for a state university.
    • A career technical education pathway.
    • College credit through dual enrollment.
    • An International Baccalaureate exam.
    • Leadership/military science program.
    • A pre-apprenticeship.
    • A state and federal jobs program.
    • The State Seal of Biliteracy.
    • Work-based learning experiences.
    • Performance rates on the 11th-grade Smarter Balanced tests in English language arts and math. 

    Schools or districts where 55% of students meet the criteria are rated high performance; at 70%, they are rated very high.

    English language arts indicator measures the Smarter Balanced test results and the California Alternative Assessments for grades three to eight and grade 11. It is determined by students’ average distance in points below or above the score that indicates a student performs at standard for the grade. A school’s or district’s participation rate counts, too.

    Math indicator measures the Smarter Balanced test results and the California Alternative Assessments for grades three to eight and grade 11. It is determined by students’ average distance in points below or above the score that indicates a student performs at standard for the grade. A school’s or district’s participation rate counts, too.

    Why are there colors?

    Seeking to create a tool that encourages improvement, the state board concluded that the most constructive measure would include both the results for the current year and an indication of whether those scores increased or decreased from the year before. A color reflects the intersection between both variables: the current status and one-year change; both factors are given equal weight. Schools with previously very low math scores that show significant improvement the next year, for example, are rewarded by moving up from red to yellow or green. Schools that suspended lots of kids this year compared with the year before will see the color change from green to yellow or orange — a signal that it’s time to pay attention and ask why.

    How are colors determined?

    Source: California School Dashboard

    A look at a five-by-five grid provides the answer. For every indicator, the results for the current year are divided into five performance categories, listed from top to bottom: very high, high, medium, low and very low. Change in performance from the previous year is also divided into five categories, listed from left to right: declined significantly, declined, maintained, increased, increased significantly. As in bingo, mark your X on the intersection of vertical numbers on the left with the horizontal numbers at the top.  

    To illustrate, consider the graduation rate of Santa Ana Unified. Its 89.7% graduation rate in 2023 is 3.3 percentage points higher than the state average, but the decline of 2.8 percentage points from 2022 pushed it from what might have been green or yellow to orange.  

    You have to look at the underlying data to understand a color, especially yellow. It could indicate good news or bad, depending on the change from the year before. It doesn’t mean satisfactory.

    Have the cut scores defining the performance levels and change been reset to reflect learning setbacks resulting from Covid?

    No. The same criteria that determined a red or blue in 2017 applies to 2023. However, because of the suspension of the dashboard during the pandemic, the 2023 dashboard will reset the rating process. Test scores were higher and chronic absences were a lot lower pre-pandemic than in 2023. Color ratings in 2023 understate some of those disparities by comparing 2023 results with those of 2022, the first post-pandemic year.  An EdSource analysis, found in 2019, 82 districts scored very high in math and 47 districts scored very low. In 2023, 63 districts scored very high, and 137 scored very low.

    Why is there no color this year for the college and career indicator?

    The results of the Smarter Balanced tests in 11th grade in math and English are a metric used to determine that indicator. There need to be two years of test results to measure change on the dashboard. No test was given in spring 2021, so there was no score for the class of 2022 and therefore no way to compare it with the 11th grade results for the class of 2023. Next year, there will be a color for the 2024 dashboard, with the publication of 11th grade scores in 2023 for the class of 2024.

    What is the equity report?

    The equity report is what you turn to by clicking on any performance indicator on the home page for any district or school. It takes you to a color breakdown of all 13 student groups with enough students to be measured. Click further, and it will show the underlying data — scores and the change from the year before — for each student group. Comparing the groups reveals disparities and rates of improvement, evidence for setting goals in the Local Control Accountability Plan to close achievement gaps.

    How does the dashboard define what low-performing districts and charter schools qualify for extra help, called differentiated assistance?

    It’s complicated.

    In writing the funding formula, the Legislature said that districts, county offices of education and charter schools should be held accountable for performance in several priority areas. The state’s seven statewide performance indicators fall within them: school climate (suspension rates); pupil engagement (graduation rate and chronic absences) and pupil achievement (the English Learner Progress Indicator and the math and English language arts tests).

    Districts and charter schools are eligible for differentiated assistance when one or more student groups get a red rating in two or more priority areas. They will receive help from a county office of education; poor-performing county offices, which also run schools, will get help from the state.

    In 2023, 466 school districts and county offices of education will be eligible for differentiated assistance; they represent 47% of the total. That’s 151 fewer than in 2022; the biggest factor was a decline in the rate of chronic absenteeism. While still at historic levels, the 5.7 percentage point statewide drop from 30% pushed the state and most districts into yellow, from what would have been red.

    The Legislature also established priority areas for which there are no statewide measures: Basic school conditions, such as appropriately assigned credentialed teachers and clean and functional school facilities; implementation of state academic standards; parent and family engagement, and access to a broad course of study. Districts have local options on how to verify annually that the standards have been met. A failure to meet the standards in a local priority area for two consecutive years can also qualify a district for differentiated assistance.     

    This year, for the first time, districts must address in their Local Control Accountability Plans how they will address student groups performing in the red on any indicator in any school. This new mandate is intended to ensure funding from the Local Control Funding Formula is directed to the students with the most needs.


    Source link

  • Search and compare data from the California School Dashboard, 2023

    Search and compare data from the California School Dashboard, 2023


    On Dec. 14, 2023, the California Department of Education updated the official California School Dashboard with the latest data for schools and districts. You can also view results for 2019, 2018, and 2017.* The dashboard shows achievement and progress, or lack of it, on multiple measures in color codes tied to performance metrics by the state. Enter a search term in the box to search by school, city, district or county. If a school or district does not appear, it means that no data is available. Detailed test scores are available on cells with an “i” (click to see more). For a full explanation, see the notes below the chart.

    * The 2022 California School Dashboard only displays that year of results, without comparisons to the previous year, due to disruptions caused by the pandemic. 


    School Name, City and County Chronic Absenteeism Rate Suspension Rates English Lang. Arts Performance Math Performance High School Graduation Rate English Learners Link
    School Name, City and County Chronic Absenteeism Rate Suspension Rates English Lang. Arts Performance Math Performance High School Graduation Rate English Learners Link

    Notes to Database

    Color Codes and Ratings: The dashboard includes five color-coded performance levels, based on a combination of current performance level and change over the previous year. The color spectrum ranges from red to orange to yellow to green to blue, with red signifying the lowest performance level and blue the highest.

    More information about how the performance levels were calculated is available at the California Department of Education’s website here.

    Column Headings:

    Chronic Absenteeism: Proportion of students who miss 10 percent or more expected days of attendance in a school year. (For a student enrolled for 180 days, this would be 18 or more days.) Note: This indicator is not reported for high schools.

    Suspension Rates: Based on a combination of current suspension rates and changes in those rates over time.

    English Language Arts Performance: Student performance in Grades 3-8 and 11 on the English Language Arts Smarter Balanced tests administered in the current year, combined with whether scores improved, declined or stayed the same compared to the previous year.

    Math Performance: Student performance in Grades 3-8 and 11 on the math Smarter Balanced tests in the current year combined with whether scores improved, declined or stayed the same compared to the previous year.

    High School Graduation Rate: Combined four-year and five-year graduation rates, including current graduation rate along with whether rates have changed over the previous year.

    For more information about how the performance levels were calculated, go to the California Department of Education’s website here.

    For the full dashboard for each school or district, go here.

    Read more:


    Source link

  • California School Dashboard released for the 2022-23 School Year

    California School Dashboard released for the 2022-23 School Year


    Students work together during an after-school tutoring club.

    Credit: Allison Shelley for American Education

    For the first time since 2019, the California Department of Education has fully updated the California School Dashboard that tracks the annual progress of K-12 students on factors such as standardized test scores, chronic absenteeism, suspensions and graduation rates.

    Since its rollout in 2017, the dashboard aims to show the progress of students at the state, district and school level using a color-coded system. It breaks this information down by 13 student subgroups, such as English language learners, disabled students and race and ethnicity. Friday’s update provides a snapshot of the progress made between the 2021-22 and 2022-23 academic years, representing the aftermath of the pandemic’s peak.

    Red signals the poorest performance, followed by orange, yellow and green, while blue signals the best performance. State officials say that anything below green indicates the need for attention and improvement. Amidst the pandemic, the state stopped releasing this information in 2020.

    The dashboard relies on some data, such as test scores and chronic absences, that was released in October. Other data — such as graduation rates and how many students met the entrance requirements to California universities, one measure of career and college readiness — were released Friday.

    For the first time, this year’s dashboard adds a color-coded score to measure how many English learners are making progress toward proficiency on the English Language Proficiency Assessments of California (ELPAC).

    On chronic absenteeism and English learner progress, the state’s status was yellow, a midway point between blue and red. The state’s status was orange — the second-worst status — for its suspension rate, graduation rate and performance on standardized tests for mathematics and English language arts.

    State officials said the results demonstrate California schools are making progress in the wake of the pandemic, which witnessed sharp declines in standardized test scores and a surge in chronic absenteeism.

    “Recovery from the pandemic has been a long process all across the country,” said California State Board of Education President Linda Darling-Hammond, in a statement. “While we have a long way to go, these results show that California is making strides, especially in enabling students to get to school and graduate ready for college and careers.”

    The rate of students graduating from high school who met the minimum course requirements to attend a CSU or UC reached an all-time high: 45.15%. That number has continued to steadily increase throughout the pandemic, up from 41.24% in 2016-17.

    The statewide four-year graduation rate is 86.2%, a decline from last year’s all-time high of 87%. State officials attribute 2021-22’s peak to a loosening of state graduation requirements and grading policies at the height of the pandemic. Officials say this most recent dip is due to a return to pre-pandemic policies.

    The dashboard’s color coding system takes into account both whether a metric is high or low, and also whether that metric has declined, maintained or improved within the past year.

    For instance, the orange ratings for math and English language arts test scores reflect the fact that after huge dips from pre-pandemic scores, there was little change from the previous year’s scores. Math scores edged up 2.6 points and English scores dipped 1.4 points. 

    The state’s chronic absentee rate in 2022-23 was 24.3%. That means nearly a quarter of students missed 10 or more days of school that year. That is a 5.7 point dip from the previous year’s all-time high of 30%. However, it is still a historically poor rate, roughly double the 2018-19 rate of 12.1%. Chronic absentee rates were above 20%, the worst category, in 62% of districts.

    Data shows that chronic absenteeism surged nationwide in the wake of the pandemic, and it hit nearly every school district. Experts have said that sick days from Covid and quarantining can account for part but not all of the rapidly increasing absentee rates. The CDE trumpeted the state’s declining chronic absenteeism rate.

    “This is encouraging news, and our work is not complete,” said Superintendent Tony Thurmond, in a statement. “We have made an unprecedented investment in services that address the needs of the whole child. We can see that those efforts are paying off, but this is only the beginning.”

    But some questioned whether the dashboard’s metrics provide a meaningful portrait of progress in the state.

    The dashboard was created before the pandemic when there were a different set of assumptions about what progress would look like in schools, said Heather Hough, executive director of PACE, a Stanford-based education research organization. Metrics didn’t tend to surge or nosedive year to year before the pandemic. Improvement on metrics like chronic absenteeism or standardized test scores are worth noting, she said, but the dashboard’s focus on one year of change can be misleading.

    “That can mask the concern that we should still be having: A lot of students are far behind where they have been, and large portions of students are not attending school,” Hough said.

    The color coding system has implications for which schools are eligible for additional assistance. Skyrocketing chronic absenteeism rates were largely responsible for a surge in schools that were eligible for differentiated assistance. In 2019, 333 school districts were eligible but by 2022 that number shot up to 617. This year 466 school districts were eligible.

    Advocates for English learners also worry that the way that the dashboard presents metrics is downplaying an urgent issue in education.

    The dashboard shows that about half (48.7%) of English learners in the state advanced at least one level or remained at the top level of English language proficiency, based on their scores on the ELPAC, a test English learners are required to take every year until they reach proficiency. This is about the same number who progressed as last year.

    CDE considers this to be a yellow score — a medium number of students making progress toward English proficiency, and not much change in how many did so. In order to reach green, the number of students making progress toward English proficiency would have to increase by 2 percentage points.

    Martha Hernandez, executive director of Californians Together, an organization that advocates for English learners statewide, said fewer than 50% of English learners making progress each year should be considered very low, or red, rather than medium, or yellow.

    “That seems to be a passing score, so to speak, and really doesn’t create the sense of urgency to really focus on the needs of English learners,” Hernandez said. “We really think the state has low expectations for districts having students make progress.”

    Hernandez said if students advance one level each year, they would achieve proficiency in six years, which is a reasonable expectation based on research. When students take longer than six years to achieve proficiency, they are considered long-term English learners and can struggle in middle and high school.

    Californians Together has advocated for the state to change indicators for English learner progress. The group believes that districts or schools should receive a high, or green, level of progress if at least 70% of English learners progress at least one level in one year. Currently, the state considers 55% of English learners progressing at least one level to be high.

    About a third of English learners (32.7%) in the state remained at one of the same lower levels of English proficiency as the year before on the test. Almost one fifth (18.6%) decreased one level in English proficiency.

    Districts achieved varied scores on English learner progress – 66 were red, 215 orange, 152 yellow, 192 green, and 43 blue.

    In addition, Californians Together criticized the fact that the dashboard rates English learners’ scores on English language arts and math tests together with the scores of students who have achieved proficiency in English in the last four years.

    “It’s a very, very weak picture of the needs of English learners,” said Shelly Spiegel-Coleman, strategic advisor for Californians Together.

    Melissa Valenzuela-Stookey, director of P-16 research at Ed Trust-West, said that the nonprofit that advocates for justice in education, is planning to dig into the data to get insight into what is happening for the state’s most marginalized students, but the initial data is concerning.

    “This data shows that the status quo for students of color is unacceptable, and we’re making alarmingly slow progress — but it also points to schools and districts that are proving that we can do better,” Valenzuela-Stookey said.


    Source link

  • Glenn Sacks: I Teach Immigrant Kids in an L.A. High School: Here’s the Truth

    Glenn Sacks: I Teach Immigrant Kids in an L.A. High School: Here’s the Truth


    Glenn Sacks is a veteran social studies teacher in a Los Angeles public high school. Many of the students he teaches are immigrants. He describes here what he has learned about them.

    He writes in Huffington Post:

    The author teaching in June 2025.

    Teacher Glenn Sacks

    “If they spit, we will hit, and I promise you, they will be hit harder than they ever have been hit before. Such disrespect will not be tolerated!” — Donald Trump

    President Trump says he is defending Los Angeles from a “foreign invasion,” but the only invasion we see is the one being led by Trump. 

    Roughly a quarter of all students in the Los Angeles Unified School District are undocumented. The student body at the high school where I teach consists almost entirely of immigrants, many of them undocumented, and the children of immigrants, many of whose parents and family members are undocumented. This week we held our graduation ceremony under the specter of Trump’s campaign against our city.

    Outside, school police patrolled to guard against potential Immigration and Customs Enforcement raids. Amidst rumors of various actions, LAUSD decided that some schools’ graduations would be broadcast on Zoom. 

    For many immigrant parents, graduation day is the culmination of decades of hard work and sacrifice, and many braved the threat of an ICE raid and came to our campus anyway. Others, perhaps wisely, decided to watch from home.

    They deserve better.

    Trump’s Homeland Security Secretary Kristi Noem calls us a “city of criminals,” and many Americans are cheering on the Trump administration and vilifying immigrants. What we see in LAUSD is an often heroic generation of immigrant parents working hard to provide for their children here while also sending remittance money to their families in their native countries. We see students who (usually) are a pleasure to teach, and parents who are grateful for teachers’ efforts.

    Watching the students at the graduation ceremony, I saw so many who have had to overcome so much. Like the student in my AP U.S. government class who from age 12 worked weekends for his family’s business but made it into UCLA and earned a scholarship. There’s the girl who had faced homelessness this year. The boy with learning issues who powered through my AP class via an obsessive effort that his friends would kid him about, but which he committed to anyway. He got an “A,” which some of the students ribbing him did not.

    Many students have harrowing, horrific stories of how they got to the U.S. — stories you can usually learn only by coaxing it out of them.

    There’s the student who grew up in an apartment complex in San Salvador, where once girls reached a certain age they were obligated to become the “girlfriend” of a member of whatever gang controlled that area. When she was 14 they came for her, but she was ready, and shot a gang member before slipping out of the country, going all the way up through Guatemala and Mexico, desperate to find her father in Los Angeles. 

    As she told me this story at parent conference night, tears welled up in her father’s eyes. It’s also touching to watch their loving, long-running argument — he wants her to manage and eventually take over the small business he built, and she wants to become an artist instead. To this day she does not know whether the gang member she shot lived or died. 

    At the graduation ceremony, our principal asks all those who will be joining the armed forces to stand up to be recognized. These students are a windfall for the U.S. military. I teach seniors, and in an average class, three or four of my students join the military, most often the Marines, either right out of high school or within a couple years. 

    Were these bright, hard-working young people born into different circumstances, they would have gone to college. Instead, they often feel compelled to join the military for the economic opportunity — the so-called “economic draft.” 

    Some also enlist because it helps them gain citizenship and/or helps family members adjust their immigration status. A couple years ago, an accomplished student told me he was joining the Marines instead of going to college. I was a little surprised and asked him why, and he replied, “Because it’s the best way to fix my parents’ papers.”

    Immigrants are the backbone of many of our industries, including construction and homebuilding, restaurants, hospitality and agriculture. They are an indispensable part of the senior care industry, particularly in assisted living and in-home care. Of the couple dozen people who cared for my ailing parents during a decade of navigating them through various facilities, I can’t remember one who was not an immigrant. There is something especially disturbing about disparaging the people who care for us when we’re old, sick, and at our most vulnerable. 

    Immigrants are woven into the fabric of our economy and our society. They are our neighbors, our co-workers, our friends, and an integral part of our community. The average person in Los Angeles interacts with them continually in myriad ways — and without a thought to their immigration status. 

    Immigrants are also maligned for allegedly leeching off public benefits without paying taxes to finance them. This week conservative commentator Matt Walsh called to ”ban all third world immigration″ whether it’s “legal or illegal,” explaining, “We cannot be the world’s soup kitchen anymore.”

    One can’t teach a U.S. government and politics class in Los Angeles without detailing the phenomenon of taxpayers blaming immigrants for the cost of Medicaid, food stamps and other social programs. My students are hurt when they come to understand that many Americans look at their parents, who they’ve watched sacrifice so much for them, as “takers.”

    Nor is it true. 

    Californians pay America’s highest state sales tax. It is particularly egregious in Los Angeles, where between this and the local surcharge, we pay 9.75%. As I teach my economics students, this is a regressive tax where LAUSD students and their parents must pay the same tax rate on everything they buy as billionaires do.

    Moreover, most immigrants are renters, and they informally pay property taxes through their rent. California ranks 7th highest in the nation in average property taxes paid. 

    Our state government estimates that immigrants pay over $50 billion in state and local taxes and over $80 billion more in federal taxes. Add this to the enormous value of their labor, and America is getting a bargain. 

    Part of what is driving the current protests is the sense that once somebody is taken by ICE, their families won’t know their fate. Where will they be sent? Will they get due process? Will they end up in a Salvadoran megaprisonwhere, even if it’s ordered that they be returned home, the president may pretend he can’t get them back? It is fitting that the flashpoint for much of the protests has been the federal Metropolitan Detention Center downtown. 

    We also question the point of all this, particularly since the Trump administration can’t seem to get its story straight as to why ICE is even here. 

    Trump’s border czar Tom Homan says the raids are about enforcing the laws against hiring undocumented workers and threatens “more worksite enforcement than you’ve ever seen in the history of this nation.” By contrast, Homeland Security Assistant Secretary Tricia McLaughlin, citing “murderers, pedophiles, and drug traffickers,” says the purpose of the raids is to “arrest criminal illegal aliens.” 

    And now, having provoked protests, the Trump administration uses them as a justification for escalating his measures against Los Angeles.

    Amid this, our graduating students struggle to focus on their goals. One Salvadoran student who came to this country less than four years ago knowing little English managed the impressive feat of getting an “A” in my AP class. He’d sometimes come before school to ask questions or seek help parsing through the latest immigration document he’d received. Usually, whatever document I read over did not provide him much encouragement.

    He earned admission to a University of California school, where he’ll be studying biomedical engineering. Perhaps one day he’ll help develop a medicine that will benefit some of the people who don’t want him here. 

    When we said goodbye after the graduation ceremony, I didn’t know what to say beyond what I’ve often told him in the past — “Just keep your head down and keep marching forward.”

    “I will,” he replied.

    Glenn Sacks teaches government, economics, and history in the Los Angeles Unified School District. His columns on education, history, and politics have been published in dozens of America’s largest publications.


    Source link

  • Trump freezes grant funding, upending school budgets

    Trump freezes grant funding, upending school budgets


    California State Superintendent of Public Instruction Tony Thurmond speaks at a press conference Tuesday, July 1, 2025.

    Credit: Kindra Britt/California County Superintendents

    Top Takeaways
    • The Trump administration announced it would withhold $811 million in grant funding the day before the money was to be released.
    • The grants fund teacher training, migrant education, school enrichment courses, summer school and after-school programs, and support English learners.
    • California education leaders call the funding freeze a political move that hurts the neediest children.

    The Trump administration’s decision to withhold $811 million in grants to California schools is a political move that weaponizes federal funding, California education leaders said at a press conference Tuesday.

    California isn’t the only state in President Donald Trump’s crosshairs. The White House has frozen a total of $6.2 billion in grants that Congress allocated to support English learners, teacher training, after-school programs and migrant education in schools in every state.

    State departments of education were notified of the funding freeze in an email sent on Monday, just a day before the money was scheduled to be released to school districts. The 84-word message said that the federal grants weren’t “in accordance with the President’s priorities,” said California State Superintendent of Public Instruction Tony Thurmond at the press conference.

    The president intends to withhold the funding approved in the 2024-25 federal budget while the grants are reviewed, according to Politico. In the meantime, Congress is set to approve a budget for 2025-26 that could eliminate the grants altogether or lump them into a block grant.

    “The president and his administration continue to pick on and bully those who are the least among us — students, those who rely on health care, those who rely on the federal government to have a chance at a great education and a great life,” said Thurmond, flanked by the leaders of various state education organizations. “And we won’t stand for it. It will not happen on our watch.”

    The loss of grant funding will impact students across the state, “in red and blue counties, in rural and urban areas,” said David Goldberg, president of the California Teachers Association.

    Among the programs at risk are Supporting Effective Instruction grants to improve the quality of the nation’s educators; 21st Century Community Learning Centers, which fund high school extended-learning programs; English language acquisition; migrant education; and Student Support and Academic Enrichment, which funds music, technology and other programs schools can not afford on their own. 

    Although the federal grant funds are only a small portion of the $8 billion in federal funding California receives for education, their sudden loss is a major disruption for school districts that have already budgeted funds for the upcoming school year.

    Freeze unravels school funding plans

    The U.S. Department of Education action will withhold $110 million from Los Angeles Unified, the state’s largest school district, said Superintendent Alberto Carvalho on Tuesday.

    “The majority of funds are targeting student populations that have some degree of association with fragile communities, and certainly, immigrant communities,” Carvalho said. “And, all this is happening today, as summer school continues, and (we) have immigration enforcement actions around our schools, spreading fear and intimidation.”

    LAUSD serves the country’s largest population of immigrant children and English learners, including through federally funded programs like the Migrant Education Program, which provides additional support for children of migrant agricultural workers.

    LAUSD recently approved an $18.8 billion budget that includes state and federal funding for the upcoming school year. 

    “The vast majority of districts across the state have already approved budgets, and the (Trump) administration knows very well what they’re doing,” Carvalho said. “They’re creating a disruption to the orderly operation of school districts by imposing a potential reduction after the approval, which would force us to reopen the books.”

    Carvalho said the district has “the reserves necessary to fill the gap in the short term,” caused by the $110 million rescission, and will not make immediate reductions to personnel or programs.

    To prevent long-term cuts, he said the district will join the expected legal action by California Attorney General Rob Bonta in hopes of an injunction and the release of withheld funds. 

    Other districts, such as West Contra Costa Unified in the Bay Area, will have a more difficult time managing without the federal funds. The district was able to approve a balanced budget for the upcoming school year, but only by spending down its reserves, said board President Leslie Reckler.

    The district has relied on the funding provided by the grants for years for a range of services, Reckler said.

    The announcement comes as the district is still digesting the fallout from being informed by the U.S. Department of Education that a five-year $4.2 million federal grant it had been awarded to place mental health interns in several schools would be cut to only one year for $600,000. The department told the district that the grant was no longer “aligned with the current goals” of the administration.

    Migrant education at risk

    The Monterey County Office of Education operates several migrant education programs during the summer break. The programs are for students whose parent or guardian is a migratory worker in the agricultural, dairy, lumber or fishing industries and whose family has moved during the past three years for work.

    The programs include academic intervention programs and tutoring to help students catch up with English, math, or other subjects; health services; family literacy programs for parents and guardians; and exchange programs for teachers from Mexico to support students who travel back and forth between Mexico and the U.S.

    The Trump administration is withholding $121 million in grants for migrant education in California.

    Constantino Silva, senior director of migrant education in Monterey County, said the county superintendent has said these programs will continue through July, even if federal funding does not come through. The county will either use leftover funds from the previous fiscal year or pull them from another source. 

    After July, he does not know how long programs will continue without federal funding, although the outlook is not good, he said.

    State has 1 million English learners

    Withholding $158 million in grants for English language acquisition could have a huge impact on California K-12 schools where 1 in 3 students speak a language other than English at home, Goldberg said.

    Martha Hernandez, executive director of Californians Together, said the announcement that federal funding is being withheld for English language acquisition has districts scrambling to figure out how they will provide legally mandated services to English learners.

    Administrators are frantic about what they’re going to do, particularly about staffing, because state law requires school staff to be notified in March if they are going to be laid off, she said. 

    “So now, having to think about, with declining enrollment and budgets already being tight, how are they going to possibly retain staff that have been paid for out of Title III?” Hernandez said.

    Districts are still required under federal law to provide services to English learners to help them learn English and help them understand their classes, she said.

    “It’s just an unconscionable blow to districts. To cut it on July 1, when the funding was supposed to be disbursed, is just really cruel,” Hernandez said.

    Summer school, teacher training impacted

    Several of the frozen grants could impact over 10,000 after-school and summer programs serving 1.4 million students, said Jodi Grant, executive director of the Afterschool Alliance. Many will have to close, leaving more children unsupervised.

    “Parents across the country are counting on these programs to support their kids this summer, this fall, and throughout the school year,” Grant said.

    The largest chunk of funding being frozen is $232 million from the Supporting Effective Instruction grant, which can be used to reform certification programs, support new teachers, provide additional training for existing teachers and principals, and reduce class size by hiring more teachers. 

    In February, the Department of Education threatened to withhold federal funding from schools and colleges that did not abandon “diversity, equity and inclusion” programs.

    Last month, Trump also threatened to withhold federal funding from states or schools that allow transgender students to play sports on teams that align with their gender identity. The state went to court seeking to have the funds restored and won. 

    But even after California won cases against the Trump administration, it has sometimes had trouble drawing down funds from the federal government.

    Thurmond said it may look for legal recourse again to restore the grant funding.

    “We are going to push back on these egregious overreaches by the federal government and what we’re calling an illegal impoundment of federal education dollars,” Thurmond said.

    In the meantime, David Schapira, chief of staff for Thurmond, recommended that school districts consult their legal counsel on how to proceed while the grants are in limbo and make individual decisions about what is best for their communities based on the information available.

    Education leaders at the press conference had strong words about Trump’s actions. The president is willing to punish students in states that refuse to conform to his political ideology, Schapira said.

    “The taxpayers entrusted their elected representatives in Congress to appropriate dollars that are meant to serve students across this country. Those should not be held hostage by the priorities of one person,” Schapira said.

    Lasherica Thorton and Louis Freedberg contributed to this report.


    Source link

  • Hanford program supports teen parents while they finish high school

    Hanford program supports teen parents while they finish high school


    File photo of a student in the HOPE (Helping Our Parenting Students Excel) program. At varying levels, HOPE is a part of nearly 50 Learn4Life centers in California. Some schools only provide donations for baby supplies and access to support groups while larger schools have separate classrooms for its HOPE students, including the Hanford campus.

    Photo courtesy of Learn4Life

    Pregnant in high school, 14-year-old first-year high school student Giselle Meza said she feared she’d be judged by her peers. She was one of only two pregnant teens at her school and felt isolated. She missed a lot of classes, falling behind. 

    Statistically, Meza has about a 50% chance of dropping out of school altogether. She hasn’t; instead, she withdrew from Hanford High to participate in Helping Our Parenting Students Excel at Kings Valley Academy, a Learn4Life campus — a network of dozens of public charter high schools across the state and nation. 

    The HOPE program and Learn4Life structure empowered her to walk onto the campus without feeling alone. The program provided her with peer support from other pregnant and teen parents, a personalized learning plan, and the ability to bring her daughter to school. 

    In a designated HOPE room at Kings Valley Academy, shelves stocked with children’s books line the walls. Educational toys, playpens and swings cover the floor. 

    The room is a home away from home, where Meza could nurse, tend to or play with her daughter, Desirae, while continuing her high school education and gaining skills to better herself. 

    Teen parents have thrived in that environment, including Nevaeh D. who earned a full scholarship to UCLA after graduating from Learn4Life. “While I did my lessons, she was sleeping or playing alongside me,” Nevaeh said in an April media release announcing her graduation from Learn4Life. For student privacy, the school did not disclose Nevaeh’s last name.

    “So many of them think they’re the only ones in this position,” HOPE founder Staci Roth said. HOPE, however, creates an environment where pregnant and parenting teens feel seen, safe and supported, Roth told EdSource. 

    After more than a year in the program, Meza, now 16, no longer feels isolated, and is comforted by “being surrounded by people going through the same thing.” 

    “We take away the shame and the stigma,” said Christianna Percell, assistant principal at Kings Valley Academy. 

    How HOPE started 

    Seven years ago in 2016, while working at Learn4Life Panorama City in Los Angeles, Roth noticed that pregnant and teen parents struggled to attend class. She started a group with teen moms to learn what obstacles were preventing them from coming to and staying in school. 

    Schools needed to do more to support them, she said. She designated one classroom for the group of teen parents and brought in swings and bouncers, diapers and wipes. 

    “Just made it their safe space,” she said. 

    By 2018, HOPE had grown from eight to 63 students in the Learn4Life schools, as word spread that parenting students could bring their kids to campus. 

    At varying levels, HOPE is now a part of 48 Learn4Life centers in California. Some schools only provide baby supplies and access to support groups, while larger schools have separate classrooms for its HOPE students, which, to Roth, has been the best way to achieve the organization’s goal of creating a safe space for parenting students to feel supported. 

    Learn4Life’s Hanford location adopted the program three years ago with about a dozen parenting teens. Today, the program serves almost 60 teen parents, said Lindsey Hoskins, the supervising teacher who oversees the HOPE program in Hanford. 

    “I was a teen parent,” Hoskins said. “There was no place I could take my baby.” She said she remembers having the choice of dropping off her child while she was at school or staying home to nurse the baby.

    As a result of HOPE, Hoskins said student parents aren’t dropping out like they were before the program’s implementation. 

    Being supported 

    The HOPE program allows students with children to bring their kids to school, so they can work toward a high school diploma at their own pace while receiving mentorship, supplies and peer support. Students have access to essentials such as diapers, car seats, strollers, cribs, clothes and toys, so the teens don’t feel pressured to work as much or to spend their earnings on baby supplies.

    Instead, the student parents can focus on their education and their children, Roth said. 

    The program provides resources by connecting the teens to community partners, providing transportation when needed or simply offering encouragement. 

    “We may be providing diapers and formula now while they’re at school,” Roth said, “but at the same time, connecting them to where they can get that in the future if they need it.” 

    The peer support ensures the parenting teens don’t feel alone and allows them to learn from each other, Roth said. 

    In the HOPE room, parenting teens often step in and help with a crying baby that has colic, Roth said. Or during a support group meeting, they’ll bounce ideas off of one another to treat a rash. “They’re their best teachers to each other.” 

    Teen parent Nevaeh earned a scholarship to UCLA after graduating from Learn4Life, which allowed her to continue her studies while bringing her daughter to the Hanford campus.
    Photo courtesy of Learn4Life

    Students also learn life skills, such as financial planning, lessons about child development, health and nutrition, as well as job readiness and career skills.

    Over time, HOPE programs have added elective classes to teach parenting skills; Roth said students can learn to be better parents while gaining needed credits to graduate.

    Created based on student input, skills classes range from preparing for childbirth and breastfeeding to building healthy relationships and co-parenting. Hoskins said students can pick a topic that’s specific to their life or situation. Some of Hoskins’ students have completed classes for potty training and teething — which has allowed them to gain confidence and address the challenges they currently face as a parents. 

    “They feel so empowered to take care of their little ones,” Roth said.

    According to a 2010 study of women in their early 20s, 53% of women who became moms as teenagers graduated with a high school diploma, in contrast to 90% of women who did not become teen parents. 

    Such statistics, Roth said, were the driving force behind HOPE’s goals: teaching teens how to parent and to support their family while encouraging and equipping them to go to college or find a career after high school. 

    Students supported by the HOPE program graduate at a 6% higher rate, according to Learn4Life and HOPE statistics. 

    Addressing the whole child

    Several parenting students said they joined HOPE because they no longer felt comfortable at their traditional schools after becoming pregnant, the Learn4Life staff said. 

    “We’ve heard the stories from our students (about) how they felt at their school when they found out they were pregnant,” Roth said. 

    To break that cycle, HOPE staff builds supportive relationships, Roth said. 

    “We say we’re going to be here, and we are here,” she said. “We say we’re going to support them, and we do support them. It’s life-changing for them to have someone who asks about their day (and) to call your teacher in emergencies.” 

    HOPE students can be teen mothers or fathers as well as students who help care for their siblings. Kristen Cooper, 17, nearing the completion of her sophomore year, brings her one-year-old brother to the program while her parents work. She said she gained trusting relationships with adults because of the program. 

    The HOPE and the Learn4Life school model allows staff to build lasting, meaningful relationships with students by addressing all their needs. 

    The school’s model focuses on one-on-one instruction, flexible scheduling and personalized learning, said Ann Abajian, a spokesperson for Learn4Life. Students, including those in HOPE, have the option to work virtually or spend minimal hours at school. 

    A “team of teachers” manages students’ action plans and goals as they get “layers of support” through tutoring; one-on-one, small group and traditional class instruction; three school counselors and an onsite therapist; resiliency programs, such as yoga, meditation and classes that teach organizational skills and coping mechanisms; and an alumni support group. 

    That support helps students navigate their challenges, including not being able to attend a traditional school because they’re dealing with social-emotional trauma, working every day, helping care for a sibling or raising a child. 

    Staff members are trained to be trauma-resilient education professionals who provide tools to build the resilience to face their past, present and future, said Roth, who is also the school’s coordinator of trauma-resilient education. 

    Students who take part in the HOPE program, Roth said, come to the Hanford campus for one-on-one instruction with their teachers. The difference for HOPE students is the designated space to bring their children. 

    Meza, the student who joined HOPE to avoid judgment at her traditional school, spends a lot of time on campus because she feels more comfortable there than in her own home, she said. There’s more room for her one-year-old daughter to play, and she gets the help she needs from staff. 

    “I’ve been doing better than ever, honestly,” Meza said about now being nearly finished with her first year of high school. 

    HOPE is ‘different’ from other youth parenting programs

    Schools in California have operated youth parenting programs for decades. Currently, programs are under the umbrella of Cal-Learn, a state program designed to encourage pregnant and parenting teens to graduate from high school or gain the equivalent, become independent and form healthy families. 

    Sixty percent of teenage parents who are currently receiving welfare will depend on government aid for 10 or more years, according to research noted in the legislation that established Cal-Learn to address the “unique educational, vocational, training, health, and other social service needs” of teen parents. 

    The Youth Parent Program in Clovis Unified, for example, serves parenting teens who are trying to graduate. 

    With a 91% graduation rate, the parenting program supports students on their journey to finishing high school and helps them gain basic parenting skills, district spokesperson Kelly Avants said. 

    The program is meant to “come alongside” students who are teen parents, ensuring they have access to transportation, nursing, counseling, academic support, encouragement to “stay in school, pass their classes and ultimately graduate,” and the skills to “parent well,” Avants said.

    Through the program, teen parents can learn areas such as basic infant CPR, lessons on childhood development and ways to be engaged parents.

    But HOPE is different, Hoskins said, because it’s on Learn4Life campuses, where educators can give students what they need with specific programming, such as personalized learning and the elective classes picked by students.

    “We meet them where they are,” Hoskins said. 

    ‘Impacting generations’

    The percentage of teen parents who do not finish school contributes to high incidences of their own children not graduating.

    The federal Centers for Disease Control and Prevention found that the children of teenage mothers are more likely to drop out of high school, give birth as a teenager and face unemployment as a young adult, among other findings.

    Generational impact on kids

    A child who comes to campus sees their parent studying — something HOPE staff believe will foster a child’s love for school and can break the cycle of dropping out.

    Mayra Hernandez, 18, said her 2-year-old son Sebastian loves his preschool and isn’t shy like some of the other kids because he attended HOPE with his mom for the first two years of his life. She said Sebastian eagerly plays with and communicates with his peers.

    Parenting teens, Hoskins said, are “bringing their child who is exposed to books (and) exposed to mom reading,” Hoskins said. “They’re exposed to literature, structure, education, other peers and social behavior and norms.”

    “(Teen pregnancy) has such a generational impact,” Roth said. “This population has its own obstacles and trauma that go along with (being a teen parent).”

    Acknowledging those “high statistics,” Roth and Hoskins said the aspects of the HOPE program — bringing kids to campus, graduating from high school, gaining life and parenting skills and learning about careers — are “impacting generations.” 

    “I would be struggling still,” 18-year-old Mayra Hernandez said in hindsight. Her mom, also a teenage mother, didn’t graduate from high school. Hernandez, considered an 11th grader, said she is better able to manage her time as a mother and student because of HOPE’s and Learn4Life’s model. She is dual enrolled in high school and the West Hills Community College District and works two jobs to pay her bills. 

    She considers herself on track to graduate and pursue a career. Hernandez gained nearly 60 credits in just a month at Learn4Life,  has completed a semester of college through dual enrollment and plans to either become a traveling nurse, ultrasound technician or a medical professional in the Navy. 

    Hernandez said it will be “inspiring” for her son to see her graduate.

    Meza said she once viewed the military as her only option after graduation, but now after high school, her goal is to become an ultrasound technician — all because HOPE expanded what she viewed as her choices. 

    “A lot of our students will tell you, ‘I would not graduate high school if it wasn’t for Learn4Life and the HOPE program,’” Hoskins said. “Things that are deemed not possible are happening.”


    Source link

  • WCCUSD school psychologists face burnout due to consistent staff shortages

    WCCUSD school psychologists face burnout due to consistent staff shortages


    A group of WCCUSD school psychologists at a union contract rally in 2023.

    Courtesy of John Zabala

    West Contra Costa Unified School District’s school psychologist internship program once flourished. The district recruited from substantial applicant pools from local universities and provided a strong start for beginning school psychologists entering the workforce, often retaining them after the internships ended. 

    Now, however, in the years since the onset of the COVID-19 pandemic, WCCUSD is struggling to recruit interns and fill vacant school psychologist positions. This means psychologists, considered essential pieces of school environments, are carrying larger case loads and working longer hours, leading to burnout.

    WCCUSD, like other districts across the state, is no stranger to staff shortages — the district started the 2023-24 academic year with more than 200 special education paraprofessional vacancies. The shortages have persisted, and on Jan. 31, Public Advocates, a nonprofit civil rights law firm, filed three complaints with the district, alleging some schools failed to provide students with qualified teachers because of problems related to staffing shortages.  

    School psychologists fill a critical role in school communities, collaborating with administration, teachers and parents to ensure students are succeeding academically, emotionally and behaviorally. 

    West Contra Costa has struggled with five to seven school psychologist vacancies for the past couple of years. Halfway through the current school year, the district is still dealing with three.

    “We’re going to weather, this obviously, but we still have a couple of years in which we are going to have a really significant shortage, and we’re going to have a really significant increase in the demand for services, so we’re kind of in for a little bit of a scary period,” said John Zabala, a school psychologist in the district and the president of United Teachers of Richmond. 

    California is generally facing a critical shortage of school psychologists. According to the California Association of School Psychologists, the National Association of School Psychologists recommends a ratio of 1 school psychologist for 500 to 750 students. However, California schools on average have 1 per 1,000 students. Some schools have 1 per 3,000 students.

    Although WCCUSD’s ratio falls into the recommended range at around 1 school psychologist per 500-550 students, school psychologists in the district still face large caseloads and longer work days, contributing to burnout.

    Some districts compensate for shortages by hiring contractors or traveling school psychologists. Emily Springhart, department co-chair of psychology at West Contra Costa, however, said the district has preferred increasing the caseload of school psychologists and extending their work days to deal with the shortage.

    “A lot of the report writing and the case management — those things just go home with people,” Springhart said. “I’m sure it’s not great for their own personal health.”

    Schools have seen a substantial increase in the number of students requiring mental health and behavioral resources in recent years. In April 2022, 69% of public schools reported that the percentage of students seeking mental health services had increased since the start of the COVID-19 pandemic, according to the National Center for Education Statistics. Covid-19 disrupted early intervention for many students, leading to an increase in the number of students needing support, while the staff who would be able to support them, like school psychologists, have not. 

    Mary Campbell, a WCCUSD school psychologist and former department chair, said she worries about what the shortages and the resulting burnout could mean for the longevity of the profession. 

    Springhart said the school psychologist shortage seems to be caused by the same factors triggering shortages of other school staff: inevitable events like retirement, but also financial hardship, forcing people to move out of parts of California with high costs of living. 

    But another cause lies in the declining number of incoming applicants from universities that typically feed into districts like WCCUSD. Springhart said the number has steadily declined, despite the district having a long and strong history of hiring school psychologists from those programs.

    “It seems like all of the districts are kind of fighting over everybody right now, just because there’s not enough people coming out of programs,” Springhart said.

    Oanh Tran, school psychology program coordinator for California State University, East Bay, said she’s actually seen an increase of applicants to the program in recent years. But because the Bay Area is home to so many school districts, there aren’t enough school psychologists to go around.

    “We have so many districts, so many schools, and just a handful of students are graduating with their PPS (Pupil Personnel Services) credential to service those schools and districts,” Tran said. 

    Tran said new school psychologists are also experiencing burnout earlier in their careers. Not only are they dealing with more assessment caseloads, but they’re also spending their days putting out fires likely caused by a lack of early intervention.

    The best districts, Tran said, prioritize monitoring the needs of their school psychologists, ensuring they have access to helpful mentors, have a manageable caseload, and feel supported by their team. Students are being strategic about finding districts that provide these resources, Tran explained. 

    “In West Contra Costa, I do remember there was a time where they did have a lot of our practicum and interns,” Tran said. “But now, I think because there are so many districts that are recruiting our students, it’s competitive. It’s so competitive. We only have so many students in our cohort, but we have over 50 districts now participating in our recruitment fair for our students.”

    Although West Contra Costa offers competitive pay, especially after salary increases last year, Springhart agreed the shortage has been a regional issue, extending beyond the district. She said more education and recruitment about the profession may be necessary to increase the number of applicants to school psychologist programs. 

    “I think there are ways that we know that we can attract and keep people in these jobs, which can be very rewarding jobs,” Campbell said, “but not when we’re so under-resourced.”


    Source link

  • Interactive Map: Most California high school students don’t take courses needed to apply to CSU or UC

    Interactive Map: Most California high school students don’t take courses needed to apply to CSU or UC


    This is a very important chart to raise awarement across schools, districts, and the state; however, I think it needs to be corrected that these are students who don’t pass these college-prep courses with a C or higher. It sends the wrong message to say that these “students don’t take courses needed to apply to CSU or UC” as I know that most students in many schools/districts do take these courses — they just … Read More

    This is a very important chart to raise awarement across schools, districts, and the state; however, I think it needs to be corrected that these are students who don’t pass these college-prep courses with a C or higher. It sends the wrong message to say that these “students don’t take courses needed to apply to CSU or UC” as I know that most students in many schools/districts do take these courses — they just don’t get a passing grade, which is another systemic issue that needs to be tackled.


    Source link