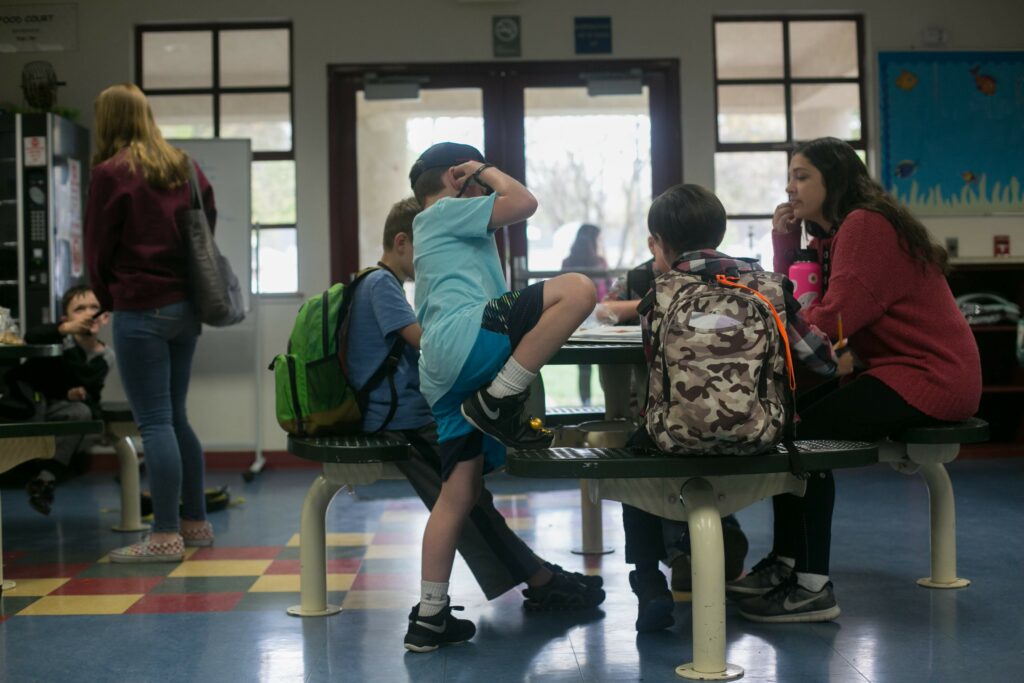
Students at Robbins Elementary work in groups during a math lesson about scale.
Credit: Sydney Johnson
The state of California is at the global forefront of technological innovation and artistic inspiration. It’s also a powerhouse economy in its own right, currently the fifth largest in the world. We might expect — we should expect — such a place to deliver a world-class education to the 6 million public school students in its charge.
This is not the picture that emerges from the most recent National Assessment of Educational Progress. These assessments found fewer than a quarter of California eighth graders performing at or above the “proficient” level in math. This represents both a decline from the state’s previous NAEP performance and a significant undershooting of the national average performance for eighth grade math.
But the good news is that California is on the verge of a major education opportunity: The State Board of Education is scheduled to adopt new math curriculum in 2025, and high-quality instructional materials are a powerful, proven lever for improving student outcomes in math.
The magnitude of this opportunity was made clear in a recent, California-focused report from the Center for Education Market Dynamics. My partners and I co-founded this nonprofit in 2020 to investigate, illuminate and help improve the murky national curriculum landscape. Our research indicates that 62% of California districts in our sample have in place a math curriculum from the state’s 2014 adoption list for elementary school, and 76% for middle school.
The continued dominance of these curricula in California is not, on its face, a happy finding. It suggests that millions of the state’s most vulnerable students are saddled with past-generation math textbooks that do not reflect the important curriculum innovations and improvements of recent years. But it also means that state influence is real in California, and it’s big: many, many districts today, 10 years after the last adoption, are still waiting for that state signal to select new math curriculum — even though they don’t have to, as state adoption is nonbinding. California districts are ripe, ready, and hungry for state leadership on this front.
State education leaders must leverage this upcoming adoption to vigorously encourage publishers to develop high-quality, innovative math curriculum for California’s public schools — and to relentlessly support its uptake and implementation in districts. In the decade since the last adoption, several big demographic shifts have accelerated in the state’s public schools, including an upsurge of English learners (students who are Hispanic/Latino now make up an outright majority, or 56%, of California public school students) and students experiencing poverty (60% of California public school students receive free and reduced-price meals). These students are not exceptional cases, but the mainstay and the heart of the California public school system. And they need the absolute best that the contemporary education market can deliver regarding math curriculum.
What would that look like? We might see, for example, math curriculum that’s aligned to research-based quality criteria; that intentionally incorporates the best instructional practices for students learning English; that builds systematically underserved students’ executive functioning skills alongside their math skills; and that leverages leading-edge digital technology to engage students and provide just-in-time support to those who are struggling (disclosure: I’m on the boards of both AERDF and Zearn). There’s no shortage of brilliant research and development efforts happening in the world of math curriculum. And state education leaders in California are, right now, in the unique position to bring this innovation to bear in real ways on their students’ math experience.
California must get this adoption right. Because when it comes to curriculum, what happens in California ultimately ripples across the country. The need is acute, nationwide, for more effective teaching and learning in math — for this generation of students to grow up without giving up on it. Better math curriculum will help us get there, and the state of California can help lead the way.
•••
Jeff Livingston is co-founder of the Center for Education Market Dynamics, a nonprofit K-12 market intelligence organization dedicated to improving academic outcomes for underserved students by expanding the adoption and use of high-quality teaching and learning solutions.
The opinions in this commentary are those of the author. If you would like to submit a commentary, please review our guidelines and contact us.
California’s way of funding schools, the Local Control Funding Formula, was not designed to be perfect. That’s because most legislation requires a series of compromises necessary to minimize opposition, maximize support and win the necessary votes for passage.
In LCFF’s case, one of those compromises, the creation of the Local Control Accountability Plan, or LCAP, could eventually doom the reform.
To understand why, it’s important to revisit the initial rationale for LCFF — replacing a complex, inequitable funding model with a simpler model that targeted grants based on student need and concentrated poverty.
The old funding model was managed from Sacramento and included popular grants for the arts and music, English learners, career and technical education and more. Large and/or politically connected districts, nonprofits and statewide groups would lobby sympathetic lawmakers for their own grants. Over time, this model grew increasingly complex, limiting local discretion over spending and stifling innovation. Despite these problems, it had remarkable political resiliency. Lawmakers were incentivized to protect existing grants and got political credit for creating new ones. Very few stakeholders were interested in changing this dynamic and risk losing their favorite grants and programs.
So, it wasn’t enough for the Brown administration to argue that LCFF was better because it was simpler, more equitable and gave districts more control over their money. They had to prove that it would fund many of the same programs as the existing model.
Most education advocacy groups believed that this could be achieved by requiring districts to use the grants generated by high-need students to fund services that addressed their needs. But education groups representing labor and management wanted complete financial flexibility. To avoid this requirement, the education establishment collaborated with a few legal advocacy groups to create the Local Control Accountability Plan (LCAP), arguing that it would accurately document how they were spending money on programs and services.
The last decade has provided strong evidence that this decision was based on flawed assumptions, beginning with the presumption that school districts are the best recipients of funding for high-need students. While district bureaucracies are certainly closer to students than Sacramento policymakers, they aren’t as close as principals and teachers. Unlike schools, district leaders face powerful interest groups that lobby them for spending like higher salaries and districtwide programs. That’s why most targeted grants like federal Title I funding are sent to districts but then quickly distributed to high-poverty schools. Without similar requirements, it’s likely that billons in LCFF dollars that could have funded school-based services were spent on district-level costs such as salaries, benefits, pension obligations and more.
Second, policymakers assumed that districts would accurately document spending on services in the LCAP. But LCAPs were never formally connected to school district budgets, which include ongoing costs like salaries and benefits. In fact, the processes for developing LCAPs and budgets occur separately on different timelines. Almost every analysis of LCAPs has found that their financial and programmatic information cannot be verified and the documents themselves are largely incomprehensible.
Third, they believed that districts would focus on improving student outcomes without clear state-level goals and metrics to guide their decision-making. Instead of big, important goals — like grade-level math achievement — policymakers created a mishmash of state priority areas (many of which can’t be measured) and told districts to include them in their LCAPs. Predictably, most districts paid lip service to these priorities in their LCAPs and then wrote separate strategic plans. At this point, most district leaders probably can’t remember what the state priorities are. If everything is a priority, nothing is.
Finally, and most importantly, they assumed that all of this would improve outcomes for the most vulnerable students. Here, the evidence is limited, especially given the size of the funding increases. Given the persistently low academic performance of most high-poverty districts and the state’s sizable achievement gaps, today’s elected officials can fairly ask whether our state has seen a commensurate return on these massive education investments.
It’s no wonder that over the last several years, elements of the previous school finance regime have roared back. Elected officials who didn’t create LCFF and are suspicious of “local control” have created a whole new set of targeted grants like the governor’s community schools grant. Districts are now subject to far more onerous legalistic requirements for their LCAPs, which are intended to show that they’re using their funding for high-need students.
District leaders have bitterly complained about these shifts. On one level, they are right that the advocates and policymakers focused on the LCAP are just doubling down on a failed strategy. But they haven’t offered any alternative, other than “leave us alone.”
The danger for them is threefold. Increasing levels of scrutiny and regulation; ever more targeted grants that limit their discretion; and, as the years pass, the belief that local control has failed high-need students, requiring more aggressive state and county oversight. A few years from now, they could end up with the worst aspects of the old finance model and the new one.
There is another way.
A decade later, we have a lot of evidence on how to make the formula better. Perhaps a substantial portion of LCFF funding, such as concentration grants (for schools with more than 55% high-needs students) should flow directly to schools based on their poverty level, like Title I funds do. State leaders could establish a few measurable academic and social-emotional priorities that districts would address in strategic plans rather than LCAPs. Instead of a potpourri of grants that limit local discretion or new LCAP compliance requirements, lawmakers could create incentives, such as additional weighted funding for districts willing to create new programs such as language immersion schools. They could even establish financial rewards for districts based on student outcomes.
There are many possibilities, but for the Local Control Funding Formula to survive over the long term, it must always be able to answer a very basic question: What is it doing to improve the education of California’s highest-need students?
The opinions expressed in this commentary represent those of the author. EdSource welcomes commentaries representing diverse points of view. If you would like to submit a commentary, please review our guidelines and contact us.
The dashboard, which the California Department of Education will release on Friday, is the state’s academic accountability and improvement tool designed for parents and educators. It rates the performance of every school, district and charter school, along with any of 13 student groups that attend them, with a color on seven indicators of performance, including math and English language arts test scores, chronic absence rates and graduation rates.
First introduced in 2016-17, the dashboard was suspended because of the pandemic in 2019-20 and 2020-21, and resumed this year with the collection of two consecutive years of data needed to generate color ratings.
Here’s a guide to the dashboard for first-time viewers and for those who need a brush-up course on how to read and interpret the colors and the data behind them.
Why the dashboard?
The Local Control Funding Formula, passed by the Legislature in 2013, required it — or something close to it.
Dissatisfied with the Academic Performance Index, which assigned a three-digit ranking to districts based exclusively on test scores, legislators mandated a broader look at school performance and conditions of learning through multiple measures. There would be no summative ranking; instead, there would be components, such as suspension rates, that would provide evidence for specific actions for improvement. The Legislature required that districts and schools highlight lowest-performing student groups, not just districtwide averages for all students that can shroud inequalities. The intent was to tie actions in a district’s three-year improvement strategy, the Local Control and Accountability Plan, or LCAP, to results in the dashboard.
The dashboard also marks a shift away from the mindset of the federal No Child Left Behind Act. Instead of punishment for low performance, the funding formula promises guidance and assistance to districts with low-performing student groups. As State Board of Education President Michael Kirst and then-state Superintendent of Public Instruction Tom Torlakson wrote in a 2017 commentary for EdSource, “We have a rare opportunity to turn data into direct action. The state is now able to identify specific challenges school districts are facing and is committed to providing assistance rather than the sanctions of the past.”
Which are the 13 student groups?
African American, American Indian, Asian, English learners, Filipino, foster youth, Hispanic, homeless, two or more races, Pacific Islander, socioeconomically disadvantaged, students with disabilities, and white.
What are the performance indicators?
Chronic absenteeism measures students from kindergarten through eighth grade who were absent at least 10% of school days during the academic year, or at least 18 days.
English learner progress indicator, which is new this year, measures progress toward English language proficiency by measuring English language learners’ results on the English Language Proficiency Assessments for California from the current to the previous year.
Suspension rate measures the percentage of students who were suspended for a total of one full day anytime during the school year (multiple suspensions of the same student are not factored in).
Graduation rate measures the percentage of students receiving a high school diploma within four or five years or who complete graduation requirements at an alternative school.
College/career indicator measures the percentage of high school graduates who are prepared for college or a career. It looks at the number of students who completed or fulfilled one or some of the following metrics:
Advanced Placement exams.
A-G course requirements for a state university.
A career technical education pathway.
College credit through dual enrollment.
An International Baccalaureate exam.
Leadership/military science program.
A pre-apprenticeship.
A state and federal jobs program.
The State Seal of Biliteracy.
Work-based learning experiences.
Performance rates on the 11th-grade Smarter Balanced tests in English language arts and math.
Schools or districts where 55% of students meet the criteria are rated high performance; at 70%, they are rated very high.
English language artsindicator measures the Smarter Balanced test results and the California Alternative Assessments for grades three to eight and grade 11. It is determined by students’ average distance in points below or above the score that indicates a student performs at standard for the grade. A school’s or district’s participation rate counts, too.
Math indicator measures the Smarter Balanced test results and the California Alternative Assessments for grades three to eight and grade 11. It is determined by students’ average distance in points below or above the score that indicates a student performs at standard for the grade. A school’s or district’s participation rate counts, too.
Why are there colors?
Seeking to create a tool that encourages improvement, the state board concluded that the most constructive measure would include both the results for the current year and an indication of whether those scores increased or decreased from the year before. A color reflects the intersection between both variables: the current status and one-year change; both factors are given equal weight. Schools with previously very low math scores that show significant improvement the next year, for example, are rewarded by moving up from red to yellow or green. Schools that suspended lots of kids this year compared with the year before will see the color change from green to yellow or orange — a signal that it’s time to pay attention and ask why.
How are colors determined?
Source: California School Dashboard
A look at a five-by-five grid provides the answer. For every indicator, the results for the current year are divided into five performance categories, listed from top to bottom: very high, high, medium, low and very low. Change in performance from the previous year is also divided into five categories, listed from left to right: declined significantly, declined, maintained, increased, increased significantly. As in bingo, mark your X on the intersection of vertical numbers on the left with the horizontal numbers at the top.
To illustrate, consider the graduation rate of Santa Ana Unified. Its 89.7% graduation rate in 2023 is 3.3 percentage points higher than the state average, but the decline of 2.8 percentage points from 2022 pushed it from what might have been green or yellow to orange.
You have to look at the underlying data to understand a color, especially yellow. It could indicate good news or bad, depending on the change from the year before. It doesn’t mean satisfactory.
Have the cut scores defining the performance levels and change been reset to reflect learning setbacks resulting from Covid?
No. The same criteria that determined a red or blue in 2017 applies to 2023. However, because of the suspension of the dashboard during the pandemic, the 2023 dashboard will reset the rating process. Test scores were higher and chronic absences were a lot lower pre-pandemic than in 2023. Color ratings in 2023 understate some of those disparities by comparing 2023 results with those of 2022, the first post-pandemic year. An EdSource analysis, found in 2019, 82 districts scored very high in math and 47 districts scored very low. In 2023, 63 districts scored very high, and 137 scored very low.
Why is there no color this year for the college and career indicator?
The results of the Smarter Balanced tests in 11th grade in math and English are a metric used to determine that indicator. There need to be two years of test results to measure change on the dashboard. No test was given in spring 2021, so there was no score for the class of 2022 and therefore no way to compare it with the 11th grade results for the class of 2023. Next year, there will be a color for the 2024 dashboard, with the publication of 11th grade scores in 2023 for the class of 2024.
What is the equity report?
The equity report is what you turn to by clicking on any performance indicator on the home page for any district or school. It takes you to a color breakdown of all 13 student groups with enough students to be measured. Click further, and it will show the underlying data — scores and the change from the year before — for each student group. Comparing the groups reveals disparities and rates of improvement, evidence for setting goals in the Local Control Accountability Plan to close achievement gaps.
How does the dashboard define what low-performing districts and charter schools qualify for extra help, called differentiated assistance?
It’s complicated.
In writing the funding formula, the Legislature said that districts, county offices of education and charter schools should be held accountable for performance in several priority areas. The state’s seven statewide performance indicators fall within them: school climate (suspension rates); pupil engagement (graduation rate and chronic absences) and pupil achievement (the English Learner Progress Indicator and the math and English language arts tests).
Districts and charter schools are eligible for differentiated assistance when one or more student groups get a red rating in two or more priority areas. They will receive help from a county office of education; poor-performing county offices, which also run schools, will get help from the state.
In 2023, 466 school districts and county offices of education will be eligible for differentiated assistance; they represent 47% of the total. That’s 151 fewer than in 2022; the biggest factor was a decline in the rate of chronic absenteeism. While still at historic levels, the 5.7 percentage point statewide drop from 30% pushed the state and most districts into yellow, from what would have been red.
The Legislature also established priority areas for which there are no statewide measures: Basic school conditions, such as appropriately assigned credentialed teachers and clean and functional school facilities; implementation of state academic standards; parent and family engagement, and access to a broad course of study. Districts have local options on how to verify annually that the standards have been met. A failure to meet the standards in a local priority area for two consecutive years can also qualify a district for differentiated assistance.
This year, for the first time, districts must address in their Local Control Accountability Plans how they will address student groups performing in the red on any indicator in any school. This new mandate is intended to ensure funding from the Local Control Funding Formula is directed to the students with the most needs.
On Dec. 14, 2023, the California Department of Education updated the official California School Dashboard with the latest data for schools and districts. You can also view results for 2019, 2018, and 2017.* The dashboard shows achievement and progress, or lack of it, on multiple measures in color codes tied to performance metrics by the state. Enter a search term in the box to search by school, city, district or county. If a school or district does not appear, it means that no data is available. Detailed test scores are available on cells with an “i” (click to see more). For a full explanation, see the notes below the chart.
* The 2022 California School Dashboard only displays that year of results, without comparisons to the previous year, due to disruptions caused by the pandemic.
School Name, City and County
Chronic Absenteeism Rate
Suspension Rates
English Lang. Arts Performance
Math Performance
High School Graduation Rate
English Learners
Link
School Name, City and County
Chronic Absenteeism Rate
Suspension Rates
English Lang. Arts Performance
Math Performance
High School Graduation Rate
English Learners
Link
Notes to Database
Color Codes and Ratings: The dashboard includes five color-coded performance levels, based on a combination of current performance level and change over the previous year. The color spectrum ranges from red to orange to yellow to green to blue, with red signifying the lowest performance level and blue the highest.
More information about how the performance levels were calculated is available at the California Department of Education’s website here.
Column Headings:
Chronic Absenteeism: Proportion of students who miss 10 percent or more expected days of attendance in a school year. (For a student enrolled for 180 days, this would be 18 or more days.) Note: This indicator is not reported for high schools.
Suspension Rates: Based on a combination of current suspension rates and changes in those rates over time.
English Language Arts Performance: Student performance in Grades 3-8 and 11 on the English Language Arts Smarter Balanced tests administered in the current year, combined with whether scores improved, declined or stayed the same compared to the previous year.
Math Performance: Student performance in Grades 3-8 and 11 on the math Smarter Balanced tests in the current year combined with whether scores improved, declined or stayed the same compared to the previous year.
High School Graduation Rate: Combined four-year and five-year graduation rates, including current graduation rate along with whether rates have changed over the previous year.
For more information about how the performance levels were calculated, go to the California Department of Education’s website here.
For the full dashboard for each school or district, go here.
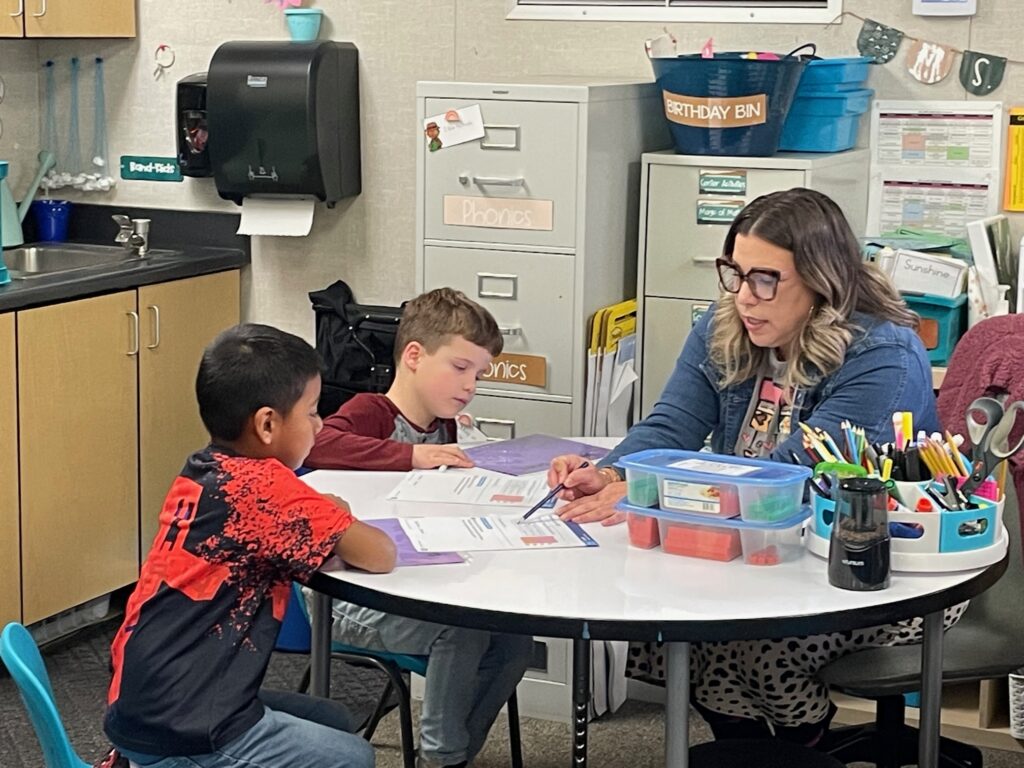
Students work together during an after-school tutoring club.
Credit: Allison Shelley for American Education
For the first time since 2019, the California Department of Education has fully updated the California School Dashboard that tracks the annual progress of K-12 students on factors such as standardized test scores, chronic absenteeism, suspensions and graduation rates.
Since its rollout in 2017, the dashboard aims to show the progress of students at the state, district and school level using a color-coded system. It breaks this information down by 13 student subgroups, such as English language learners, disabled students and race and ethnicity. Friday’s update provides a snapshot of the progress made between the 2021-22 and 2022-23 academic years, representing the aftermath of the pandemic’s peak.
Red signals the poorest performance, followed by orange, yellow and green, while blue signals the best performance. State officials say that anything below green indicates the need for attention and improvement. Amidst the pandemic, the state stopped releasing this information in 2020.
The dashboard relies on some data, such as test scores and chronic absences, that was released in October. Other data — such as graduation rates and how many students met the entrance requirements to California universities, one measure of career and college readiness — were released Friday.
For the first time, this year’s dashboard adds a color-coded score to measure how many English learners are making progress toward proficiency on the English Language Proficiency Assessments of California (ELPAC).
On chronic absenteeism and English learner progress, the state’s status was yellow, a midway point between blue and red. The state’s status was orange — the second-worst status — for its suspension rate, graduation rate and performance on standardized tests for mathematics and English language arts.
State officials said the results demonstrate California schools are making progress in the wake of the pandemic, which witnessed sharp declines in standardized test scores and a surge in chronic absenteeism.
“Recovery from the pandemic has been a long process all across the country,” said California State Board of Education President Linda Darling-Hammond, in a statement. “While we have a long way to go, these results show that California is making strides, especially in enabling students to get to school and graduate ready for college and careers.”
The rate of students graduating from high school who met the minimum course requirements to attend a CSU or UC reached an all-time high: 45.15%. That number has continued to steadily increase throughout the pandemic, up from 41.24% in 2016-17.
The statewide four-year graduation rate is 86.2%, a decline from last year’s all-time high of 87%. State officials attribute 2021-22’s peak to a loosening of state graduation requirements and grading policies at the height of the pandemic. Officials say this most recent dip is due to a return to pre-pandemic policies.
The dashboard’s color coding system takes into account both whether a metric is high or low, and also whether that metric has declined, maintained or improved within the past year.
For instance, the orange ratings for math and English language arts test scores reflect the fact that after huge dips from pre-pandemic scores, there was little change from the previous year’s scores. Math scores edged up 2.6 points and English scores dipped 1.4 points.
The state’s chronic absentee rate in 2022-23 was 24.3%. That means nearly a quarter of students missed 10 or more days of school that year. That is a 5.7 point dip from the previous year’s all-time high of 30%. However, it is still a historically poor rate, roughly double the 2018-19 rate of 12.1%. Chronic absentee rates were above 20%, the worst category, in 62% of districts.
Data shows that chronic absenteeism surged nationwide in the wake of the pandemic, and it hit nearly every school district. Experts have said that sick days from Covid and quarantining can account for part but not all of the rapidly increasing absentee rates. The CDE trumpeted the state’s declining chronic absenteeism rate.
“This is encouraging news, and our work is not complete,” said Superintendent Tony Thurmond, in a statement. “We have made an unprecedented investment in services that address the needs of the whole child. We can see that those efforts are paying off, but this is only the beginning.”
But some questioned whether the dashboard’s metrics provide a meaningful portrait of progress in the state.
The dashboard was created before the pandemic when there were a different set of assumptions about what progress would look like in schools, said Heather Hough, executive director of PACE, a Stanford-based education research organization. Metrics didn’t tend to surge or nosedive year to year before the pandemic. Improvement on metrics like chronic absenteeism or standardized test scores are worth noting, she said, but the dashboard’s focus on one year of change can be misleading.
“That can mask the concern that we should still be having: A lot of students are far behind where they have been, and large portions of students are not attending school,” Hough said.
The color coding system has implications for which schools are eligible for additional assistance. Skyrocketing chronic absenteeism rates were largely responsible for a surge in schools that were eligible for differentiated assistance. In 2019, 333 school districts were eligible but by 2022 that number shot up to 617. This year 466 school districts were eligible.
Advocates for English learners also worry that the way that the dashboard presents metrics is downplaying an urgent issue in education.
The dashboard shows that about half (48.7%) of English learners in the state advanced at least one level or remained at the top level of English language proficiency, based on their scores on the ELPAC, a test English learners are required to take every year until they reach proficiency. This is about the same number who progressed as last year.
CDE considers this to be a yellow score — a medium number of students making progress toward English proficiency, and not much change in how many did so. In order to reach green, the number of students making progress toward English proficiency would have to increase by 2 percentage points.
Martha Hernandez, executive director of Californians Together, an organization that advocates for English learners statewide, said fewer than 50% of English learners making progress each year should be considered very low, or red, rather than medium, or yellow.
“That seems to be a passing score, so to speak, and really doesn’t create the sense of urgency to really focus on the needs of English learners,” Hernandez said. “We really think the state has low expectations for districts having students make progress.”
Hernandez said if students advance one level each year, they would achieve proficiency in six years, which is a reasonable expectation based on research. When students take longer than six years to achieve proficiency, they are considered long-term English learners and can struggle in middle and high school.
Californians Together has advocated for the state to change indicators for English learner progress. The group believes that districts or schools should receive a high, or green, level of progress if at least 70% of English learners progress at least one level in one year. Currently, the state considers 55% of English learners progressing at least one level to be high.
About a third of English learners (32.7%) in the state remained at one of the same lower levels of English proficiency as the year before on the test. Almost one fifth (18.6%) decreased one level in English proficiency.
Districts achieved varied scores on English learner progress – 66 were red, 215 orange, 152 yellow, 192 green, and 43 blue.
In addition, Californians Together criticized the fact that the dashboard rates English learners’ scores on English language arts and math tests together with the scores of students who have achieved proficiency in English in the last four years.
“It’s a very, very weak picture of the needs of English learners,” said Shelly Spiegel-Coleman, strategic advisor for Californians Together.
Melissa Valenzuela-Stookey, director of P-16 research at Ed Trust-West, said that the nonprofit that advocates for justice in education, is planning to dig into the data to get insight into what is happening for the state’s most marginalized students, but the initial data is concerning.
“This data shows that the status quo for students of color is unacceptable, and we’re making alarmingly slow progress — but it also points to schools and districts that are proving that we can do better,” Valenzuela-Stookey said.
To create an education system that has stable funds for mental health, California educators and leaders are turning to the health system and launching a statewide behavioral health initiative to fill funding gaps in fluctuating, sometimes unpredictable school budgets.
“The health systems and the education systems are not bound together successfully enough to make sure we engage in both prevention and treatment,” said David Gordon, a commissioner at the Mental Health Services Oversight and Accountability Commission. “That’s particularly true for the most underserved communities.”
Funding for mental health in California public schools typically has come from general education budgets, a reason funds have never been stable. As the need for more mental health services and specialists skyrockets, administrators and experts are turning to the health system to better serve needs that existing education budgets just can’t cover.
Schools bridge some gaps by placing nurses, social workers, school counselors and psychologists on campuses, but there’s never enough money to fully meet student mental health needs. Without a built-in, statewide system to fund mental health in schools, districts are left to figure it out themselves.
“We’re so used to trying to provide external funding to fund us to some sort of equitable level for every student,” said Loretta Whitson, executive director of the California Association of School Counselors. “It’s never been the general fund will cover us — it’s just sort of baked into the cake.”
It’s been that way since at least the late 1980s, when Whitson began her education career, she said.
The Local Control Funding Formula, legislation that changed the way education was funded in California, created more funds for mental health and “a more holistic view and review of schools,” Whitson said. “But if there’s not enough money to go around, then school district administrators need to make very hard decisions.”
If districts have to rely on general fund money for mental health providers, it creates competition with funding for teachers and education programs, Whitson said. If budgets had more funds specifically for mental health, it would mean more money for education.
If we piecemeal it like it’s been, then we’re always trying to find money through categorical programs or grant funding.
Loretta Whitson, executive director of the California Association of School Counselors
California doesn’t mandate districts to provide school counselors, social workers, nurses or psychologists, but it is encouraged. Some experts say mandates could ensure there would be mental health specialists at every school. But that goes against the idea of local control, Whitson said, which allows districts to make decisions based on their community’s needs and resources.
Grants for mental health have helped, but it’s not sustainable, Gordon said. School districts will receive grants for a few years or even less, and when those dollars run out, the services or mental health specialists do too if districts don’t have money to keep them going.
Similarly, districts turned to pandemic relief dollars to boost staffing for school counselors, social workers, psychologists and nurses, but those funds expired in September.
Nonprofits and community organizations have stepped in to help fill needs at lower costs, put therapists on school campuses, and taken over doing burdensome paperwork. But if the services aren’t free to school districts, then most money for mental health has to come out of the education budget.
Blending two systems
Gordon credits Gov. Gavin Newsom’s Children Youth and Behavioral Health Initiative for beginning to merge the health and education system. The goal for two major systems to come together is reachable, Gordon said, “but it will take a lot of coordination and collaboration.”
A key component of the behavioral health initiative is to support partnerships between Medi-Cal managed care plans and schools to increase access for children receiving Medi-Cal — nearly 5.7 million kids in 2022. Another goal is to increase access to early interventions and preventative mental and behavioral health care.
The behavioral health initiative was part of the Budget Act of 2021 and the governor’s Master Plan for Kids’ Mental Health. The California Department of Health Care Services will invest $4.7 billion over multiple years in youth behavioral services.
According to the master plan, more than 240,000 children cope with depression, and 66% don’t receive treatment. Suicide rates among 10-18-year-olds increased by 20% in 2019-2020.
Efforts to implement the behavioral health initiative started in January 2022. So far, hundreds of millions of dollars in funding have been disbursed to dozens of organizations for training and retention of providers, loan repayments and scholarships to increase providers in underserved areas.
But some of the funding is distributed as grants and won’t last long, Whitson said.
“I think it’s important to consider: How do we sustain this? A lot of programs come in as temporary programs, so seed money,” Whitson said. “We look at sustainable money as Medi-Cal a lot of times.”
The amount of money school districts can bill to Medi-Cal recently increased, thanks to new legislation. The California Education Code was updated in January after AB-2058 passed, allowing districts to bill Medi-Cal for mental health services provided by school counselors.
A 2018 statewide count of school counselors tallied about 11,000, Whitson said. She estimates there are about 14,000 now.
“School counselors are one of the biggest billing forces in the state. It should be bringing in quite a bit of money,” Whitson said. “It could be used to lower the caseloads on all levels — social workers, psychologists, school counselors.”
However, the process for school districts to bill Medi-Cal can be long and cumbersome.
Sometimes districts won’t get a full refund, and it could take a few years before the money is returned, said Marlon Morgan, founder and CEO of Wellness Together, a nonprofit that brings mental health providers to school campuses in California and New York.
“Schools are pretty reticent to use that billing option because they could end up spending $1 million but only get $500,000 back,” Morgan said. “If you’re on a school board and looking at ways to stabilize your budget and to know what to expect, that’s a huge wild card, and frankly one that doesn’t get used very often.”
In Sacramento County, schools are partnering with the Sacramento County Health Department to have one mental health provider at every school, said Gordon, who is also the superintendent of the Sacramento County Office of Education. The partnership works well because the county health departments already manage Medi-Cal and Medicaid plans — which insure more than 60% of people in the county, he added.
The purpose isn’t only to provide direct services at schools, but to have someone from the health system stationed at schools interacting with staff, students, and families every day, Gordon said. The goal is to have “centers of wellness and prevention, rather than a center of let’s go out and seek treatment for a problem that should’ve been caught many years ago,” he said.
Some organizations are combining billing insurance and grant funding to bring providers to schools. Campus Clinic, which aims to remove barriers to health care access by putting providers at schools, has brought mental health providers and other physicians to 14 districts and more than 600 schools in California, said Thomas Shaffer, the organization’s founder and president.
Most districts haven’t had to foot the bill. Campus Clinic started paying for all the costs, Shaffer said, and was able to sustain its offerings through billing insurance, including Medi-Cal, and applying for grants. One burden Campus Clinic and other similar organizations lift from districts is handling the paperwork and billing.
“We aim to complete, not compete, with existing resources,” Shaffer said.
Still, the need for mental health services and providers is too great to catch up with demand. Campus Clinic is contracted with 28 more districts that are still in the planning stages, Shaffer said.
Campus Clinic also offers universal health screenings that allow schools to quickly identify which students are showing signs of anxiety, depression and risk of self-harm, Shaffer said. Schools can see responses through a dashboard that includes real-time notifications for students who are at risk of self-harm. Campus Clinic has teams that start reaching out to families to offer services.
But it doesn’t come without challenges. Building trusting relationships with families so they feel comfortable accepting services can be an uphill battle.
‘The cultural and trust piece’
Officials at Feaster Charter School in Chula Vista saw immediate results after Campus Clinic gave universal mental health screenings to students in grades six through eight in May.
Out of the 350 students, roughly 40% were identified as having some level of anxiety and depression, said Karen Haro-Esparza, community school coordinator.
Teams at Campus Clinic started contacting families right away, Haro-Esparza said. Although it’s a huge help, it also created challenges — “the cultural and trust piece.”
“Because they are not a regular part of our staff, when Campus Clinic communicates with families, they have a lot of questions,” Haro-Esparza said. “Our challenge has been, ‘How do we educate families further to destigmatize and normalize the partnerships?’”
The stigma around mental health — especially among people of color and different cultures — is one reason families or guardians don’t seek or access resources for students. Something most mental health experts working in education can agree on is the importance of maintaining trust among schools, providers and families.
“It’s not just putting money out to buy services. It’s working to try to put the systems together so that they’re relating and families will come to know and trust the medical system even though they aren’t located in their community.”
David Gordon
Campus Clinic providers aim to become part of the school community, Shaffer said. One strategy Campus Clinic providers use is to rotate through different classrooms to speak with students about health and wellness for 15 minutes to become more familiar and create connections.
Wellness Together is investing in interns to diversify the workforce and build trusting relationships between communities and mental health providers, Morgan said. Before mental health professionals receive their licenses, they need to complete hundreds of hours that typically are unpaid — some programs won’t even allow future providers to have paid internships.
Morgan, who started his career as a school counselor, said he’s seen dozens of people never get their licenses because they can’t afford to work for free. It contributes to the lack of diversity in the behavioral health workforce, he said. Now, the nonprofit has more than 30 partnerships with universities in California to ensure interns are paid liveable wages and receive benefits.
Wellness Together pays interns working toward their licenses to be social workers, clinical and mental health counselors, licensed marriage and family therapists, and a pupil personnel services credential.
“The biggest challenge is finding staff and making sure the staff reflects the communities they’re serving,” Morgan said. “By paying interns and paying associates, we now have an option and an opportunity to really hire the best person for the job and often hire a person who is local and from the community.”
As a parent or caregiver, imagine having a social worker knock on your door to tell you that someone has reported their suspicion that you are not taking proper care of a child in your care. As mandated reporters, our calls to child protective services about “reasonable suspicion” of child abuse and neglect are informed by our training and experience. Mandated reporting is about ensuring child safety. Unfortunately, the ambiguous and emotionally charged nature of this topic, coupled with tremendous fear of individual and organizational liability, inadequate and inconsistent training, and lack of support for mandated reporters often leave us to make consequential decisions based on limited information and in isolation. We must know that the decision to report a family to a county child welfare agency is not without consequences, and I firmly believe it sometimes does more harm than good. When we prioritize the liability of our organizations over the well-being of families and children, no one is well-served.
Each year, as school and district employees, we dutifully complete our annually required mandated reporter training. In my experience, the main takeaway of these training sessions is that we must report any potential concerns, no questions asked (don’t investigate!) or risk personal and professional consequences, including fines and loss of credentials. This training approach disempowers mandated reporters and has, unfortunately, resulted in educators being the most likely to report concerns that are ultimately determined to not be abuse or neglect once investigated by child protective services.
Besides law enforcement, educators are the second-largest group making referrals to child protective agencies. According to the California Child Welfare Indicators Project data presented at the Knowledge is Power Summit, educators made 20% of the referrals to child protection in 2019, impacting about 23,308 children. However, only 10% of those referrals were substantiated following an investigation. In Los Angeles County in 2022, the substantiation rate was 6% for allegations made by mandated reporters in education.
California law does not require standardized mandated reporter training. The system relies on professionals to report suspected cases of child abuse or neglect. It prioritizes organizational risk over the best interests of children and their families. The lack of concrete guidance leaves mandated reporters feeling ill-equipped to make sound reporting decisions. As humans, our biases, both implicit and explicit, affect our judgment. A recent survey of mandated reporters found that 43% of respondents made reports when they did not suspect maltreatment. Of these, 17% filed reports to connect families to services because they didn’t know how to help those families access services. As a former child abuse investigator, I’ve seen how this over-reporting can cause unnecessary stress, trauma, increased isolation and disruption for children and families, particularly those in underserved communities, and specifically communities of color.
To shift the focus from enforcement to support, Assembly Bill 2085 was signed by the governor in 2022. This law aims to eliminate inaccurate reports of general neglect by narrowing the legal definition of general neglect to apply only when there is substantial risk of serious injury or illness. It clarifies that poverty does not equal neglect.
Los Angeles County is also joining the broader effort to improve training and systems to support families who have needs that should be met outside of the child protection system. In alignment with the “LA County Mandated Supporting Initiative”, multiple agencies and key partners are working together to transform the mandated reporting process in L.A. County to better support historically underserved children, youth and families. They recently launched training aimed at enhancing child safety and reducing harm and systemic inequities driven by unnecessary and inappropriate reports of suspected child neglect to the Department of Children and Family Services. More focused training will be offered in 2024, including sector and discipline-specific content to address distinct mandated reporter groups.
For us as educators, this is a call to action. A call to reconsider when child protection is needed versus when a family may need support — and to meet this moment, we must reexamine our approach, our training and our narratives.
•••
Alicia Garoupa is chief of well-being and support services for the Los Angeles County Office of Education.
The opinions expressed in this commentary represent those of the author. EdSource welcomes commentaries representing diverse points of view. If you would like to submit a commentary, please review our guidelines and contact us.
And if you thought 2023 was a downer, just wait for …
“Hold on,” ever-wise Ms. Fensters interrupted. “Why would anyone read a New Year predictions column if you make them feel like jumping back in bed and pulling the covers over their head for the next 362 days?”
She’s right.
Let’s celebrate the dawn of the new year before wading into the swamp that will be 2024.
How’D you Do betting on 2023?
My predictions for 2023 were like my singing: off-key but not terrible.
I said third-grade English language test scores would plunge. They were stagnant.
I predicted strikes in a half-dozen districts: Teachers struck in LA, Oakland and Rohnert Park Cotati Unified, and settled within hours of hitting picket lines in San Francisco and Fresno.
I said that members of the new California College Corps, which pays college students to do community work, would become a legion of elementary school reading tutors. It was wise advice couched as a prediction, which Gov. Newsom ignored. (It’s still a good idea.)
If you kept your own scorecard, go here to compare your results. If not, grab a pencil and paper and bet your fensters for 2024. They’re redeemable with S&H Green Stamps at your local Mervyn’s.
Arts on the rise
School attendance will soar, and students will master the math of music in triads and quarter tones in districts like Manteca Unified in San Joaquin County, which will get about $3.8 million in new funding from Proposition 28. That’s the $1 billion ballot initiative, Arts and Music in Schools — Funding Guarantee and Accountability Act, that voters passed in 2022. Manteca, known for its quality bands and providing instruments to all who need them, will be better positioned than many districts. Most others will struggle to fill arts, dance and music jobs, at least initially.
Chances that arts will flourish in districts like 24,000-student Manteca Unified:
A note of caution: Under the terms of the new law, districts must use Proposition 28 to expand, not replace, existing arts funding. Eagle-eyed arts protectors will be watching how administrators move the Proposition 28 pea in the budget shells.
Chances that Create CA or other advocates will file a complaint with the California Department of Education against a district suspected of using Proposition 28 money to supplant, not supplement, its arts budget:
Now, brace yourselves for the dark side of the moon.
The state budget
Within days, Gov. Gavin Newsom will release his first pass at the 2024-25 budget, but Legislative Analyst Gabriel Petek offered his gloomy forecast last month: a three-year projected state general fund deficit of $68 billion; between $16 billion and $18 billion would be in Proposition 98, the formula determining how much funding goes to TK-12 and community colleges.
Draining the state’s rainy-day fund for education and picking away at budgeted but unspent funding, perhaps for buying electric school buses and creating hundreds more community schools, could halve the problem. School lobbies will demand that legislators hold districts and community schools harmless and cut elsewhere in the state budget — to which UC President Michael Drake will reply, “You lookin’ at me?”
A likely compromise: Pay what the Legislature appropriated for 2023-24 but dust off a Great Recession strategy. Do what your boss does when he can’t make payroll but doesn’t want to lay you off: issue you IOUs. In edu-speak, they’re “deferrals” — and would involve pushing back state payments to districts scheduled for May and June 2024 into July, August or later in the next fiscal year. It’s not a painless tactic: Districts without cash on hand will have to borrow. And the money will have to be paid back, potentially eating into future levels of Proposition 98 funding.
Chances that the Legislature will impose billions in deferrals in the 2024-25 budget:
It gets worse
Schooldistricts have known the reckoning was coming. Called “the fiscal cliff,” it combines the expiration of billions in federal Covid relief, declining enrollment in nearly three-quarters of districts, and a leveling off from record state funding. What they hadn’t anticipated is a projected 1% cost of living increase, based on a federal formula that this year will disadvantage California; this compares with 8% in 2022-23 and 13% the year before that.
For districts like San Francisco Unified that negotiated sizable raises and over-hired with one-time funding, budget pressures will be intense to close underenrolled schools — never a popular decision — and lay off staff. Dozens of districts will suddenly find themselves on the state’s financial watch list.
Chances that by the March 15 notification deadline, 15,000 teachers and 10,000 classified employees, many hired with expiring federal funding, will get pink slips (the final number of layoffs will be less):
Chances that the number of districts with a financial rating of negative or qualified by FCMAT, the state Fiscal Crisis and Management Assistance Team, will at least quintuple from a low of 13 districts in April 2023 to more than 65 in April 2024:
Chances that San Francisco, Oakland and Los Angeles will close underenrolled schools, notwithstanding common sense:
PODCAST
What’s in store for California education in 2024?
JANUARY 11, 2023
State facilities bond
The state has run out of money to subsidize the costs of new school construction and renovations; billions of dollars’ worth of districts’ projects are in the pipeline. Covid, last year’s floods and sweltering temperatures — signals of climate change — exposed the need for retrofits to meet 21st-century conditions. But the first-ever defeat of the last state bond proposal, in March 2020, proved school advocates shouldn’t take voters for granted. Was the $15 billion price tag too big? Should funding for CSU and UC be included? There will be lots of polling to answer those questions.
Chances that a school construction bond will be on the ballot in November:
Chances that it will pass:
Toil and trouble
The odds are five fensters that the fight over library books and the backlash against transgender protections in reddish districts will embroil voters statewide in 2024. Suppose school choice and religious conservatives succeed in passing the initiatives they’re aiming to place on the ballot. In that case, progressive California voters will awake with a fright on Nov. 6, wondering if they’re living in Kansas.
Proposed for November vote
Private school choice: Pushed by the coalition Californians for School Choice, the initiative would create voucher-like education savings accounts equal to the average Proposition 98 per student funding, initially $14,000, that families could use to send their kids to private schools, including religious schools currently prohibited by the state constitution from receiving public money. Home-schools with 10 or more students could form a private school for funding, too. State oversight would be minimal. Subsidies for families already paying for private schools would cost the state $6.3 billion to $10 billion per year by diverting money from Proposition 98, the Legislative Analyst estimates.
In 2002, voters rejected a voucher initiative 70% to 30%. Capitalizing on unhappiness with schooling during Covid-19, this initiative will do better, but defenders of public schools, starting with the CTA, will hugely outspend the proponents.
Because the initiative would amend the state constitution, organizers would need to collect 874,641 signatures.
Chances that the initiative will make the ballot:
Chances, if it does make the ballot, that it will lose while getting 40% of the vote:
School Transparency and Partnership Actaka Outing Trans Kids Act.Unable to get traction in the Legislature, the parent activist group Protect Kids California, co-founded by Roseville City Elementary School District board member Jonathan Zachreson, is canvassing for the 546,651 signatures required for the initiative. It would require schools to notify parents within three days if a student asks to be treated as a gender other than listed in official school records. This would include requesting a name change, a different gender pronoun, participation in an activity using a different gender, or changing clothes identifying as a different gender.
Chances the initiative will collect enough signatures to qualify:
Chances the initiative will be approved:
Protect Girls’ Sports and Spaces Act, also collecting 546,651 signatures, is the second of three related initiatives proposed by Protect Kids California. It would repeal the 2013 state law allowing students to participate in school activities and use school facilities consistent with their gender identity. Biologically born male students in grades seven and higher in public schools and colleges identifying as females would be banned from participating in female sports or using bathrooms and locker rooms assigned to females based on their birth gender.
Chances the initiative will collect enough signatures to qualify:
Chances the initiative will be approved:
Protect Children from Reproductive Harm Act, aka Parental Control Unless We Say So Act. California, which has been a sanctuary for families seeking medical care for transgender youths, will join the nearly two dozen states that ban transgender care if this initiative, the third transgender-restriction initiative pushed by Protect Kids California, passes. It would ban health care providers from giving medical care to patients under 18 seeking to change their gender identity. It would prohibit that treatment even if parents consent or doctors recommend it for the minor’s mental or physical well-being.
Chances the initiative will collect enough signatures to qualify:
Chances the initiative will be approved:
Eyes of the storm
Recall elections of school board members in two districts will serve as a gauge of whether activist conservative majorities represent a fringe minority or the will of the majority.
Longtime Orange Unified board President Rick Ledesma and newly elected board member Madison Miner angered opponents by voting with two other conservatives to fire a respected superintendent on Jan. 5 during winter break without citing a cause. In October, the board became the sixth in the state to adopt a transgender notification policy.
Chances that Orange Unified voters will oust Ledesma in the March 5 vote:
A three-member majority in Temecula Valley Unified adopted a similar playbook this year, including firing its superintendent. A political action committee of voters appears to have turned in more than enough signatures to recall board President Joseph Komrosky, their primary target, but not enough to oust Jennifer Wiersma. In July, the board stirred the ire of Gov. Gavin Newsom by rejecting a sixth-grade textbook that included a passage about gay activist Harvey Milk, whom Komrosky characterized as a pedophile. The third conservative, Danny Gonzalez, resigned in December to move out of state. In his last board meeting, he lashed out at opponents, including board member Stephen Schwartz, whom he accused of showing “vile contempt for Christians.” Schwartz is Jewish.
The outcome of the recall would be a measure of the power of the Evangelical 412 Church Temecula Valley and its pastor, Tim Thompson, who has been outspoken in defense of the board majority.
Chances that Temecula Valley voters will oust Komrosky later this year:
Etc.
California Personal Finance Education Act, aka “Why You Should Tear Up That 20th Credit Card Offer Act.” Pushed by Palo Alto entrepreneur Tim Ranzetta, who’s been proselytizing for teaching students personal finance through a nonprofit he co-founded, the initiative would require a semester of personal finance as a graduation requirement, starting with the graduating class of 2030. California would join about two dozen states with or phasing in the requirement.
Chances that it will make the ballot in November:
Chances that voters will approve it, despite some misgivings about mandating yet another graduation requirement:
Early literacy
In late December, a new alliance of advocates calling for the state to take a clearer and more resolute policy on early literacy published an early literacy policy brief with the expectation that it would lead to legislation in 2024. The California Early Literacy Coalition includes Decoding Dyslexia CA, 21st Century Alliance, Families in Schools, California Reading Coalition and the rejuvenated nonprofit EdVoice.
Among its positions, the coalition calls for:
Directing the California Department of Education to create a list of approved professional development courses grounded in the science of reading that districts and educators can select.
Requiring all teachers and reading coaches in elementary schools to complete training from the approved course list.
Providing help to schools and districts as they adopt the science of reading-aligned instructional materials.
The state, under Newsom, supports the science of reading approach to reading and, in piecemeal fashion, is partially funding some of what the coalition advocates. The difference is that a comprehensive policy would mandate what the administration has only encouraged.
Chances that a prominent legislator will sponsor the bill and that it will be one of the most discussed non-budget bills of the session:
Passage likely will take more than a year of effort and perhaps await the election of a new governor and state superintendent of public instruction willing to challenge the reflexive defense of local control on this issue.
Chances that comprehensive legislation will be signed into law in 2024:
Extra challenges for charter schools
Along with challenges facing all school districts, the state’s 1,300 charter schools will face added pressures. Many are in the Bay Area and Los Angeles, where enrollment declines for districts and charter schools are largest. Tensions between them could escalate if funding-desperate districts deny charters fair access to school facilities, as the school board majority of Los Angeles Unified voted to do last year.
A pre-pandemic reform law allowing school districts to factor in financial impact when deciding to grant a new charter school will thwart growth and expansion, and the 2024-25 resumption of the charter renewal process, using problematic post-pandemic performance measures, could compound charters’ troubles. The result: Some financially fragile charters will close; the weakest performers will be shut down.
Chances that the number of charter schools in California operating in fall 2024 will drop by at least 30 schools.
One area in which legislators, charters and districts should agree is new accountability requirements for non-classroom-based charter schools that offer virtual schools or hybrid models combining home-schooling and classrooms. They’ve become more popular with families and been more prone to scams. In the two most egregious cases, A3 and Inspire charter networks, self-serving operators double-billed, falsified attendance records, and funneled funding to shell operations, stealing hundreds of millions of dollars.
San Diego County prosecutors, who convicted A3’s executives in 2019, have expressed frustration that it has taken so long to enact remedies. Three separate task forces will present findings by June.
Chances that the Legislature will pass non-classroom-based accountability reforms this year:
Worth every penny?
EdSource reporter Diana Lambert calculated that pay for superintendents in some of the state’s districts had increased by 60% in the past decade; it’s a tough job, and these days, not too many appear to want it.
Including benefits, Christopher Hoffman of Elk Grove and Alberto Carvalho of Los Angeles Unified, respectively the state’s fifth-largest and the largest districts, earn over $500,000 per year. That’s hardly chump change, but then again, Dodger pitcher and hitter extraordinaire Shohei Ohtani signed a 10-year contract for $700 million, an average of $70 million per year.
Carvalho could argue he’s certainly worth at least 1% as much: $700,000. After all, he oversees a $20 billion budget. But with declining enrollment and layoffs likely, this is not the year to swing for the fences.
Chances Carvalho or any superintendent among the 10 largest districts will receive a 7% raise this year:
The anti-anti-tax initiatives
The Business Roundtable and Howard Jarvis Taxpayers Association, carrying the torch of Proposition 13, have placed an initiative on the November ballot to make it harder to pass state tax increases. It would redefine a number of state-imposed fees as taxes, therefore requiring a two-thirds majority of the Legislature to pass and require all future taxes or increases approved by the Legislature to go before the general electorate for approval. It also would nullify a recent state court ruling that school parcel taxes initiated by citizens, not by school boards, need only a majority of voters to pass — instead of the standard two-thirds.
In a shrewd counter-move to head it off, legislators, mostly Democrats, voted to place a competing constitutional amendment on the November ballot. It says that any initiative that raises the voter threshold for passing taxes would need the support of two-thirds of voters, not just a simple majority, to be enacted. It’s explicitly aimed at making it less likely the Business Roundtable initiative will pass.
Chances that voters will be as confused as I am by this chess match and wonder what will happen if they both pass:
Thanks for reading the column. One more toast to 2024!
Correction: An earlier version of the article incorrectly stated that Orange Unified board President Rick Ledesma denigrated gay activist Harvey Milk. The comment was made by Joseph Komrosky, president of the Temecula Valley Unified board.
Teacher apprentice Ja’net Williams helps with a math lesson in a first grade class at Delta Elementary Charter School in Clarksburg, near Sacramento.
Credit: Diana Lambert / EdSource
Top Takeaways
California leaders dismiss the criticism and methodology of the rankings.
And yet, graduate credentialing programs cram a lot in a year.
Many teachers may struggle with the demands of California’s new math framework.
In its “State of the States” report on math instruction published last week, the National Council on Teacher Quality sharply criticized California and many of its teacher certification programs for ineffectively preparing new elementary teachers to teach math and for failing to support and guide them once they reach the classroom.
“Far too many elementary teacher prep programs fail to dedicate enough instructional time to building aspiring teachers’ math knowledge — leaving teachers unprepared and students underserved,” the council said in its evaluation of California’s 87 programs that prepare elementary school teachers. “The analysis shows California programs perform among the lowest in the country.”
The report’s call for more teacher math training and ongoing support coincides with the state’s adoption this summer of materials and textbooks for a new math framework that math professionals universally agree will be a heavy lift for incoming and veteran teachers to master. It will challenge elementary teachers with a poor grasp of the underpinnings behind the math they’ll be teaching.
Kyndall Brown, executive director of the California Mathematics Project based at UCLA, agrees. “It’s not just about knowing the content, it’s about helping students learn the content, which are two completely different things,” he said.
And that raises a question: Does a one-year-plus-summer graduate program, which most prospective teachers take, cram too much in a short time to realistically meet the needs to teach elementary school math?
California joined two dozen states whose math preparation programs were rated as “weak.” Only one state got a “strong” rating.Source: National Council on Teacher Quality, 2025 State of the States report
Failing grades
The council graded every teacher prep program nationwide from A to F, based on how many instructional hours they required prospective teachers to take in major content areas of math and in instructional methods and strategies.
Three out of four California programs got an F, with some programs — California State University, Sacramento, and California State University, Monterey Bay — requiring no instructional hours for algebraic thinking, geometry, and probability, and many offering one-quarter of the 135 instructional hours needed for an A.
But there was a dichotomy: All the Fs were given to one-year graduate school programs offering a multi-subject credential to teach elementary school, historically the way most new teachers in California get their teaching credential.
On the other hand, many of the colleges and universities offering a teaching credential and a bachelor’s degree through an Integrated Undergraduate Teacher Credentialing Program got an A, because they included enough time to go into math instruction and content in more depth. For example, California State University, Long Beach’s 226 instructional hours, apportioned through all of the content areas and methods courses, earned an A-plus.
The California State University rejects the recent grading from the National Council on Teacher Quality about our high-quality teacher training programs
California State University
Most of the universities that offer both undergraduate and graduate programs — California State University, Bakersfield; San Jose State University; California State University, Chico; California State University, Northridge, to name a few — had the same split: A for their undergraduate programs, F for their graduate credentialing programs.
Most California teacher preparation programs have received bad grades in the dozen years that the council has issued evaluations. The state’s higher education institutions, in turn, have defended their programs and denounced the council for basing the quality of a program on analyses of program websites and syllabi.
California State University, whose campuses train the majority of teachers, and the California Commission on Teacher Credentialing, which accredits and oversees teacher prep programs, issued similar denunciations last week.
“The California State University rejects the recent grading from the National Council on Teacher Quality about our high-quality teacher training programs,” the CSU wrote in a statement. The council “relies on a narrow and flawed methodology, heavily dependent on document reviews, rather than on dialogue with program faculty, students and employers or a systematic review of meaningful program outcomes.”
The credentialing commission, in a more diplomatic response, agreed. The report “reflects a methodology that differs from California’s approach to educator preparation,” it said. “While informative, it does not fully capture the structure of California’s clinically rich, performance-based system.”
Heather Peske, president of the National Council on Teacher Quality for the past three years, dismissed the criticism as “a really weak critique.”
“You can look at a syllabus and see what’s being taught in that class much in the same way that if you go to a restaurant and look at the menu to see what’s being served,” she said. “Our reviews are certainly a very solid starting place to know to what extent teacher preparation programs are well preparing future teachers to be effective in teaching.”
It’s not just a problem in California.
“When we compare the mathematics instructional hours between the undergrad and the graduate programs, often on the same campus, we saw on average that undergrads get 133 hours compared to just 52 hours at the graduate level. In both cases, it is not meeting the recommended and research-based 150 hours,” Peske said.
Part of the problem is that graduate programs usually don’t have enough time to instill future teachers with the content knowledge that they need.
Heather Peske
Whether or not examining website data is a good methodology, the disparities in hours devoted to math preparation between undergraduate and graduate programs raise an important issue.
True jacks of all trades, elementary teachers must become proficient in many content areas — social studies, English language arts, English language development for English learners, and science, as well as math. Add to that proficiency in emerging technologies, classroom management, skills for teaching students with disabilities, and student mental health: How can they adequately cover math, especially?
“Part of the problem is that graduate programs usually don’t have enough time to instill future teachers with the content knowledge that they need,” Peske said. “California programs have to reckon with this idea that they’re sending a bunch of teachers into classrooms who have not demonstrated that they are ready to teach kids math.”
Brown said, “There’s no way that in a one-year credential program that they’re going to get the math that they need to be able to teach the content that they’re responsible for teaching.”
That was Anthony Caston’s experience. Before starting his career as a sixth-grade teacher at Foulks Ranch Elementary School in Elk Grove three years ago, Caston took courses for his credential in graduate programs at Sacramento State and the University of the Pacific. There wasn’t enough time to learn all he needed to teach the subject, he said. A few classes were useful, but didn’t get much beyond the third- or fourth-grade curriculum, he said.
“I had to take myself back to school, reteach myself everything, and then come up with some teaching strategies,” Caston said.
Fortunately for him, veteran teachers at his school helped him learn more about Common Core math and how to teach it.
The math content Brown refers togoes beyond knowing how to invert fractions or calculate the area of a triangle; it involves a conceptual understanding of essential math topics, Peske said. Only a deeper conceptual grasp will enable teachers to diagnose and explain students’ errors and misunderstandings, Peske said, and to overcome the math phobia that surveys show many teachers have.
Ma Bernadette Salgarino, the president of the California Mathematics Council and a math trainer in the Santa Clara County Office of Education, acknowledges that many math teachers have not been taught the concepts behind the progression of the state’s math standards. “It is not clear to them,” she said. “They’re still teaching to a regurgitation of procedures, copy and paste. These are the steps, and this is what you will do.”
Although a longtime critic of the council, Linda Darling-Hammond, who chaired California’s credentialing commission before becoming the current president of the State Board of Education, acknowledges that the report raises a legitimate issue.
“Time is an important question,” she said. “It is true that having more time well spent — the ‘well spent’ matters — could make a difference for lots of people in learning lots of subjects, including math.”
Darling-Hammond faults the study, however, for not factoring in California’s broader approach to teacher preparation, including requiring that teaching candidates pass a performance assessment in math and underwriting teacher residency programs, in which teachers work side by side with an effective teacher for a full year while taking courses in a graduate program.
“You could end up becoming a pretty spectacular math teacher in a shorter amount of time than if you’re just studying things in an undergraduate program disconnected from student teaching,” she said.
Weak state policies
The report also grades every state’s policies on math instruction, from preparing teachers to coaching them after they’re in the classroom. California and two dozen states are rated “weak,” ahead of seven “unacceptable” states (Montana, Arizona, Nebraska, Missouri, Alaska, Vermont and Maine) while behind 17 “moderate” states, including Texas and Florida, and a sole “strong” state, Alabama.
The council bases the rating on the implementation of five policy “levers” to ensure “rigorous standards-aligned math instruction.” However, California’s actions are more nuanced than perhaps its “unacceptable” ratings on three and “strong” ratings on two would indicate.
For example, the council dinged the state for not requiring that all teachers in a prep program pass a math licensure test. California does require elementary credential candidates to pass the California Subject Examinations for Teachers, or CSET, a basic skills test, before they can teach students. But the math portion is combined with science, and students can avoid the test by supplying proof they have taken undergraduate math courses.
At the same time, many superintendents and math teachers may be doing a double-take for a “strong” rating for providing professional learning and ongoing support for teachers to sustain effective math instruction.
Going back to the adoption of the Common Core, the state has not funded statewide teacher training in math standards. In the past five years, the state has spent $500 million to train literacy coaches in the state’s poorest schools, but nothing of that magnitude for math coaches.
The Legislature approved $20 million for the California Mathematics Project for training in the new math framework, which was passed in 2023, and $50 million in 2022-23 for instruction in grades fourth to 12th in science, math and computer science training to train coaches and teacher leaders — amounts that would be impressive for smaller states, but not to fund training most math teachers in California. (You can find a listing of organizations offering training and resources on the math framework here.)
In keeping with local control, Gov. Gavin Newsom has appropriated more than $10 billion in education block grants, including the Student Support and Professional Development Discretionary Block Grant,and the Learning Recovery Emergency Block Grant, but those are discretionary; districts have wide latitude to spend money however they want on any subject.
Tucked into a section on Literacy Instruction in Newsom’s May budget revision (see Page 19) is the mention that a $545 million grant for materials instruction will include a new opportunity to support math coaches, too. The release of the final state budget for 2025-26 later this month will reveal whether that money survives.
Brown calls for hiring more math specialists for schools and for three-week summer intensive math leadership institutes like the one he attended in 1994. It hasn’t been held since the money ran dry in the early 2000s.
EdSource reporter Diana Lambert contributed to this article.


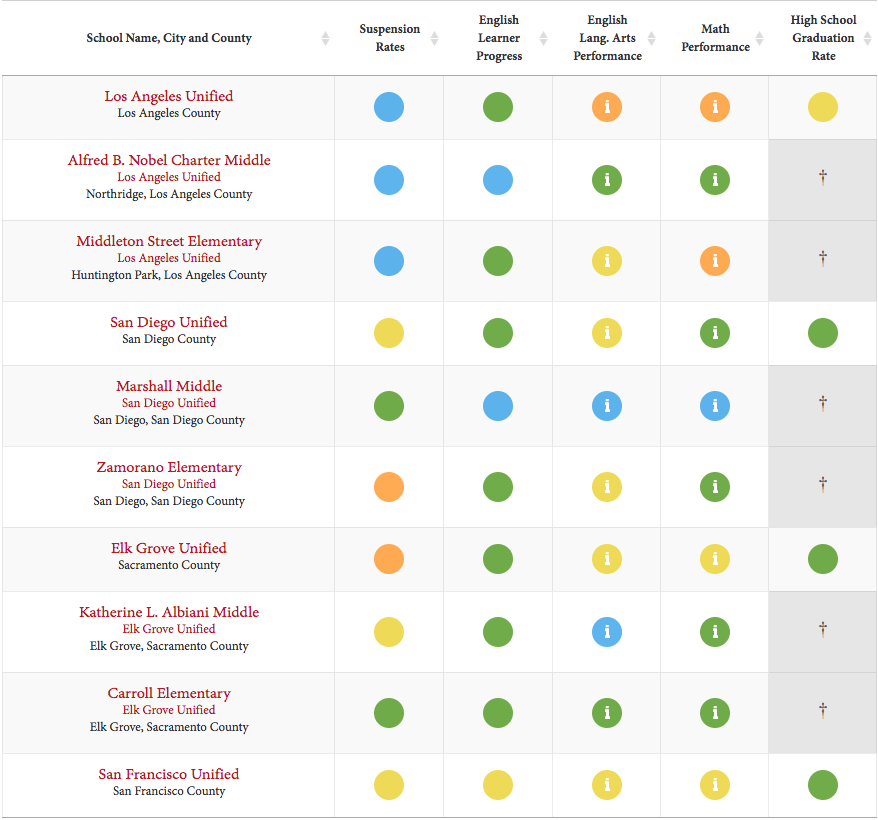
)
)