دسته: 1

  • Faculty, staff urge California colleges to make backup plans in case DACA ends

    Faculty, staff urge California colleges to make backup plans in case DACA ends


    Madeleine Villanueva, higher education manager of Immigrants Rising and Maria Barragan, director of undocumented student support services at Loyola Marymount University.

    Credit: Courtesy of Immigrants Rising

    Iveth Díaz has spent much of her career helping immigrant students living in the U.S. without permanent legal status navigate college. But when her own application to renew her work permit and temporary protection from deportation was delayed because of backlogs, she had to resign from her job for three months.

    “It was extremely stressful. It was a time when I suffered from anxiety and depression, which is unfortunately very common within our community,” Díaz said. 

    Díaz and other college and university employees with work permits and protection under the Deferred Action for Childhood Arrivals, or DACA, program are calling on universities to do more to help them prepare for alternative employment plans in case the program ends. Some proposals include helping employees become independent consultants, preparing a severance package or sponsoring work visas.

    DACA offers temporary protection from deportation and permission to work for about 579,000 young people who were brought to the U.S. as children and graduated from high school, completed a GED or are veterans of the U.S. military. Every two years, recipients must apply for renewal. But the program could end at any time. It was found to be illegal by a federal judge in Texas, and that case will likely end up in the Supreme Court.

    The program, launched during the Obama administration, has long been associated with high school and college students, but most recipients are now working adults. The U.S. Citizenship and Immigration Services has not accepted new applications since 2017, making the youngest DACA recipients currently 21 years old, and the oldest, now 42.

    “The DACA generation are not kids anymore,” said Madeleine Villanueva, higher education manager of Immigrants Rising, an organization based in San Francisco that helps undocumented people achieve career and educational goals and published a guide for colleges and universities to support undocumented employees. “A lot of us are in our 30s and 40s. We’re doing this work so that the future generation of undocumented students doesn’t have such a hard time like we did when we were going to school.”

    Hundreds of faculty and staff at California colleges and universities are DACA recipients, although the exact total is unclear. According to the Presidents’ Alliance on Higher Education and Immigration’s Higher Ed Immigration Portal,  there are about 9,211 recipients working in education in California, from elementary school to college. The University of California estimates it has more than 400 employee recipients, some of them students. Spokespersons for the California State University and California Community Colleges said they did not have data on how many employees are temporarily protected from deportation.

    Díaz worked for more than eight years at CSU San Bernardino as an administrative support coordinator for graduate researchers and as an admissions counselor. She now leads a program for students at Cerritos College who do not have permanent legal immigration status. As a fellow at Immigrants Rising, she conducted a survey of about 65 employees of California colleges and universities who at one time were living in the U.S. without permission, most of whom now have DACA protections. The employees included faculty, counselors, researchers and financial aid and admissions workers.

    She said most respondents said their colleges and universities have not prepared for what to do for their employees if the program ends.

    “Are we waiting until the program is canceled altogether, or are institutions being proactive in creating ways to retain their employees?” Díaz said. “I found that 70% of respondents stated that their institutions have not even brought it up, have not even had a conversation to their knowledge about what a response plan would be, which is really worrisome.”

    Laura Bohórquez García, the director of the AB 540 and Undocumented Student Center at UC Davis, decided to start her own business, Inner Work Collective Freedom, to employ herself if the program ends and she loses her work permit.

    “I’m like, OK, how do I prepare? Because I don’t feel like the university would be ready to jump in,” Bohórquez García said.

    In addition to plans in case DACA ends, concerned university employees and advocates recommended that universities offer more mental health benefits and that supervisors check in on their employees’ mental health. 

    “You have to check in with the students, but sometimes no one is checking in with you. How can we help others if we can’t even advocate for ourselves?”

    Eric Yang

    Many recipients working in colleges and universities are employed in positions dedicated to supporting immigrant students on their campuses, helping them get legal services or mental health counseling. But many of these positions are part-time and don’t offer health benefits, which are crucial when living with the uncertainty of losing temporary protection from deportation, advocates said.

    “So much of what they’re doing and the fires they’re turning off when it comes to students, it impacts them as well,” said Luz Bertadillo Rodríguez, director of campus engagement at the Presidents’ Alliance on Higher Education and Immigration, a group of college and university leaders dedicated to increasing public understanding of how immigration policies and practices impact students. “The constant word or feeling I hear when there’s a new DACA update is, ‘I’m exhausted.’ They’re just like, ‘I’m tired of living my life two years at a time and then even that not being certain.’”

    Whenever a new court decision comes out about the program, employees in the immigrant resource centers often find themselves holding workshops or trainings to help explain the decision to students, yet they are also processing the decision themselves. 

    “You have to check in with the students, but sometimes no one is checking in with you,” said Eric Yang, a recipient who has worked with immigrant students at two different California universities. “How can we help others if we can’t even advocate for ourselves?”

    University of California officials are currently examining ways to support employees if the temporary deportation protections are terminated, according to UC Office of the President spokesperson Stett Holbrook. He added that the UC Immigrant Legal Services Center offered immigration consultation workshops for recipient employees last summer, “many of which identified eligibility for employment, family or humanitarian relief.”

    RESOURCES FOR UNDOCUMENTED COLLEGE EMPLOYEES

    “The University of California has a long record of support for DACA recipients, and we will continue to support our students, staff and faculty regardless of their immigration status,” Holbrook said.

    The University of California is also currently considering a proposal to allow the university to hire students who do not have work permits under DACA. A coalition of immigrant students and allies, including legal scholars at UCLA and elsewhere, have argued that a federal law barring the hiring of immigrants living in the country without permission doesn’t apply to state entities.

    California State University and California Community Colleges both offer free legal services to employees who have temporary work permits. However, advocates said many faculty and staff are unaware that these services are not just for students.

    Melissa Villarin, spokesperson for the California Community Colleges Chancellor’s Office, said the community colleges have also recently included resources for staff and faculty during the annual Undocumented Student Action Week.

    Díaz also recommended more training for university staff about DACA recipients. She said survey respondents said there was a lack of awareness or understanding among other staff and faculty about their colleagues who have temporary protection under the program.

    “There was just no knowledge by institutions of higher ed about even having undocumented staff and faculty on campus,” Díaz said.

    She said lack of awareness can lead to insensitivity. At one point, for example, she said a human resources director asked her why she didn’t just fix her status or apply for a green card, not understanding that Díaz, like most immigrants who entered or stayed in the U.S. without permission, didn’t have a way to apply for a green card without leaving the country and possibly having to stay out for up to 10 years.

    Yang said universities should do more to highlight the stories of staff who are covered by the Deferred Action for Childhood Arrivals program “so that people in the public know that there are professional staff who are also potentially without any protection or support.”

    Despite the challenges these immigrants face, Bertadillo Rodríguez said they should be commended for their work. “They’re very involved in the students’ lives because they’re able to create such strong bonds with the students,” she said. “They’re some of the most exceptional and brilliant practitioners that I’ve come across in higher education.”


    Source link

  • Bring the California spirit of innovation to math classrooms

    Bring the California spirit of innovation to math classrooms


    Students at Robbins Elementary work in groups during a math lesson about scale.

    Credit: Sydney Johnson

    The state of California is at the global forefront of technological innovation and artistic inspiration. It’s also a powerhouse economy in its own right, currently the fifth largest in the world. We might expect — we should expect — such a place to deliver a world-class education to the 6 million public school students in its charge.

    This is not the picture that emerges from the most recent National Assessment of Educational Progress. These assessments found fewer than a quarter of California eighth graders performing at or above the “proficient” level in math. This represents both a decline from the state’s previous NAEP performance and a significant undershooting of the national average performance for eighth grade math.

    But the good news is that California is on the verge of a major education opportunity: The State Board of Education is scheduled to adopt new math curriculum in 2025, and high-quality instructional materials are a powerful, proven lever for improving student outcomes in math.

    The magnitude of this opportunity was made clear in a recent, California-focused report from the Center for Education Market Dynamics. My partners and I co-founded this nonprofit in 2020 to investigate, illuminate and help improve the murky national curriculum landscape. Our research indicates that 62% of California districts in our sample have in place a math curriculum from the state’s 2014 adoption list for elementary school, and 76% for middle school.

    The continued dominance of these curricula in California is not, on its face, a happy finding. It suggests that millions of the state’s most vulnerable students are saddled with past-generation math textbooks that do not reflect the important curriculum innovations and improvements of recent years. But it also means that state influence is real in California, and it’s big: many, many districts today, 10 years after the last adoption, are still waiting for that state signal to select new math curriculum — even though they don’t have to, as state adoption is nonbinding. California districts are ripe, ready, and hungry for state leadership on this front.

    State education leaders must leverage this upcoming adoption to vigorously encourage publishers to develop high-quality, innovative math curriculum for California’s public schools — and to relentlessly support its uptake and implementation in districts. In the decade since the last adoption, several big demographic shifts have accelerated in the state’s public schools, including an upsurge of English learners (students who are Hispanic/Latino now make up an outright majority, or 56%, of California public school students) and students experiencing poverty (60% of California public school students receive free and reduced-price meals). These students are not exceptional cases, but the mainstay and the heart of the California public school system. And they need the absolute best that the contemporary education market can deliver regarding math curriculum.

    What would that look like? We might see, for example, math curriculum that’s aligned to research-based quality criteria; that intentionally incorporates the best instructional practices for students learning English; that builds systematically underserved students’ executive functioning skills alongside their math skills; and that leverages leading-edge digital technology to engage students and provide just-in-time support to those who are struggling (disclosure: I’m on the boards of both AERDF and Zearn). There’s no shortage of brilliant research and development efforts happening in the world of math curriculum. And state education leaders in California are, right now, in the unique position to bring this innovation to bear in real ways on their students’ math experience.

    California must get this adoption right. Because when it comes to curriculum, what happens in California ultimately ripples across the country. The need is acute, nationwide, for more effective teaching and learning in math — for this generation of students to grow up without giving up on it. Better math curriculum will help us get there, and the state of California can help lead the way.

    •••

    Jeff Livingston is co-founder of the Center for Education Market Dynamics, a nonprofit K-12 market intelligence organization dedicated to improving academic outcomes for underserved students by expanding the adoption and use of high-quality teaching and learning solutions.

    The opinions in this commentary are those of the author. If you would like to submit a commentary, please review our guidelines and contact us.


    Source link

  • It’s time to fix the fatal flaw in California education funding formula

    It’s time to fix the fatal flaw in California education funding formula


    Credit: Allison Shelley for American Education

    California’s way of funding schools, the Local Control Funding Formula, was not designed to be perfect. That’s because most legislation requires a series of compromises necessary to minimize opposition, maximize support and win the necessary votes for passage. 

    In LCFF’s case, one of those compromises, the creation of the Local Control Accountability Plan, or LCAP, could eventually doom the reform.

    To understand why, it’s important to revisit the initial rationale for LCFF — replacing a complex, inequitable funding model with a simpler model that targeted grants based on student need and concentrated poverty.

    The old funding model was managed from Sacramento and included popular grants for the arts and music, English learners, career and technical education and more. Large and/or politically connected districts, nonprofits and statewide groups would lobby sympathetic lawmakers for their own grants. Over time, this model grew increasingly complex, limiting local discretion over spending and stifling innovation. Despite these problems, it had remarkable political resiliency. Lawmakers were incentivized to protect existing grants and got political credit for creating new ones. Very few stakeholders were interested in changing this dynamic and risk losing their favorite grants and programs.

    So, it wasn’t enough for the Brown administration to argue that LCFF was better because it was simpler, more equitable and gave districts more control over their money. They had to prove that it would fund many of the same programs as the existing model.

    Most education advocacy groups believed that this could be achieved by requiring districts to use the grants generated by high-need students to fund services that addressed their needs. But education groups representing labor and management wanted complete financial flexibility. To avoid this requirement, the education establishment collaborated with a few legal advocacy groups to create the Local Control Accountability Plan (LCAP), arguing that it would accurately document how they were spending money on programs and services.

    The last decade has provided strong evidence that this decision was based on flawed assumptions, beginning with the presumption that school districts are the best recipients of funding for high-need students. While district bureaucracies are certainly closer to students than Sacramento policymakers, they aren’t as close as principals and teachers. Unlike schools, district leaders face powerful interest groups that lobby them for spending like higher salaries and districtwide programs. That’s why most targeted grants like federal Title I funding are sent to districts but then quickly distributed to high-poverty schools. Without similar requirements, it’s likely that billons in LCFF dollars that could have funded school-based services were spent on district-level costs such as salaries, benefits, pension obligations and more.   

    Second, policymakers assumed that districts would accurately document spending on services in the LCAP. But LCAPs were never formally connected to school district budgets, which include ongoing costs like salaries and benefits. In fact, the processes for developing LCAPs and budgets occur separately on different timelines. Almost every analysis of LCAPs has found that their financial and programmatic information cannot be verified and the documents themselves are largely incomprehensible.

    Third, they believed that districts would focus on improving student outcomes without clear state-level goals and metrics to guide their decision-making. Instead of big, important goals — like grade-level math achievement — policymakers created a mishmash of state priority areas (many of which can’t be measured) and told districts to include them in their LCAPs. Predictably, most districts paid lip service to these priorities in their LCAPs and then wrote separate strategic plans. At this point, most district leaders probably can’t remember what the state priorities are. If everything is a priority, nothing is.

    Finally, and most importantly, they assumed that all of this would improve outcomes for the most vulnerable students. Here, the evidence is limited, especially given the size of the funding increases. Given the persistently low academic performance of most high-poverty districts and the state’s sizable achievement gaps, today’s elected officials can fairly ask whether our state has seen a commensurate return on these massive education investments.

    It’s no wonder that over the last several years, elements of the previous school finance regime have roared back. Elected officials who didn’t create LCFF and are suspicious of “local control” have created a whole new set of targeted grants like the governor’s community schools grant. Districts are now subject to far more onerous legalistic requirements for their LCAPs, which are intended to show that they’re using their funding for high-need students.

    District leaders have bitterly complained about these shifts. On one level, they are right that the advocates and policymakers focused on the LCAP are just doubling down on a failed strategy. But they haven’t offered any alternative, other than “leave us alone.”

    The danger for them is threefold. Increasing levels of scrutiny and regulation; ever more targeted grants that limit their discretion; and, as the years pass, the belief that local control has failed high-need students, requiring more aggressive state and county oversight. A few years from now, they could end up with the worst aspects of the old finance model and the new one.

    There is another way.

    A decade later, we have a lot of evidence on how to make the formula better. Perhaps a substantial portion of LCFF funding, such as concentration grants (for schools with more than 55% high-needs students) should flow directly to schools based on their poverty level, like Title I funds do. State leaders could establish a few measurable academic and social-emotional priorities that districts would address in strategic plans rather than LCAPs. Instead of a potpourri of grants that limit local discretion or new LCAP compliance requirements, lawmakers could create incentives, such as additional weighted funding for districts willing to create new programs such as language immersion schools. They could even establish financial rewards for districts based on student outcomes.

    There are many possibilities, but for the Local Control Funding Formula to survive over the long term, it must always be able to answer a very basic question: What is it doing to improve the education of California’s highest-need students?    

    •••

    Arun Ramanathan is the former CEO of Pivot Learning and the Education Trust—West

    The opinions expressed in this commentary represent those of the author. EdSource welcomes commentaries representing diverse points of view. If you would like to submit a commentary, please review our guidelines and contact us.


    Source link

  • Hope for West Fresno now comes in the form of a college campus

    Hope for West Fresno now comes in the form of a college campus


    A student walks past the “You Belong Here” sign at Fresno City College’s newest campus, West Fresno Center.

    Credit: Betty Márquez Rosales / EdSource

    Brianna Knight can walk from her college campus down the street to her family’s home to check on her children when they need her, an option only recently available with the opening of Fresno City College’s latest campus in West Fresno.

    Her family, longtime residents of West Fresno, often takes care of her children while she’s in class or working as a tutor on campus. Knight, who is completing her associate degree in human biology, said that working toward her degree was more stressful before the new campus opened.

    She had planned to leave her hometown before the new West Fresno Center was built, she said, because she didn’t see a future there for her children. But her plans have changed now that the campus is open.

    “I’m big on: Where can I plant my seeds for my kids to grow? And if my kids can’t grow somewhere, why am I here? And so to be able to have this in the community I grew up in … if my kids don’t want to leave, they don’t have to,” Knight said about the new campus.

    For the West Fresno community that fought for this new campus, the college has come to symbolize hope for future generations like Knight’s children.

    Eric Payne, executive director of the nonprofit Central Valley Urban Institute, and Brianna Knight were both raised in West Fresno. Knight is currently a student at the new West Fresno Center campus of Fresno City College.
    Credit: Betty Márquez Rosales / EdSource

    “West Fresno is a phoenix rising out of the ashes because we can fundamentally zero out a lot of the systemic issues that we’re experiencing if we center the voices of young people in our community,” said Eric Payne, executive director of the nonprofit Central Valley Urban Institute. “And what better place than a college campus?”

    West Fresno is home to over 25,000 people in a historically marginalized section of the Central Valley’s largest city. It’s a region with one of the highest levels of concentrated poverty in the nation, higher rates of incarceration, and a lower life expectancy rate by about 20 years than their neighbors in wealthier sections of Fresno.

    These statistics have solidified over decades with strategic redlining practices, documented in detail, since at least the 1930s, and have led to limited opportunities and resources for those raised in the area.

    “Before, it was … just all about survival. There was no space to really grow. You don’t see a future, you don’t see yourself being a nurse,” said Knight, 33. “You hear about it, but you don’t actually get to see it.”

    It’s an area so deeply understood by locals as being underserved that a high school graduate made the local news this year because she was valedictorian, despite growing up within 93706, West Fresno’s ZIP code.

    “I can graduate with the highest honors despite the lack of resources and violence we endure on the West Side,” said Uzueth “Uzi” Ramírez-Gallegos during her speech, as reported by the Fresno Bee.

    This history is why the newest Fresno City College location was thoughtfully chosen to be constructed within a 1- to 2-mile radius of more than 10 K-12 schools.

    “We operated from a place of intention,” said Payne, who grew up in West Fresno and was elected trustee of State Center Community College District’s governing board in 2012. “How do we pull the greatest number of students into this community college?”

    The answer to that question was twofold: Build the new college campus within walking distance of those K-12 schools, plus reach out to the students and staff at those very schools to draw them onto campus and eventually enroll in the courses.

    The long-term vision for the college, Payne and campus leaders emphasized, is to create a space that not only disrupts the school-to-prison pipeline in the area but also more deeply connects West Fresno to the rest of the city.

    “I think the location is perhaps the best decision that was made by the community members and administration to make sure that 93706 is no longer left behind,” said one such campus leader, Gurminder Sangha, dean of educational services at the West Fresno Center.

    The 39 acres on which the school stands today were empty before its construction.

    Gurminder Sangha is the dean of educational services and pathway effectiveness at the West Fresno Center.
    Credit: Betty Márquez Rosales / EdSource

    The financial backing for the acquisition of the land and construction of the facility was secured in a combination of ways: partial funding from a $485 million facilities bond approved by voters in 2016, a $16.5 million grant awarded by the city of Fresno through its Transformative Climate Community program, and an additional $11 million directly from the city.

    Included in the mix was a donation of 6 acres from TFS Investments, a real estate investment firm that owned a portion of the land where the campus now stands.

    The land has since been transformed into an open campus, with an automotive technology center opening in the new year, where students will train for certifications in electric vehicle mechanics and in the field of alternative fuels such as diesel technology.

    The degrees and programs offered at the campus include access to medical assistant certifications, chemistry and biology laboratories, business administration courses, elementary teaching education training, and more.

    There is also a newly-established city bus stop at the front entrance of the school on the previously existing route 38, with service every 15 minutes between 6 a.m. and 6 p.m. on weekdays.

    Local community members have long expressed frustration over the unreliable public transit system. The new stop and the accompanying free bus passes available for students are meant to increase accessibility to and from the campus.

    Perhaps most clearly bridging the new campus to its local West Fresno community is the one-mile walking trail with exercise equipment circling the campus, which will be open to all once construction is finished.

    The amenities and services offered at the new campus are in contrast with the larger West Fresno community, where essentials like grocery stores, banks and even trees are uncommon. In light of this contrast, the school is becoming a haven for many. Knight, for example, noted that her children enjoy walking from their home up the street and onto the campus.

    Those who enter the campus’ main lobby are greeted by both staff and peers who are hired to work in the student services department housed on the first floor of the same building where many of the college’s academic courses are offered.

    From counseling to basic needs resources and financial aid to records, students can easily find the right person to speak with because those offices are one of the first things they see as they walk into the lobby. The clearest welcome might just be the large lettering above those offices, which reads: “You belong here.”

    George Alvarado is the Director of Counseling and Special Projects at the new West Fresno Center. He offered EdSource a tour of the campus during a recent visit.
    Credit: Betty Márquez Rosales / EdSource

    Barring the sections of campus remaining under construction through the beginning of next year — the automotive center and the walking trail — it is difficult to believe that the school opened just this fall; the facility has the typical hum of a college campus. Some students take their mid-class breaks in the main lobby, which doubles as a student lounge area, complete with snacks available for purchase and soft classical music playing in the background.

    Others study in the academic support centers on the second floor, where they also have a clear view of the greater West Fresno community.

    Sangha expects the available resources will expand as the school community grows.

    Conversations around building the campus began nearly two decades ago, said Sangha, with the actual construction taking about two years to complete.

    Payne noted that he remembers hearing about a college being established in West Fresno when he was in high school over two decades ago, but “it never materialized,” so he left Fresno at the time to attend Alabama A&M University.

    When he returned to his hometown years later, he began organizing with his former neighbors and joined a movement to push for what eventually became West Fresno Center. If it had existed when he was in high school, he said he may have chosen to stay in the city where he grew up and that more of his peers might have had better life outcomes and opportunities.

    “There are a lot of people that I graduated with that are deceased, that are incarcerated, and a lot of folks who are barely making it financially,” he said. “There was a thirst for this facility; there was a thirst for better outcomes.”

    That thirst is slowly being reflected in the number of students enrolling from the West Fresno community. Out of the 800 enrolled during this first fall semester since its grand opening, 130 students are exclusively taking courses at this campus, about 125 live in the 93706 ZIP code, and about 160 live in 93722, the ZIP code just north of campus.

    With their doors now open, plans are in place to offer college credit to local high school students. At three nearby high schools — Edison, Washington Union, and Kerman — students are already in dual enrollment courses held at their high school campuses. Sometime next year, according to Sangha, West Fresno Center plans to offer courses for high school students at the college campus so they may earn additional credits.

    “It is truly an academic village in a way, in that students can envision themselves walking from one school to the other school, then coming to us and going to Fresno State or wherever they want to go,” said Sangha.

    Knight graduated from high school about 15 years ago and moved to Los Angeles to enroll in Santa Monica College, but her move coincided with the 2008 recession and she couldn’t afford to remain in L.A. She returned to Fresno and enrolled in Fresno City College, but left shortly after becoming pregnant.

    “My journey to school has been … it’s been very different,” she said. “I’ve tried to come back throughout the years, and I just don’t think I was ready.”

    During the pandemic, she enrolled in school once more. She said the support she has received at the center made a significant difference for her.

    “My professors actually care that I show up, whether I’m late or whether I have to leave and take care of my kids or come back — which doesn’t happen often, but the fact that I have that support is important,” she said.

    Knight, who is a Fresno Unified School District graduate and whose mother and grandmother worked at Fresno Unified schools, now plans to continue raising her children in West Fresno. She is completing her degrees in human biology, public health and pre-allied health this month and will be walking the graduation stage in May.

    “To live across the street and to see it being built from the ground up, that was everything to me,” said Knight, a mother of two who is pregnant with twins. “It changed my whole mindset on Fresno, to be honest with you.”


    Source link

  • Bonta backs motion blocking censorship, transgender notification in Temecula schools  

    Bonta backs motion blocking censorship, transgender notification in Temecula schools  


    The LGBTQ+ community rallies in solidarity, opposing the Social Studies Alive! ban in Temecula Valley Unified in June 2023.

    Credit: Mallika Seshadri / EdSource

    California Attorney General Rob Bonta is formally backing a motion to prevent the Temecula Valley Unified School District from implementing policies that could censor instruction about race and gender as well as those that force employees to notify parents if their child shows signs of being transgender. 

    In August, Public Counsel, the nation’s largest pro bono law firm, and Ballard Spahr LLP, filed a case against Temecula Valley Unified School District on behalf of its parents, teachers, the teachers union and students. A hearing on the motion for a preliminary injunction to block the board from enforcing its policies as the case moves forward will take place on Jan. 24. 

    Bonta’s brief, in support of the plaintiffs, marks the first time in recent history that the state has intervened in litigation to curb ideological censorship in the classroom, according to Public Counsel’s Opportunity Under Law project supervising attorney Amanda Mangaser Savage. 

    “The state is recognizing that this case will be a bellwether for courts across the state and for, frankly, states across the nation in terms of what school boards can and cannot do in classrooms,” Mangaser Savage said. 

    “It is abundantly clear under the law that school boards can’t restrict students’ access to ideas on an ideological basis, but that is precisely what is happening.”

    The lawsuit comes after the Temecula Valley Unified School District school board’s conservative majority — elected in November 2022 — banned critical race theory, temporarily took the social studies curriculum Social Studies Alive! off the shelves due to a mention of LGBTQ+ rights activist Harvey Milk in the supplemental material, fired former Superintendent Jodi McClay and passed a policy that would require school officials to notify parents if their child shows a sign of being transgender. 

    Temecula Valley Unified’s school board has since received backlash from the community, which lodged a campaign to recall its three conservative board members — and submitted enough signatures to move forward in the recall process for board President Joseph Komrosky. 

    This isn’t the first time Bonta has opposed transgender notification policies percolating in about half a dozen California districts. He previously opened a civil rights investigation of the same policy implemented at the Chino Valley Unified School District and had called the measures approved by Temecula Valley Unified a “grave concern.” 

    “The attorney general’s participation just really highlights and emphasizes that illegality. It emphasizes the strength of the legal claims that the students have brought here,” Mangaser Savage said. “So it’s really heartening to see the attorney general participate in this and certainly aligns with what we understand to be his commitment to safe, inclusive, equitable schools.”

    Bonta’s brief specifically states that “forced disclosure provisions” regarding transgender students “violate these students’ state constitutional right to equal protection and statutory protections from discrimination.” 

    It also states that the transgender notification policy infringes on student’ right to privacy and discriminates against transgender and gender-nonconforming “students for forced disclosure, and not their cisgender peers.” It further alleges that the policy is based on outdated social stereotypes that being transgender is a mental illness. 

    Bonta’s brief also alleges that board policies censor materials about race and gender and that censoring aspects of a curriculum has to be “reasonably related to legitimate educational concerns,” not based on religious or philosophical disagreements. 

    Censored materials, according to the brief, might include speeches written by Martin Luther King Jr., major court rulings, discussion of the U.S. government’s treatment of Native Americans, study of the women’s suffrage movement and police violence against Black Americans. 

    “These harms aren’t limited to Temecula, students and teachers, although they are certainly the most directly and most significantly impacted. But the threat here is to the entire system of public education in California,” Mangaser Savage said. 

    “When teachers are limited in teaching accurate history, when books are taken off of library shelves, when material that the state has determined is necessary for its students to learn to be meaningful participants in our democracy is being censored … that is deeply problematic and that poses a threat not just to Temecula students again, but to students across the state and to the health of our democracy as a whole.”


    Source link

  • Commission decision could move thousands of new teachers into the workforce quicker

    Commission decision could move thousands of new teachers into the workforce quicker


    A teacher helps a student with a math problem.

    Credit: Sarah Tully /EdSource

    Thousands of teachers could be added to the state’s workforce next school year because of a California Commission on Teacher Credentialing decision to offer teacher candidates who almost pass their teaching performance assessment a chance to earn a preliminary credential without retaking the test.

    Beginning early next year, teacher candidates who come within -1.0 standard error of measurement — generally about two or three points — of passing either the California Teaching Performance Assessment or the edTPA, can earn their credential if their preparation program determines they are prepared, commissioners voted on Friday. This decision will not impact teacher candidates who take the Fresno Assessment of Student Teachers. 

    “To be clear, the recommendation is not proposing lowering the standard, rather it would expand the ways in which candidates could demonstrate their readiness to begin teaching,” said Amy Reising, chief deputy director of the commission on Friday.

    Performance assessments are required to earn a teaching credential in California. Candidates demonstrate their competence by submitting evidence of their instructional practice through video clips and written reflections on their practice. Student candidates who select the CalTPA must complete two assessments or cycles.

    “The secondary passing standard would be targeted toward candidates who fell just short of the current adopted passing standards set for these assessments, but may have demonstrated classroom readiness through other measures at the local level and within their programs,” Reising said. 

    Preparation programs can recommend eligible candidates for a preliminary credential by documenting that they have demonstrated proficiency in each of the seven domains in the state Teaching Performance Expectations, according to the commission.

    The decision came after commissioners reviewed a report at their October meeting that revealed that a majority of teacher candidates who failed performance assessments over the last five years were extremely close to passing. If the new standard had been used over the last two years, 2,000 of the 2,731 teacher candidates who failed cycle one of the CalTPA , 953 candidates of the 1,152 who didn’t pass cycle 2 of the CalTPA, and 360 of the 1,124 candidates who failed the edTPA would have passed the assessment and earned a credential, according to the commission.

    Teacher candidates whose score is too low on their performance assessment to take advantage of the secondary passing standard can work with their teacher preparation program to revise or resubmit their work, said Anita Fitzhugh, spokesperson for the commission. The assessment can be submitted at any time at no cost because the state waived the fees. It takes about three weeks to receive a score.

    Commission staff also plan to work with teacher preparation programs to develop a formal process to identify and support programs with low teacher performance assessment passing rates, according to staff reports.

    An enduring teacher shortage has put pressure on the state to remove hurdles to earning a teaching credential. In July 2021, legislation gave teacher candidates the option to take approved coursework instead of the California Basic Education Skills Test, or CBEST, or the California Subject Examinations for Teachers, or CSET.  

    The commission’s new plan isn’t without controversy.  One concern from speakers at Friday’s meeting was that the decision would undermine Senate Bill 488, which requires the commission to replace the Reading Instruction Competence Assessment with a teaching performance assessment.

    Commission staff said that the secondary passing standard for the two performance assessments will not impact the literacy performance assessment that is under development and is expected to be piloted in the spring and field-tested the following school year.

    “A separate standard-setting study will be conducted in Spring 2025 to recommend passing standards for the literacy performance assessment,” Reising said in an email on Monday.

    According to commission staff, a work group made up of teachers, administrators, mentor teachers and university faculty will convene in July to study and make recommendations on how to improve all three of the state’s performance assessments. It will consider best practices, the challenges of implementation and how to ensure reliable scoring. 

    More than 50 people submitted comments to the commission on the state’s performance assessments. Most urged commissioners to either eliminate or revamp the performance assessments. 

    “TPAs are vastly subjective, depending on who is scoring the assessment; rubric-based explanations and feedback upon results are very vague,” said Aly Gerdes, a teacher at Evergreen Elementary School District in San Jose. “I truthfully do not see the inherent value in CalTPA and believe it needs to be abolished or replaced with something that is worthwhile and will do more than add an extra stressor to teacher-candidates’ lives.”

    Many speakers and letter writers said the high-stakes assessment is detrimental to teacher candidates.

    “On a personal level, the stress and pressure associated with the TPA can be overwhelming,” wrote teacher Cheena Molsen.

    “The weight of high-stakes evaluations can adversely affect the well-being and morale of educators, potentially diminishing their effectiveness in the classroom. The toll it takes on the personal lives of teachers should not be underestimated, as the pursuit of excellence in education should not come at the cost of educators’ mental and emotional well-being.”


    Source link

  • A refresher on the California School Dashboard | Quick Guide

    A refresher on the California School Dashboard | Quick Guide


    Children working together on Chromebooks

    Media arts classes can help children learn how to mix digital skills with the creative impulse.

    Credit: Mountain View Whisman Elementary School District

    The California School Dashboard is back in full color for the first time in four years.

    The dashboard, which the California Department of Education will release on Friday, is the state’s academic accountability and improvement tool designed for parents and educators. It rates the performance of every school, district and charter school, along with any of 13 student groups that attend them, with a color on seven indicators of performance, including math and English language arts test scores, chronic absence rates and graduation rates.

    First introduced in 2016-17, the dashboard was suspended because of the pandemic in 2019-20 and 2020-21, and resumed this year with the collection of two consecutive years of data needed to generate color ratings.

    Here’s a guide to the dashboard for first-time viewers and for those who need a brush-up course on how to read and interpret the colors and the data behind them.

    Why the dashboard?

    The Local Control Funding Formula, passed by the Legislature in 2013, required it — or something close to it. 

    Dissatisfied with the Academic Performance Index, which assigned a three-digit ranking to districts based exclusively on test scores, legislators mandated a broader look at school performance and conditions of learning through multiple measures. There would be no summative ranking; instead, there would be components, such as suspension rates, that would provide evidence for specific actions for improvement. The Legislature required that districts and schools highlight lowest-performing student groups, not just districtwide averages for all students that can shroud inequalities. The intent was to tie actions in a district’s three-year improvement strategy, the Local Control and Accountability Plan, or LCAP, to results in the dashboard.

    The dashboard also marks a shift away from the mindset of the federal No Child Left Behind Act. Instead of punishment for low performance, the funding formula promises guidance and assistance to districts with low-performing student groups. As State Board of Education President Michael Kirst and then-state Superintendent of Public Instruction Tom Torlakson wrote in a 2017 commentary for EdSource, “We have a rare opportunity to turn data into direct action. The state is now able to identify specific challenges school districts are facing and is committed to providing assistance rather than the sanctions of the past.”

    Which are the 13 student groups?

    African American, American Indian, Asian, English learners, Filipino, foster youth, Hispanic, homeless, two or more races, Pacific Islander, socioeconomically disadvantaged, students with disabilities, and white.

    What are the performance indicators?

    Chronic absenteeism measures students from kindergarten through eighth grade who were absent at least 10% of school days during the academic year, or at least 18 days.

    English learner progress indicator, which is new this year, measures progress toward English language proficiency by measuring English language learners’ results on the English Language Proficiency Assessments for California from the current to the previous year.  

    Suspension rate measures the percentage of students who were suspended for a total of one full day anytime during the school year (multiple suspensions of the same student are not factored in).

    Graduation rate measures the percentage of students receiving a high school diploma within four or five years or who complete graduation requirements at an alternative school.

    College/career indicator measures the percentage of high school graduates who are prepared for college or a career. It looks at the number of students who completed or fulfilled one or some of the following metrics:  

    • Advanced Placement exams. 
    • A-G course requirements for a state university.
    • A career technical education pathway.
    • College credit through dual enrollment.
    • An International Baccalaureate exam.
    • Leadership/military science program.
    • A pre-apprenticeship.
    • A state and federal jobs program.
    • The State Seal of Biliteracy.
    • Work-based learning experiences.
    • Performance rates on the 11th-grade Smarter Balanced tests in English language arts and math. 

    Schools or districts where 55% of students meet the criteria are rated high performance; at 70%, they are rated very high.

    English language arts indicator measures the Smarter Balanced test results and the California Alternative Assessments for grades three to eight and grade 11. It is determined by students’ average distance in points below or above the score that indicates a student performs at standard for the grade. A school’s or district’s participation rate counts, too.

    Math indicator measures the Smarter Balanced test results and the California Alternative Assessments for grades three to eight and grade 11. It is determined by students’ average distance in points below or above the score that indicates a student performs at standard for the grade. A school’s or district’s participation rate counts, too.

    Why are there colors?

    Seeking to create a tool that encourages improvement, the state board concluded that the most constructive measure would include both the results for the current year and an indication of whether those scores increased or decreased from the year before. A color reflects the intersection between both variables: the current status and one-year change; both factors are given equal weight. Schools with previously very low math scores that show significant improvement the next year, for example, are rewarded by moving up from red to yellow or green. Schools that suspended lots of kids this year compared with the year before will see the color change from green to yellow or orange — a signal that it’s time to pay attention and ask why.

    How are colors determined?

    Source: California School Dashboard

    A look at a five-by-five grid provides the answer. For every indicator, the results for the current year are divided into five performance categories, listed from top to bottom: very high, high, medium, low and very low. Change in performance from the previous year is also divided into five categories, listed from left to right: declined significantly, declined, maintained, increased, increased significantly. As in bingo, mark your X on the intersection of vertical numbers on the left with the horizontal numbers at the top.  

    To illustrate, consider the graduation rate of Santa Ana Unified. Its 89.7% graduation rate in 2023 is 3.3 percentage points higher than the state average, but the decline of 2.8 percentage points from 2022 pushed it from what might have been green or yellow to orange.  

    You have to look at the underlying data to understand a color, especially yellow. It could indicate good news or bad, depending on the change from the year before. It doesn’t mean satisfactory.

    Have the cut scores defining the performance levels and change been reset to reflect learning setbacks resulting from Covid?

    No. The same criteria that determined a red or blue in 2017 applies to 2023. However, because of the suspension of the dashboard during the pandemic, the 2023 dashboard will reset the rating process. Test scores were higher and chronic absences were a lot lower pre-pandemic than in 2023. Color ratings in 2023 understate some of those disparities by comparing 2023 results with those of 2022, the first post-pandemic year.  An EdSource analysis, found in 2019, 82 districts scored very high in math and 47 districts scored very low. In 2023, 63 districts scored very high, and 137 scored very low.

    Why is there no color this year for the college and career indicator?

    The results of the Smarter Balanced tests in 11th grade in math and English are a metric used to determine that indicator. There need to be two years of test results to measure change on the dashboard. No test was given in spring 2021, so there was no score for the class of 2022 and therefore no way to compare it with the 11th grade results for the class of 2023. Next year, there will be a color for the 2024 dashboard, with the publication of 11th grade scores in 2023 for the class of 2024.

    What is the equity report?

    The equity report is what you turn to by clicking on any performance indicator on the home page for any district or school. It takes you to a color breakdown of all 13 student groups with enough students to be measured. Click further, and it will show the underlying data — scores and the change from the year before — for each student group. Comparing the groups reveals disparities and rates of improvement, evidence for setting goals in the Local Control Accountability Plan to close achievement gaps.

    How does the dashboard define what low-performing districts and charter schools qualify for extra help, called differentiated assistance?

    It’s complicated.

    In writing the funding formula, the Legislature said that districts, county offices of education and charter schools should be held accountable for performance in several priority areas. The state’s seven statewide performance indicators fall within them: school climate (suspension rates); pupil engagement (graduation rate and chronic absences) and pupil achievement (the English Learner Progress Indicator and the math and English language arts tests).

    Districts and charter schools are eligible for differentiated assistance when one or more student groups get a red rating in two or more priority areas. They will receive help from a county office of education; poor-performing county offices, which also run schools, will get help from the state.

    In 2023, 466 school districts and county offices of education will be eligible for differentiated assistance; they represent 47% of the total. That’s 151 fewer than in 2022; the biggest factor was a decline in the rate of chronic absenteeism. While still at historic levels, the 5.7 percentage point statewide drop from 30% pushed the state and most districts into yellow, from what would have been red.

    The Legislature also established priority areas for which there are no statewide measures: Basic school conditions, such as appropriately assigned credentialed teachers and clean and functional school facilities; implementation of state academic standards; parent and family engagement, and access to a broad course of study. Districts have local options on how to verify annually that the standards have been met. A failure to meet the standards in a local priority area for two consecutive years can also qualify a district for differentiated assistance.     

    This year, for the first time, districts must address in their Local Control Accountability Plans how they will address student groups performing in the red on any indicator in any school. This new mandate is intended to ensure funding from the Local Control Funding Formula is directed to the students with the most needs.


    Source link

  • Search and compare data from the California School Dashboard, 2023

    Search and compare data from the California School Dashboard, 2023


    On Dec. 14, 2023, the California Department of Education updated the official California School Dashboard with the latest data for schools and districts. You can also view results for 2019, 2018, and 2017.* The dashboard shows achievement and progress, or lack of it, on multiple measures in color codes tied to performance metrics by the state. Enter a search term in the box to search by school, city, district or county. If a school or district does not appear, it means that no data is available. Detailed test scores are available on cells with an “i” (click to see more). For a full explanation, see the notes below the chart.

    * The 2022 California School Dashboard only displays that year of results, without comparisons to the previous year, due to disruptions caused by the pandemic. 


    School Name, City and County Chronic Absenteeism Rate Suspension Rates English Lang. Arts Performance Math Performance High School Graduation Rate English Learners Link
    School Name, City and County Chronic Absenteeism Rate Suspension Rates English Lang. Arts Performance Math Performance High School Graduation Rate English Learners Link

    Notes to Database

    Color Codes and Ratings: The dashboard includes five color-coded performance levels, based on a combination of current performance level and change over the previous year. The color spectrum ranges from red to orange to yellow to green to blue, with red signifying the lowest performance level and blue the highest.

    More information about how the performance levels were calculated is available at the California Department of Education’s website here.

    Column Headings:

    Chronic Absenteeism: Proportion of students who miss 10 percent or more expected days of attendance in a school year. (For a student enrolled for 180 days, this would be 18 or more days.) Note: This indicator is not reported for high schools.

    Suspension Rates: Based on a combination of current suspension rates and changes in those rates over time.

    English Language Arts Performance: Student performance in Grades 3-8 and 11 on the English Language Arts Smarter Balanced tests administered in the current year, combined with whether scores improved, declined or stayed the same compared to the previous year.

    Math Performance: Student performance in Grades 3-8 and 11 on the math Smarter Balanced tests in the current year combined with whether scores improved, declined or stayed the same compared to the previous year.

    High School Graduation Rate: Combined four-year and five-year graduation rates, including current graduation rate along with whether rates have changed over the previous year.

    For more information about how the performance levels were calculated, go to the California Department of Education’s website here.

    For the full dashboard for each school or district, go here.

    Read more:


    Source link

  • California School Dashboard released for the 2022-23 School Year

    California School Dashboard released for the 2022-23 School Year


    Students work together during an after-school tutoring club.

    Credit: Allison Shelley for American Education

    For the first time since 2019, the California Department of Education has fully updated the California School Dashboard that tracks the annual progress of K-12 students on factors such as standardized test scores, chronic absenteeism, suspensions and graduation rates.

    Since its rollout in 2017, the dashboard aims to show the progress of students at the state, district and school level using a color-coded system. It breaks this information down by 13 student subgroups, such as English language learners, disabled students and race and ethnicity. Friday’s update provides a snapshot of the progress made between the 2021-22 and 2022-23 academic years, representing the aftermath of the pandemic’s peak.

    Red signals the poorest performance, followed by orange, yellow and green, while blue signals the best performance. State officials say that anything below green indicates the need for attention and improvement. Amidst the pandemic, the state stopped releasing this information in 2020.

    The dashboard relies on some data, such as test scores and chronic absences, that was released in October. Other data — such as graduation rates and how many students met the entrance requirements to California universities, one measure of career and college readiness — were released Friday.

    For the first time, this year’s dashboard adds a color-coded score to measure how many English learners are making progress toward proficiency on the English Language Proficiency Assessments of California (ELPAC).

    On chronic absenteeism and English learner progress, the state’s status was yellow, a midway point between blue and red. The state’s status was orange — the second-worst status — for its suspension rate, graduation rate and performance on standardized tests for mathematics and English language arts.

    State officials said the results demonstrate California schools are making progress in the wake of the pandemic, which witnessed sharp declines in standardized test scores and a surge in chronic absenteeism.

    “Recovery from the pandemic has been a long process all across the country,” said California State Board of Education President Linda Darling-Hammond, in a statement. “While we have a long way to go, these results show that California is making strides, especially in enabling students to get to school and graduate ready for college and careers.”

    The rate of students graduating from high school who met the minimum course requirements to attend a CSU or UC reached an all-time high: 45.15%. That number has continued to steadily increase throughout the pandemic, up from 41.24% in 2016-17.

    The statewide four-year graduation rate is 86.2%, a decline from last year’s all-time high of 87%. State officials attribute 2021-22’s peak to a loosening of state graduation requirements and grading policies at the height of the pandemic. Officials say this most recent dip is due to a return to pre-pandemic policies.

    The dashboard’s color coding system takes into account both whether a metric is high or low, and also whether that metric has declined, maintained or improved within the past year.

    For instance, the orange ratings for math and English language arts test scores reflect the fact that after huge dips from pre-pandemic scores, there was little change from the previous year’s scores. Math scores edged up 2.6 points and English scores dipped 1.4 points. 

    The state’s chronic absentee rate in 2022-23 was 24.3%. That means nearly a quarter of students missed 10 or more days of school that year. That is a 5.7 point dip from the previous year’s all-time high of 30%. However, it is still a historically poor rate, roughly double the 2018-19 rate of 12.1%. Chronic absentee rates were above 20%, the worst category, in 62% of districts.

    Data shows that chronic absenteeism surged nationwide in the wake of the pandemic, and it hit nearly every school district. Experts have said that sick days from Covid and quarantining can account for part but not all of the rapidly increasing absentee rates. The CDE trumpeted the state’s declining chronic absenteeism rate.

    “This is encouraging news, and our work is not complete,” said Superintendent Tony Thurmond, in a statement. “We have made an unprecedented investment in services that address the needs of the whole child. We can see that those efforts are paying off, but this is only the beginning.”

    But some questioned whether the dashboard’s metrics provide a meaningful portrait of progress in the state.

    The dashboard was created before the pandemic when there were a different set of assumptions about what progress would look like in schools, said Heather Hough, executive director of PACE, a Stanford-based education research organization. Metrics didn’t tend to surge or nosedive year to year before the pandemic. Improvement on metrics like chronic absenteeism or standardized test scores are worth noting, she said, but the dashboard’s focus on one year of change can be misleading.

    “That can mask the concern that we should still be having: A lot of students are far behind where they have been, and large portions of students are not attending school,” Hough said.

    The color coding system has implications for which schools are eligible for additional assistance. Skyrocketing chronic absenteeism rates were largely responsible for a surge in schools that were eligible for differentiated assistance. In 2019, 333 school districts were eligible but by 2022 that number shot up to 617. This year 466 school districts were eligible.

    Advocates for English learners also worry that the way that the dashboard presents metrics is downplaying an urgent issue in education.

    The dashboard shows that about half (48.7%) of English learners in the state advanced at least one level or remained at the top level of English language proficiency, based on their scores on the ELPAC, a test English learners are required to take every year until they reach proficiency. This is about the same number who progressed as last year.

    CDE considers this to be a yellow score — a medium number of students making progress toward English proficiency, and not much change in how many did so. In order to reach green, the number of students making progress toward English proficiency would have to increase by 2 percentage points.

    Martha Hernandez, executive director of Californians Together, an organization that advocates for English learners statewide, said fewer than 50% of English learners making progress each year should be considered very low, or red, rather than medium, or yellow.

    “That seems to be a passing score, so to speak, and really doesn’t create the sense of urgency to really focus on the needs of English learners,” Hernandez said. “We really think the state has low expectations for districts having students make progress.”

    Hernandez said if students advance one level each year, they would achieve proficiency in six years, which is a reasonable expectation based on research. When students take longer than six years to achieve proficiency, they are considered long-term English learners and can struggle in middle and high school.

    Californians Together has advocated for the state to change indicators for English learner progress. The group believes that districts or schools should receive a high, or green, level of progress if at least 70% of English learners progress at least one level in one year. Currently, the state considers 55% of English learners progressing at least one level to be high.

    About a third of English learners (32.7%) in the state remained at one of the same lower levels of English proficiency as the year before on the test. Almost one fifth (18.6%) decreased one level in English proficiency.

    Districts achieved varied scores on English learner progress – 66 were red, 215 orange, 152 yellow, 192 green, and 43 blue.

    In addition, Californians Together criticized the fact that the dashboard rates English learners’ scores on English language arts and math tests together with the scores of students who have achieved proficiency in English in the last four years.

    “It’s a very, very weak picture of the needs of English learners,” said Shelly Spiegel-Coleman, strategic advisor for Californians Together.

    Melissa Valenzuela-Stookey, director of P-16 research at Ed Trust-West, said that the nonprofit that advocates for justice in education, is planning to dig into the data to get insight into what is happening for the state’s most marginalized students, but the initial data is concerning.

    “This data shows that the status quo for students of color is unacceptable, and we’re making alarmingly slow progress — but it also points to schools and districts that are proving that we can do better,” Valenzuela-Stookey said.


    Source link

  • College district investigating employees’ actions during union meetings on sexual violence case

    College district investigating employees’ actions during union meetings on sexual violence case


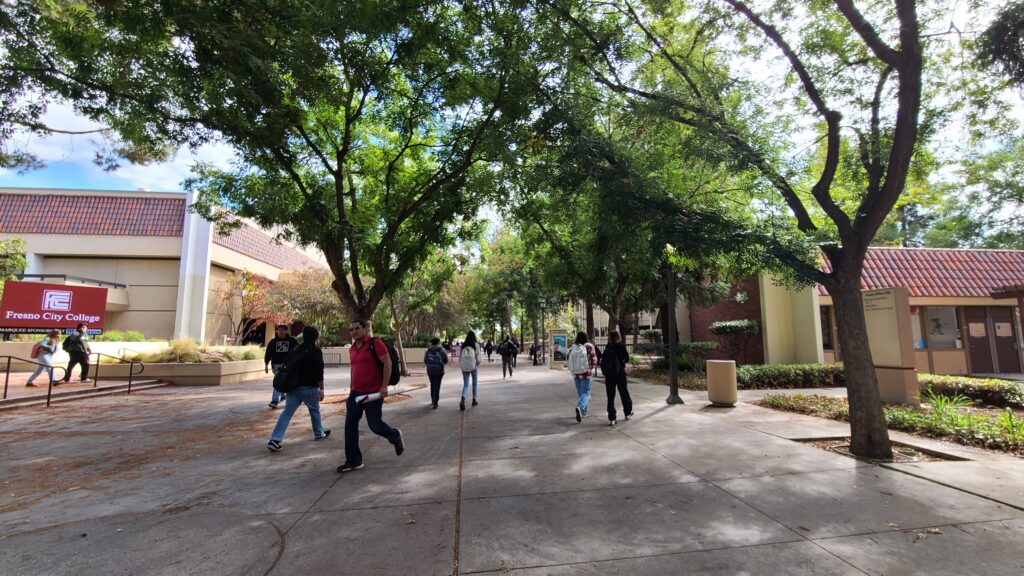
    Fresno City College on Dec. 5, 2023

    Credit: Lasherica Thornton/ EdSource

    The State Center Community College District announced late Friday that it is investigating allegations of “inappropriate behavior” by several unnamed employees who allegedly made several female employees “feel unsafe” during union meetings this month.

    The district received “several complaints” of alleged misconduct, a spokesperson, Jill Wagner, said in the statement. “We fully support survivors of violence and harassment, and we find this behavior, if confirmed, unacceptable, as it greatly impacts the faculty in our district and contributes to a toxic work environment.”

    Noting that the district “does not normally become involved in internal faculty union activities,” the statement adds that “these complaints warrant further investigation by the faculty union, especially as they impact” district employees.

    Multiple people familiar with the matter said the union meetings involved discussions about Fresno City College Academic Senate President Tom Boroujeni, whom the district placed on paid leave Nov. 30. The move came the day after EdSource reported that in 2020, a Fresno State University investigation determined that Boroujeni committed an “act of sexual violence” against a professor. The alleged victim also teaches part time at City College.

    The union met on the matter Dec. 1, with some members calling for the group’s leadership to be transparent about what it knew about Boroujeni. In an internal statement obtained by EdSource, union leadership had written, “In no way does the federation endorse or condone acts of harassment or violence in any circumstance.”  That statement, Laurie Taylor, an anthropology professor at Clovis Community College, told Edsource seemed “dismissive and placating,” adding “more could have been said.” 

    Keith Ford, president of the union, the State Center Federation of Teachers, did not immediately respond to a request for comment Friday. Nor did members of the union’s executive committee.

    The district’s Friday statement also called for the union to investigate the alleged misconduct. 

    Wagner did not respond to a request for an interview Friday with Chancellor Carole Goldsmith.

    The statement said that complaints brought to the district involve allegations of behavior that “greatly impacts the faculty.” 

    The day after the EdSource report on the Fresno State sexual violence, three female city college instructors abruptly canceled class, telling EdSource they felt unsafe on campus. The cancelations came as students were preparing for final exams and contributed to the district’s decision to place Boroujeni on paid leave. 

    The district’s action against Boroujeni, 38, of Clovis, a communication instructor also known as Farrokh Eizadiboroujeni and Tom Eizadi, was the subject of heated union discussions, according to people familiar with them. Some members defended Boroujeni, who is also being investigated over what he told EdSource were complaints of three women for what he defined as “gender discrimination.”

    In an interview with EdSource in October, Boroujeni identified one of the complainants as Cyndie Luna, dean of the college’s Fine, Performing and Communication Arts Division. Separately, Luna issued a letter of reprimand to Boroujeni last year that criticized him for incidents of unprofessional conduct which were “becoming more frequent and aggressive” and “causing me grave concern as your supervisor.” 

    Luna also wrote that in a conversation with her, Boroujeni referred to a colleague with an apparent racial slur and, in a “menacing and threatening” tone, said he “will get” the colleague for gossiping about him. 

    Boroujeni told EdSource that Luna fabricated the accusations in the letter. “She makes up a lot of things,” he said. Boroujeni also claimed to EdSource that the professor against whom Fresno State determined he committed “an act of sexual violence” fabricated the allegations against him. 

    He also complained that Luna was criticizing him for actions he took as academic senate president, a position in which he said he was immune from her oversight.

    At a SCCCD board of trustees meeting Tuesday in Fresno, the president of the academic senate at Clovis Community College said Ford had supported at a union meeting that Boroujeni was being punished.

    “Our union president helped to create and perpetuate a narrative that a specific harasser was being targeted by the administration because of his work on the academic senate,” Teresa Mendes, an English instructor, said at the meeting without mentioning Boroujeni by name. 

    “This was a false narrative,” Mendes said, “and I blatantly reject the characterization that those who participate in participatory governance are targeted or reprimanded for their work.”

    The “system has to be changed so that there is no safe harbor in (the district) for those who commit sexual assault and harassment,” she said, and no “safe harbor in our unions” for people who “harbor misogynistic and discriminatory thoughts against other faculty, staff and students.”

    Trustees and district officials did not respond to Mendes. Neither Boroujeni nor Ford was present in person at the meeting. It is unclear if either participated electronically. 

    Stetler Brown, an alumnus of the college district, ripped the district via Zoom on Tuesday. “The system is designed to protect educators that have been found (to have made) credible racist threats, misogyny and sexual violence,” he said.

    Without mentioning Boroujeni by name, Brown stated that tenure granted by SCCCD gives employees “a job as long as they desire.” Boroujeni received tenure this year. He told EdSource that district officials knew of the Fresno State sexual violence case when he was tenured. 

    ”Tuition and taxpayer dollars will protect predators, and that nobody will take responsibility for this individual’s tenure and promotion,” Brown said. “It is no wonder public support for higher education is waning. I hope that this serves as a call to the leadership of this district to make changes that protect survivors and show students that they stand for justice.”

    The district’s investigation of misconduct at the union meetings comes as the bargaining unit is choosing its leaders. Ford, a Fresno City College English instructor, is seeking another term as union president. He faces at least one challenger — Madera Community College business instructor Gina Vagnino, in an election scheduled for Jan. 16. It was not immediately clear Friday if there are other challengers.

    Vagnino confirmed she is a candidate but did not respond to multiple questions from EdSource about whether she is running specifically because of the disagreements within the union over the Boroujeni matter.

    The Fresno State investigation, based on the federal anti-discrimination law known as Title IX, determined that Boroujeni committed the act of sexual violence in 2015, when he was a graduate student and part-time instructor at Fresno State. The case wasn’t fully resolved until February, when the alleged victim reached a $53,300 settlement with the university after claiming it hadn’t done enough to protect her, university records show.

    Boroujeni was also a part-time instructor at Fresno City College while finishing a master’s degree at Fresno State in 2015, records show.

    He resigned from Fresno State last year while facing a second, unrelated misconduct allegation that was found to be unsubstantiated, records show. He agreed to never seek or accept work in the 23-campus system again. 

    Boroujeni was never disciplined in the sexual violence matter because he was a graduate student when the alleged violence occurred. But Fresno State officials told him that the investigative report on the matter was going to be placed in his personnel file last year when he was up for a performance evaluation. He said he resigned so that a three-person committee reviewing him could not have access to the document.

    Fresno State released a redacted copy of the report to EdSource under the state’s Public Records Act. “Given that Mr. Boroujeni remains active in the educational community and is teaching at a local community college, there is strong public interest in knowing that a college instructor has been previously found to have committed an act of sexual violence at another university,” the report stated.


    Source link