Thomas Friedman writes a regular column for The New York Times. This one is unusually perspicacious. I was deeply moved by its candor. And I agree with him. Trump and his enablers are turning the Presidency into a monarchy, giving him more power than any President ever had and more power than the Founders imagined. Checks and balances have been wiped out. The Supreme Court’s rightwing majority approves of all his power grabs. He is imposing heavy fines on universities without regard to basic principles of academic freedom. He has made it criminal to support policies that advance diversity, equity, and inclusion. He is waging war on science. He is forcing the news media to pay him tribute. He fires veteran data scientists unless they report good news.
In his first term, his most notable achievement was the funding of “Operation Warp Speed,” which invested in the rapid production of mNRA vaccines. These vaccines dramatically reduced COVID, which killed one million people in the U.S. Yet just days ago, Trump’s Health Secretary Robert F. Kennedy Jr. cancelled $500 million in research grants for mNRA vaccines. RFK killed further development of Trump’s greatest triumph. When asked about it at a press conference, Trump took pride in what RFK was doing. Did he understand the question?
His actions are unprecedented. They are the actions of a dictator.
He writes:
Of all the terrible things Donald Trump has said and done as president, the most dangerous one just happened on Friday. Trump, in effect, ordered our trusted and independent government office of economic statistics to become as big a liar as he is.
He fired Erika McEntarfer, the Senate-confirmed head of the Bureau of Labor Statistics, for bringing him economic news he did not like, and in the hours immediately following, the second most dangerous thing happened: The senior Trump officials most responsible for running our economy — people who in their private businesses never would have contemplated firing a subordinate who brought them financial data they did not like — all went along for the ride.
What they should have said to Trump is this: “Mr. President, if you don’t reconsider this decision — if you fire the top labor bureau statistician because she brought you bad economic news — how will anyone in the future trust that office when it issues good news?” Instead, they immediately covered for him.
As The Wall Street Journal pointed out, Labor Secretary Lori Chavez-DeRemer had actually gone on Bloomberg TV early Friday and declared that even though the jobs report that had just been released was revised downward for May and June, “we’ve seen positive job growth.” But as soon as she got the news hours later that Trump had fired the very B.L.S. director who reports to her, she wrote on X: “I agree wholeheartedly with @POTUS that our jobs numbers must be fair, accurate, and never manipulated for political purposes.”
As The Journal asked: “So were the jobs data that were ‘positive’ in the morning rigged by the afternoon?” Of course not.
The moment I heard what Trump had done, I had a flashback. It was January 2021, and it had just been reported that Trump, after losing the 2020 election, had tried to pressure Georgia’s Republican secretary of state to “find” him enough votes — exactly 11,780, Trump said — to overturn the presidential election and even threatened him with “a criminal offense” if he didn’t. The pressure came during an hourlong telephone call, according to an audio recording of the conversation.
The difference, though, is that back then there was something called a Republican official with integrity. And so Georgia’s secretary of state did not agree to fabricate votes that did not exist. But that species of Republican official seems to have gone completely extinct in Trump’s second term. So Trump’s rotten character is now a problem for our whole economy.
Going forward, how many government bureaucrats are going to dare to pass along bad news when they know that their bosses — people like Treasury Secretary Scott Bessent; the director of the National Economic Council, Kevin Hassett; Labor Secretary Chavez-DeRemer; and the U.S. trade representative, Jamieson Greer — will not only fail to defend them but will actually offer them up as a sacrifice to Trump to keep their jobs?
Shame on each and every one of them — particularly on Bessent, a former hedge fund manager, who knows better and did not step in. What a coward. As Bessent’s predecessor, Janet Yellen, the former Treasury secretary and also the former chair of the Federal Reserve — and a person with actual integrity — told my Times colleague Ben Casselman of the B.L.S. firing: “This is the kind of thing you would only expect to see in a banana republic.”
It is important to know how foreigners are looking at this. Bill Blain, a London-based bond trader who publishes a newsletter popular among market experts called Blain’s Morning Porridge, wrote on Monday: “Friday, Aug. 1 might go down in history as the day the U.S. Treasury market died. There was an art to reading U.S. data. It relied on trust. Now that is broken — if you can’t trust the data, what can you trust?”
He then went on to imagine how his Porridge newsletter will sound in May 2031. It will begin, he wrote, with “a link to a release from Trump’s Ministry of Economic Truth, formerly the U.S. Treasury: ‘Under the leadership of President Trump, the U.S. economy continues to grow at record speed. Payrolls data from the Ministry of Truth, a subsidiary of Truth Social, show full employment across America. Tensions in the inner cities have never been so low. All recent graduates have found highly paid jobs across America’s expanding manufacturing sector, causing many large companies in Trump Inc to report significant labor shortages.’”
If you think this is far-fetched, you clearly have not been following the foreign policy news, because this kind of tactic — the tailoring of information to fit Trump’s political needs — has already been deployed in the intelligence field.
In May the director of national intelligence, Tulsi Gabbard, fired two top intelligence officials who oversaw an assessment that contradicted Trump’s assertions that the gang Tren de Aragua was operating under the direction of the Venezuelan regime. Their assessment undermined the dubious legal rationale Trump invoked — the rarely used 1798 Alien Enemies Act — to allow the suspected gang members to be thrown out of the country without due process.
And now this trend toward self-blinding is spreading to further corners of the government.
One of America’s premier cyberwarriors, Jen Easterly, who was the director of the Cybersecurity and Infrastructure Security Agency during the Biden administration, had her appointment to a senior teaching position at the U.S. Military Academy at West Point revoked last week by Army Secretary Daniel Driscoll after Laura Loomer, a far-right conspiracy theorist, posted that Easterly was a Biden-era mole.
Read that sentence again very slowly. The Army secretary, acting on the guidance of a loony Trump acolyte, revoked the teaching appointment of — anyone will tell you — one of America’s most skilled nonpartisan cyberwarriors, herself a graduate of West Point.
And when you are done reading that, read Easterly’s response on LinkedIn: “As a lifelong independent, I’ve served our nation in peacetime and combat under Republican and Democratic administrations. I’ve led missions at home and abroad to protect all Americans from vicious terrorists …. I’ve worked my entire career not as a partisan, but as a patriot — not in pursuit of power, but in service to the country I love and in loyalty to the Constitution I swore to protect and defend, against all enemies.”
And then she added this advice to the young West Pointers she will not have the honor of teaching: “Every member of the Long Gray Line knows the Cadet Prayer. It asks that we ‘choose the harder right instead of the easier wrong.’ That line — so simple, yet so powerful — has been my North Star for more than three decades. In boardrooms and war rooms. In quiet moments of doubt and in public acts of leadership. The harder right is never easy. That’s the whole point.”
That is the woman Trump did not want teaching our next generation of fighters.
And that ethic — always choose the harder right instead of the easier wrong — is the ethic that Bessent, Hassett, Chavez-DeRemer and Greer know nothing of — not to mention Trump himself.
That is why, dear reader, though I am a congenital optimist, for the first time I believe that if the behavior that this administration has exhibited in just its first six months continues and is amplified for its full four years, the America you know will be gone. And I don’t know how we will get it back.
Dan Rather is a veteran of CBS News. He was understandably upset by the CBS payoff of $16 million to Trump in exchange for getting him to drop his $20 billion lawsuit against the network and “60 Minutes” for editing a tape of Kamala Harris during the 2024 campaign. It was a frivolous lawsuit, which Trump was likely to lose, but CBS chose to placate him because it needed FCC approval of a sale to Paramount for $8 billion. The Federal Conmunications Commission is headed by Trump ally, Brendan Carr, and is completely politicized, at the service of The Donald.
Dan Rather takes strong exception to CBS’s agreement to accept a “bias monitor” who reports to Trump. Be it noted that Columbia University also agreed to a “bias monitor” along with its $200 million payoff. Brown University agreed to accept Trump’s definition of gender, which means transgender does not exist at Brown.
Rather wrote:
As bad as it is that CBS’s parent company was extorted by Donald Trump for $16 million, that wasn’t the worst of it.
In the final merger deal, New Paramount has agreed to appoint a “bias monitor” who will report directly to Donald Trump, says the chairman of the Federal Communications Commission (FCC). This person will work with the company’s new president to review “any complaints of bias or other concerns.” In other words, Paramount is installing a censor at CBS News with a direct line to the president.
One would think that if a bias monitor is called for, there has been evidence of blatant bias. By definition, bias is unfair prejudice in favoring one side over the other. The far-right defines it as any story they don’t like.
Let’s be clear: By any sane or objective measure, CBS News is not a biased organization, no matter what the president and his FCC chair would have you think.
In addition to hiring a bias monitor, Paramount has promised that “news and entertainment programming embodies a diversity of viewpoints across the political and ideological spectrum,” while also eliminating all diversity, equity, and inclusion initiatives. Hard to do both, unless what you really mean is embodying only “conservative” (read: Trump’s) viewpoints.
CBS has a history of mega-wealthy owners, but no one as rich as Oracle founder Larry Ellison and his son David, whose estimated net worth is $300 billion. Both Ellisons are tight with Trump.
One wonders how deep will this go? Does “60 Minutes” now submit scripts for approval by a Trump toady? What about “The CBS Evening News?” Will its reporters have to give equal time to disinformation? And what will be the effect on other news outlets? The intended outcome is to foster fear.
Insiders at CBS already have a term for the censor: “hall monitor.” The credibility of the news organization that was my home for more than 40 years is suddenly threatened because of a bogus lawsuit and an FCC that is supposed to be independent but clearly is not. Donald Trump might as well be CEO of CBS.
We are now on the slipperiest of slopes. Who will be next? Trump could certainly make similar demands of other news organizations. The White House communications team is doing its damnedest to curve coverage to embellish their boss through lies, intimidation, and extortion.
Despite the questionable characterizations from the White House, not every story is left versus right. Most actually deal with the truth, or as near as journalists can get to the truth, versus what Trump & Co. want you to believe is the truth. They have a 10-year history of bald-faced lying.
According to The Washington Post, which tracked Trump’s (lack of) truthfulness during his first term, he lied an average of 21 times a day for four years, totalling 30,573 false or misleading claims. Respected historian David Brinkley called him a “serial liar.”
The argument that CBS and other legacy media outlets have a left-leaning bias and therefore need monitoring falls apart quickly when you realize the far-right doesn’t want unbiased reporting. They want Trump’s version of the story and his version of the truth. To them, it simply can’t be negative and true. If it goes against their agenda, it’s biased.
After all, it was Trump adviser Kellyanne Conway who coined the term “alternate facts.” That is just doublespeak for lies. The network of “alternative facts,” Fox “News,” was formed to combat perceived bias. We all know Fox “News” hits it right down the middle.
Trump supporters point to Americans’ declining trust in the news media as a reason for the need for his administration’s “monitoring” of the mass media. Clearly what they intend is not monitoring but censorship, led by a man who eschews the truth and whose constant spewing of propaganda has been a factor in the loss of trust in the media.
They are led by the most transparently thin-skinned person imaginable. In the space of a week, the prickly president has officially lashed out at several entertainment programs that have had the temerity to make fun of him.
When Joy Behar of the morning talk show “The View” joked that Trump was jealous of President Obama’s swagger, a White House spokesperson told Entertainment Weekly, “Joy Behar is an irrelevant loser suffering from a severe case of Trump Derangement Syndrome” who “should self-reflect on her own jealousy of President Trump’s historic popularity before her show is the next to be pulled off air.”
After the animated series “South Park” aired an episode that depicted a naked Trump hanging out with the devil, the White House said “no fourth-rate show can derail President Trump’s hot streak.” Meanwhile the creators of the cartoon just inked a $1.5 billion, five-year deal with Paramount. Yes, that Paramount. One wonders if the bias monitor will be script doctoring new “South Park” shows.
This comes after the questionably timed cancellation of “The Late Show,” whose host, Stephen Colbert, is an ardent critic of the president and the most popular host on late-night television.
Everyone interprets the world through their own prism. People are influenced by where they grew up, what their parents taught them, where they went to school, and the beliefs of the people they respect. Journalists included.
Journalists sometimes make mistakes. But the media is not a monolith driven by a collective desire to elect Democrats. The vast majority of people I worked with throughout my career were dedicated journalists, rock-solid reporters. They believed in objectivity and curiosity and in questioning authority and standing up to power, regardless of whom they voted for.
As details of the new deal at CBS News remind us, the need for independent journalism has never been greater — journalism that doesn’t need sign-off from a censor.
The good people and proven professionals of CBS News will do their best under their new circumstances. But they, and the rest of us, are left to ponder where this all leads.
Jennifer Frey served as Dean of the University of Tulsa’s Honors College. It required students to read deeply in classic tests and to converse vigorously with each other.
More than a quarter of the student body signed up for this rigorous class.
Yet two years after the Honor College opened, it was closed. Its leadrs said that students didn’t want this kind of education, the heavy focus on the liberal arts and the Great Cobversation about the meaning of truth goodness, and beauty. Dean Frey thinks the administrators were wrong.
University students, we’re told, are in crisis. Even at our most elite institutions, they have emaciated attention spans. They can’t — or just won’t — read books. They use artificial intelligence to write their essays. They lack resilience and are beset by mentalhealthcrises. They complain that they can’t speak their minds, hobbled by an oppressive ideological monoculture and censorship regimes. As a philosopher, I am most distressed by reports that students have no appetite to study the traditional liberal arts; they understand their coursework only as a step toward specific careers.
Over the past two years as the inaugural dean of the University of Tulsa’s Honors College, focused on studying the classic texts of the Western tradition, I’ve seen little evidence of these trends. The curriculum I helped build and teach required students to read thousands of pages of difficult material every semester, decipher historical texts across disciplines and genres and debate ideas vigorously and civilly in small, Socratic seminars. It was tremendously popular among students, who not only do the reading but also engage in rigorous and lively conversations across deep differences in seminars, hallways and dorms. For the past two years, we attracted over a quarter of each freshman class to this reading-heavy, humanities-focused curriculum.
Our success in Tulsa derives from our old-fashioned approach to liberal learning, which does not attempt to prepare students for any career but equips them to fashion meaningful and deeply fulfilling lives. This classical model of education, found in the work of both Plato and Aristotle, asks students to seek to discover what is true, good and beautiful, and to understand why. It is a truly liberating education because it requires deep and sustained reflection about the ultimate questions of human life. The goal is to achieve a modicum of self-knowledge and wisdom about our own humanity. It certainly captured the hearts and minds of our students.
Sadly, this education has fared less well with my university’s new administration. After the former president and provost departed this year, the newly installed provost informed me that the Honors College must “go in a different direction.” That meant eliminating the entire dean’s office and associated staff positions as well as many of our distinctive programs and — through increased class sizes — effectively ending our small seminars. (A representative of the university told The Times that while it had “restructured” the Honors College, the university believes that academics and student experiences will “remain the same.”)
The stated reason for these cuts was to save money — the same reason the University of Tulsa gave in 2019 when it targeted many of the same traditional forms of liberal learning for elimination. Back then, the administration attempted to turn the university into a vocational school. Those efforts largely failed, in part because of lack of student support for the new model.
Sign up for the Opinion Today newsletter Get expert analysis of the news and a guide to the big ideas shaping the world every weekday morning. Get it sent to your inbox.
An unpleasant truth has emerged in Tulsa over the years. It’s not that traditional liberal learning is out of step with student demand. Instead, it’s out of step with the priorities, values and desires of a powerful board of trustees with no apparent commitment to liberal education, and an administrative class that won’t fight for the liberal arts even when it attracts both students and major financial gifts. The tragedy of the contemporary academy is that even when traditional liberal learning clearly wins with students and donors, it loses with those in power.
For those who do care to see liberal learning thrive on our campuses, the work my colleagues and I did at Tulsa should be a model. How did we do it? We created an intentional community where our students lived in the same dorm and studied the same texts. We shared wisdom, virtue and friendship as our goals. When a university education is truly rooted in the liberal arts, it can cultivate the interior habits of freedom that young people need to live well. Material success alone cannot help a person who lacks the ability to form a clear, informed vision of what is true, good and beautiful. But this vision is something our students both want and need.
At Tulsa, we invited our students to enter “the great conversation” with some of the most influential thinkers of our inherited intellectual tradition. For their first two years they encountered a set curriculum of texts from Homer to Hannah Arendt. These texts were carefully chosen by an interdisciplinary faculty because they transcend their time and place in two senses: They influenced a broader tradition, and they had the potential to help our students reflect in a sustained way on what it means to be a good human being and citizen. Our seminars were led by faculty members who did not lecture or use secondary sources. Rather, the role of the faculty members was to foster and guide conversations among our students that allowed them to think through these questions for and among themselves.
That our students threw themselves into the task of reading and discussing the great works with one another should not shock. When we — students and teachers alike — share wisdom as a common goal, we will want to do the reading, to dispute one another, to exchange ideas and arguments, to propose amendments and to offer our personal insights. Liberal learning occurs in dialogue with those who object to us, who offer a different perspective or experience — who read the same book as we do in a completely different light.
At the Honors College, we taught our students that wisdom is a distant goal, and that we need to work on ourselves as we try to approach it. We need to cultivate what our college called “the virtues of liberal learning.” For example, we need to cultivate the humility to recognize that we have much to learn from the past and from one another. We need to cultivate a love of truth for its own sake and the courage to speak our minds and to follow the truth wherever it may lead us — even when it leads us into difficult waters where our disagreements are deep and unsettling.
When students realize their own humanity is at stake in their education, they are deeply invested in it. The problem with liberal education in today’s academy does not lie with our students. The real threat to liberal learning is from an administrative class that is content to offer students far less than their own humanity calls for — and deserves.
Jennifer Berkshire is a veteran education journalist who understands the importance of public schools. She has a podcast called “Have You Heard?” She is the co-author of two books with historian Jack Schneider:
A Wolf at the Schoolhouse Door: The Dismantling of Public Education and the Future of School. And: The Education Wars: A Citizen’s Guide and Defense Manual.
Berkshire wrote the following brilliant article about the failure of the Democratic Party to recognize that most people send their children to public schools and don’t want them to be privatized. Some prominent Democrats support charter schools, which the radical right has used as a stepping stone to vouchers.
She wrote on her Substack blog “The Education Wars”:
And just like that, the Trump Administration has released the billions in funds for public schools it had suddenly, and illegally, frozen earlier this summer. The administration’s trademark combo of chaos and cruelty has been stemmed, at least temporarily. That Trump caved on this is notable in part because his hand was forced by his own party—the first time this has happened in the endless six months since his second term began. Make that the second time. Since I posted this piece, key senators from both parties decisively rejected the administration’s proposals to slash investments in K-12. Which raises an obvious question: of all of the unpopular policies being rolled out by the administration why would school funding be the one that forced a retreat?
“Do they really care more about public schools than about…Medicaid?” is how historian Adam Laats posed the question. In a word, yes. That’s because Medicaid is a program utilized by poor people, a constituency that however vast enjoys neither a forceful lobby nor the patronage of a friendly billionaire. Public education, despite the increasingly aggressive efforts to dismantle it, remains one of our only remaining institutions that serves rich and poor alike. (For an excellent and highly readable history of how this came to be, check out Democracy’s Schools: the Rise of Public Education in America by historian Johann Neem.)
This enduring cross-class alliance behind public schools, by the way, is a big part of why public education has been in the cross hairs of anti-tax zealots for so long. It’s also why school voucher programs keeps accidentally benefiting the most affluent families. Offering them a coupon for private school tuition is a nifty way to drive a stake through, not just this cross-class coalition that consistently supports things like more school funding and higher teacher pay, but the entire project of public education.
A winning issue
As David Pepper pointed out recently, the Trump Administration was forced to back down on school funding because of the bipartisan nature of support for public schools—part of what he calls a “clear and consistent pattern” that we’ve witnessed again and again in recent years.
Whether we’re talking about the overwhelming votes against vouchers in red states in November or the bottom-of-the-barrell poll numbers for the Trump education agenda, public education defies the usual logic of these hyper-partisan times. Which makes it all remarkable that so few Democrats seem to understand the potency of the issue. Whither the Democrats is a question that Pepper, one of our most astute political commentators, has been asking too:
I’m talking about an unflinching embrace of the value of public schools to kids, families and communities, and a blunt calling out of the damage being done to those schools by the reckless privatization schemes of recent years.
It’s not coincidence, I’d argue, that rising stars in the Democratic Party including Kentucky governor Andy Beshear or Texas state representative James Talarico played key roles battling vouchers in their states. And before Tim Walz was muffled by the Harris campaign, we heard him start to articulate a sort of prairie populist case for public education, in which rural schools are the centers of their communities and today’s school privatizers are the equivalent of nineteenth-century robber barrons. The master class on how Democrats should talk about education, though, comes via Talarico’s recent appearance on Joe Rogan’s podcast.
Clocking in at two hours and 44 minutes, the conversation shows why Talarico is ascendant. But it was handling of the school voucher issue that truly demonstrated his chops. He deftly explained to Rogan that Texas has essentially been captured by conservative billionaires, and that despite their deep pockets and political sway, the anti-voucher coalition had nearly won anyway.
Ultimately we didn’t win. [It] kind of came down to a photo finish, but it did to me provide a template for what happens if we actually loved our enemies, if we rebuilt these relationships. Like who could we take on if we did it together? Democrats and Republicans, conservatives and progressives. Like, I don’t know, sometimes I sound a little Pollyanna.
Rogan’s response was just as instructive. “It’s not us versus them. It’s the top versus the bottom.”
The dud brigade
Having interviewed countless Republicans who oppose vouchers over the past year, I remain utterly convinced that there is no other issue that both resonates across party lines and exposes the influences of billionaires behind school privatization. Which makes it all the more remarkable that Democrats like Talarico and Beshear remain such a minority in the party. Especially at the national level, candidates and commentators largely view public education with disdain. Indeed, as the endless battles play out over the future of the Democratic Party, we can look forward to a full-court press pressuring blue state governors to opt in to the new federal voucher program. And while the school choice lobby will be leading the charge, influential voices from within the party—like this guy or this guy—will be making the case that vouchers = ‘kids-first policy’ and that Democrats need to get on board or be left behind.
Part of what has been so refreshing about listening to Talarico, Beshear, Walz and other rising stars like Florida’s Maxwell Frost, is that they’re not just opposing school privatization but making a bold case for why we have public schools in the first place. They’re rising to the challenge that David Pepper throws down in which Democrats unflinchingly “embrace the value of public schools to kids, families and communities” and bluntly call out “the damage being done to those schools by the reckless privatization schemes of recent years.”
Now contrast that with the way that so many influential Democrats talk about education—the bloodless rhetoric of ‘achievement,’ ‘data,’ and ‘workforce preparation’ that resonates with almost no one these days. Here’s Colorado governor Jared Polis, for example, rolling out the National Governor’s Association’s Let’s Get Ready Initiative, an impossibly dreary vision of K-12 education that hinges on a “cradle-to-career coordination system that tracks how kids are doing, longitudinally, from pre-K through high school into higher education and the workforce.” If you want a bold case for why we have public schools, you won’t find it here. Deftly combining right-wing talking points (the kids are socialists!) with the same corporate pablum that centrist Democrats have been peddling for years (the skills gap!), this is a vision that is a profound mismatch for our times. I read a sentence like this one—“Competition between schools, districts and states will lead to more students being ready for whatever the future might hold”—and I die a little inside.
Back in 2023, Jacobin magazine and the Center for Working-Class Politics released a study called “Trump’s Kryptonite” about how progressives can win back the working class. Among its many interesting findings was this: the candidate best equipped to appeal to working class voters with a populist message was a middle school teacher. I’ve referenced this study endlessly in my writing and opinonating but it wasn’t until I listened to the Rogan episode with James Talarico that I really reflected on why a middle school teacher might make such an effective candidate. The exchange consists largely of Rogan peppering Talarico with the sorts of endlessly curious queries that a bright seventh grader might fire off. To which Talarico, an actual former middle school teacher, responds patiently and without condescension, largely steering clear of the sorts of policy weeds that are incomprensible to regular people.
In the coming months, we’ll be told endlessly that the future of the Democratic Party belongs to Rahm Emanuel, Cory Booker, Gina Raimondo or Jared Polis—all of whom represent the identical brand of ‘straight talk’ about the nation’s schools that Democrats have been trying—and failing—to sell to voters for decades. That same Jacobin study, by the way, found that the very worst candidates that Democrats can run are corporate executives and lawyers. I’d add one more category to this list: corporate education reformer.
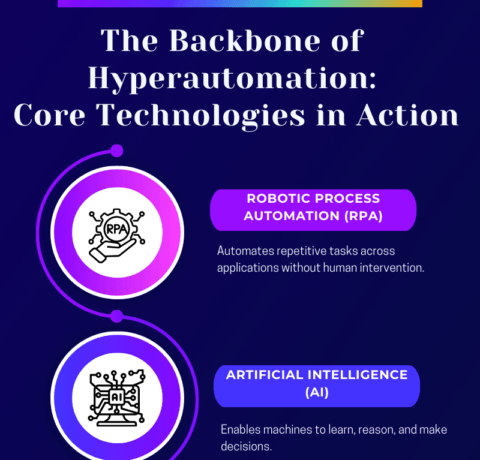
Automation Evolved: Core Technologies Driving The Future—Infographic
Hyperautomation combines advanced technologies to streamline complex business processes. It relies on Robotic Process Automation (RPA), Artificial Intelligence (AI), Machine Learning (ML), Natural Language Processing (NLP), Business Process Management (BPM), Intelligent Document Processing (IDP), and analytics to automate tasks, enhance efficiency, and promote data-driven decision-making.
Key components include RPA for automating routine tasks, AI and ML for intelligent decision-making, and NLP for facilitating human-like interactions. BPM improves workflow management, while IDP helps process unstructured data. Together, these technologies enable smart, scalable automation that enhances efficiency, reduces costs, and improves decision-making across various industries.
We have learned, over the past decade, that Trump often projects what he is doing, what he has done, or what he intends to do, on others. We have heard his nonstop claim that the 2020 election was rigged since the day it was decided. Even now, his Director of National Intelligence Tulsi Gabbard says that the 2020 election, which he won, was rigged.
There are people who suspect the 2024 election was rigged to enable Trump’s re-election. I am one of them, though I have no evidence, just a gut feeling that the American electorate would not re-elect a twice-impeached convicted felon and sexual predator who campaigned on a platform of hate, divisiveness, and lies. But that’s just me. Time and again, Trump thinks, acts, and speaks like a mobster, so why would he not cheat to win? Winning means redemption, revenge, and riches. He never accepts losing.
A side note: I was a member of a federal commission created after the debacle of the 2000 election to make recommendations for improving elections. The commission was bipartisan, chaired by former Presidents Jimmy Carter and Gerald Ford. One of our recommendations was that the federal government should pay the cost of replacing existing voting machines with electronic touch screens. We made this recommendation after reviewing all existing and proposed machines.
Interestingly, the most accurate voting machine tested in 2001 was the one in New York City, known as a mechanical lever machine. The voter enters an enclosed space, closes a curtain behind her, pulls individual little levers for the preferred candidates, then records the vote by pulling a large lever that also opens the curtain, and exits. Every vote is cleanly and correctly registered on paper. That machine had 100% accuracy but it was considered antiquated. It was likened to an old-fashioned cash register that would soon be replaced by touch-screen technology.
Congress adopted some of our commission’s recommendations, including the purchase of touch-screen technology and allocated $350 million to states that agreed to buy the new machines.
Some members of the commission–including me– were concerned about the possibility of hacking. Hackers had demonstrated that there were no electronic machines, no matter how sophisticated, that were secure. But our doubts were dismissed. There was no reversing the inevitable march of progress.
In response to Christian nationalists, states are passing laws to require the posting of The Ten Commandments in classrooms, to allow public money to be spent in religious schools, to eviscerate separation of church and state, and to hire religious leaders to act as guidance counselors in public schools.
Separation of church and state has been an honored tradition in American life and law for generations. That separation protects the churches by freeing them from state oversight; it also protects the state by preventing religious zealots from interfering in the workings of government.
We are a nation of many religions. Freedom of religion is best protected by keeping the hands of the state far from all religious groups and to prevent religious groups from exercising state power.
Yet here come the Christian nationalists, eager to assert their control over the entire nation, over Catholic Churches, over Muslim mosques, over Jewish synagogues, over the many and diverse religions of our nation, as well as all those who are affiliated with no religion. .
The Constitution does not say that the U.S. is a Christian nation. It says in the First Amendment that there must be freedom of religion for all and that Congress must pass no laws establishing a state religion. The Constitution also says that there must be no religious test for those who hold public office.
If the Founders wanted the U.S. to be a Christian nation, they would have said so. They didn’t.
But we live in a New Age, one where Christian Nationalists are front and center.
Ultican writes:
Since 2024, Louisiana, Arkansas and Texas have passed laws requiring ten commandment posters in all classrooms. These kinds of laws come to us courtesy of a single Christian “bill mill,” Project Blitz. Dozens of other state bills in fidelity with Project Blitz’s proposed legislation were also passed. In 2021, they distributed 74 pieces of model legislation of which 14 passed into law including “Parental Review and Consent for Sex Education” and “Religious Freedom Day” promoting Mark Keierleber, reporting for The 74, wrote, “Among the architects of Project Blitz is the Barton-founded influence machine, WallBuilders.”
The WallBuilders home page claims to be, “Helping Americans Remember and Preserve the True History of Our Great Nation …” Unfortunately; it is in reality a propaganda site posting lies about American history in order to advance a Christian Nationalist agenda. Texas preacher and amateur historian, David Barton, founded WallBuilders and has become the most quoted man in the realm of Christian Nationalism. The organization’s name is an Old Testament reference to rebuilding the walls of Jerusalem.
The Speaker of the House, Mike Johnson, told an audience at the ProFamily Legislators Conference, which was being hosted by WallBuilders, Barton’s teachings have had “a profound influence on me, and my work, and my life and everything I do.” It is widely held that the Speaker is a Christian Nationalist. President Trump has cultivated their support. In March, he hosted David Barton in the oval office.
David Barton and Trump in the Oval Office this March
David Barton
Barton was born in Fort Worth, Texas. When he completed junior high, his family moved to the small Texas town of Aledo about 40 miles west of Fort Worth. After graduating third in his high school class, he attended Oral Roberts University, the evangelical Christian college in Tulsa, Oklahoma. Barton came to Oral Roberts on a math and science scholarship but ended up with a degree in religious education.
His parents started a Bible study group in Aledo which became a fundamentalist church and a K-12 school. David taught math and science, coached basketball, and became the school’s principal.
Barton became an amateur historian. In her first book, The Good News Club, Katherine Stewart claimed, “Pseudo-historian David Barton—a Texas-based darling of the Religious Right and founder of the Christian Nationalist organizations WallBuilders and the Black Robe Regiment—seems to have no problem fictionalizing the history.” (Page 67)
H“In a broader sense, Barton’s work is reminiscent of nineteenth-century historians like Charles Coffin and Parson Weems, scholars who wrote from an unabashedly Christian perspective at a time when there was no culture of objectivity among historians. Weems was best known for his biography of George Washington, in which he did his best to claim Washington for the Christians, despite his well-known reputation as a Deist. In a brief, credulous treatise called The Bulletproof George Washington, Barton resurrected an old Weems-era tale about the supposed divine protection of Washington during the French and Indian War.”
Nate Blakeslee in an article for the Texas Monthly observed:
“The historical errors and obfuscations tumbled out of Barton’s works fast and furious. Intent on demonstrating that the American republic was founded on ‘Judeo-Christian principles,’ Barton reproduced and alleged quote from James Madison to the effect that the Ten Commandments are the foundation of American civilization. Chuck Norris, Rush Limbaugh, Duck Dynasty star Phil Robertson, and countless other luminaries of the right recycled the quote in so many iterations that it has become a fixture of Christian nationalist ideology. Yet there is no evidence that Madison ever said such a thing.” (Page 133)
An NPR article from 2012 provides a good example of what Blakeslee and Stewart are writing about. While most of us learned that the Constitution was a secular document, Barton disagrees and says it is laced with biblical quotations:
‘“You look at Article 3, Section 1, the treason clause,’ he told James Robison on Trinity Broadcast Network. ‘Direct quote out of the Bible. You look at Article 2, the quote on the president has to be a native born? That is Deuteronomy 17:15, verbatim. I mean, it drives the secularists nuts because the Bible’s all over it! Now we as Christians don’t tend to recognize that. We think it’s a secular document; we’ve bought into their lies. It’s not.”
“We looked up every citation Barton said was from the Bible, but not one of them checked out. Moreover, the Constitution as written in 1787 has no mention of God or religion except to prohibit a religious test for office.”
The 1792 Aitken Bible was the first Bible ever printed in the USA. Barton claims it was published and paid for by Congress. This was another one of his proofs that the United States was founded on Christian principles. The bible was not published by congress; it was published and paid for by printer Robert Aitken. At the time, there was an embargo on biblesfrom England. Responding to Aitken’s request, Congress agreed to have its chaplains check the Bible for accuracy.
From 1997 to 2006, Barton was vice chairman of the Texas Republican Party.
Barton Speaking at a 2016 Cruz Rally in Henderson, Nevada
The Henderson rally was hosted by Keep the Promise PAC which Barton was running. Besides Cruz, he was also joined on stage by Christian Nationalist pundit Glenn Beck. Barton maintains a relative low profile but his influence is massive.
The Christian Nationalists have a level of power in the Republican Party that is shocking.
Last week, the Bureau of Labor Statistics reported the number of new jobs created in the past month–73,000. The BLS lowered its estimates of new jobs created in the previous two months by 258,000.
Total nonfarm payroll employment changed little in July (+73,000) and has shown little change since April, the U.S. Bureau of Labor Statistics (BLS) reported today. The unemployment rate, at 4.2 percent, also changed little in July. Employment continued to trend up in health care and in social assistance. Federal government continued to lose jobs...
Revisions for May and June were larger than normal. The change in total nonfarm payroll employment for May was revised down by 125,000, from +144,000 to +19,000, and the change for June was revised down by 133,000, from +147,000 to +14,000. With these revisions, employment in May and June combined is 258,000 lower than previously reported. (Monthly revisions result from additional reports received from businesses and government agencies since the last published estimates and from the recalculation of seasonal factors.)
Trump was furious. The revisions meant that the labor force grew not by 291,000 new jobs, but by only 33,000 jobs. He insisted that the numbers were “rigged,” and he announced that they had been rigged for political reasons, to make him look bad. He fired the Commissioner of the Bureau of Labor Statistics, Erika McEntarfer, accusing her of chicanery. She had worked for the BLS for 20 years.
The message that was sent to all agencies was that Trump wants only good news. Numerous commentators wondered if any government data could be trusted during Trump’s tenure.
Gene Sperling posted this tweet. Sperling was a senior economic advisor to both President Clinton and President Obama.
@GenebSperling:
For anyone who spends even a split second taking even 1% of the Administration’s explanation for firing the BLS commissioner seriously, read the words of Bill Beach, the former Trump-appointed BLS commissioner:
“These numbers are constructed by hundreds of people. They’re finalized by about 40 people. These 40 people are very professional people who have served under Republicans and Democrats.
And the commissioner does not see these numbers until the Wednesday prior to the release on Friday. By that time, the numbers are completely set into the IT system. They have been programmed. They are simply reported to the commissioner, so the commissioner can on Thursday brief the president’s economic team.
The commissioner doesn’t have any hand or any influence or any way of even knowing the data until they’re completely done. That’s true of the unemployment rate. That’s true of the jobs numbers.”
I was going to post this but then I saw this brilliant article in The New York Times by Peter Baker, the Times‘ chief White House correspondent. He put Trump’s latest effort to control the jobs data into a broad perspective. Trump wants to control the news, the arts and culture, and history. He is a deeply insecure man. He wants the world to believe that he’s the most amazing person who ever lived and superior to all past presidents. Deep down he knows he’s in over his head. He has surrounded himself with sycophants and blocks out any news that disrupts his fantasy of greatness.
An old rule in Washington holds that you are entitled to your own opinions but you are not entitled to your own facts. President Trump seems determined to prove that wrong.
Mr. Trump’s war on facts reached new heights on Friday when he angrily fired the Labor Department official in charge of compiling statistics on employment in America because he did not like the latest jobs report showing that the economy isn’t doing as well as he claims it is. Mr. Trump declared that her numbers were “phony.” His proof? It was “my opinion.” And the story he told supposedly proving she was politically biased? It had no basis in fact itself.
The message, however, was unmistakable: Government officials who deal in data now fear they have to toe the line or risk losing their jobs. Career scientists, longtime intelligence analysts and nonpartisan statisticians who serve every president regardless of political party with neutral information on countless matters, such as weather patterns and vaccine efficacy, now face pressure as never before to conform to the alternative reality enforced by the president and his team.
Mr. Trump has never been especially wedded to facts, routinely making up his own numbers, repeating falsehoods and conspiracy theories even after they are debunked and denigrating the very concept of independent fact-checking. But his efforts since reclaiming the White House to make the rest of government adopt his versions of the truth have gone further than in his first term and increasingly remind scholars of the way authoritarian leaders in other countries have sought to control information.
“Democracy can’t realistically exist without reliable epistemic infrastructure,” said Michael Patrick Lynch, author of the recently published “On Truth in Politics” and a professor at the University of Connecticut.
“Anti-democratic, authoritarian leaders know this,” he said. “That is why they will seize every opportunity to control sources of information. As Bacon taught us, knowledge is power. But preventing or controlling access to knowledge is also power.”
The British philosopher Francis Bacon published his meditations on truth and nature more than four centuries before Mr. Trump arrived in Washington, but history is filled with examples of leaders seeking to stifle unwelcome information. The Soviets falsified data to make their economy look stronger than it was. The Chinese have long been suspected of doing the same. Just three years ago, Turkey’s autocratic leader fired his government’s statistics chief after a report documented rocketing inflation.
Mr. Trump’s advisers defended his decision to fire the Labor Department official, saying he was only seeking accuracy, and they released a list of recent job estimates that were later revised. While revisions of job creation estimates are normal, they argued without evidence that recent ones indicated a problem.
The bureau’s “data has been historically inaccurate and led by a totally incompetent individual,” Taylor Rogers, a White House spokesman, said on Saturday. “President Trump believes businesses, households and policymakers deserve accurate data when making major policy decisions, and he will restore America’s trust in this key data.”
Mr. Trump has spent a lifetime trying to impose his facts on others, whether it be claiming that Trump Tower has 10 more floors than it actually has or insisting that he was richer than he actually was. He went so far as to sue the journalist Timothy L. O’Brien for $5 billion for reporting that Mr. Trump’s net worth was less than he maintained it was. The future president testified in that case that he determined his net worth based in part on “my own feelings.” (The suit was dismissed.)
His fast-and-loose approach to numbers and facts finally caught up with him last year when he was found liable for fraud in a civil case in which a judge found that he used his annual financial statements to defraud lenders and ordered him to pay what has now exceeded $500 million with interest. Mr. Trump has appealed the ruling.
During his first term as president, Mr. Trump chastised the National Park Service for not backing up his off-the-top-of-his-head estimate of the crowd size at his inauguration. He used a Sharpie pen to alter a map to argue that he was right to predict that a hurricane might hit Alabama, and federal weather forecasters were rebuked for saying it would not.
Most explosively, he pressured Justice Department officials to falsely declare that the 2020 election was corrupt and therefore stolen from him even after they told him there was no evidence of widespread voter fraud.
This second term, however, has seen Mr. Trump go further to force his facts on the government and get rid of those standing in the way. After just six months of his return to office, the Union of Concerned Scientists, a nonprofit advocacy group, counted 402 of what it called “attacks on federal science,” nearly double its count from the entire first term.
Gretchen T. Goldman, president of the union and a former science adviser to President Joseph R. Biden Jr., said federal agencies like the Bureau of Labor Statistics, whose director was fired by Mr. Trump on Friday, are meant to operate more independently to avoid the politicization of data collection and reporting.
“Firing the top statistical official sends a clear signal to others across the government that you are expected to compromise scientific integrity to appease the president,” she said. “This puts us in dangerous territory far from an accountable and reality-based government.”
Mr. Trump’s team has aggressively sought to steer information emerging from the federal government since January if it contradicted the president. The top aide to Tulsi Gabbard, Mr. Trump’s director of national intelligence, ordered intelligence analysts to rewrite an assessment on the Venezuelan government’s relationship with the gang Tren de Aragua that undermined the president’s claims. Ms. Gabbard later fired two intelligence officialsbecause she said they opposed Mr. Trump.
Mr. Trump and his allies assailed the nonpartisan Congressional Budget Office for projecting that his tax and spending legislation would add trillions of dollars to the national debt and offered his own numbers instead.
“I predict we will do 3, 4, or even 5 times the amount they purposefully ‘allotted’ to us,” he said, referring to growth expected to be stimulated by tax cuts, which he insisted would “cost us no money.” Mr. Trump called the budget office “Democrat inspired and ‘controlled,’” even though it is nonpartisan and Republicans have majorities in both chambers of Congress.
In recent days, Mr. Trump has sought to rewrite the history of the 2016 election when, according to multiple intelligence reports and investigations, including by Republicans, Russia intervened in the campaign with the goal of helping him beat Hillary Clinton. Ms. Gabbard released documents that she claimed showed that in fact President Barack Obama orchestrated a “yearslong coup and treasonous conspiracy” against Mr. Trump, even though the documents she released did not prove that.
Federal officials have gotten the hint. Throughout the government, officials have sought to remove references to topics like “diversity” that might offend Mr. Trump or his team and to revise presentation of history that might in his view cast the country in a negative light. After Mr. Trump ordered the National Park Service to remove or cover up exhibits at its 433 sites across the country that “inappropriately disparage Americans,” employees have flagged displays on slavery, climate change and Native Americans for possible deletion.
Just last week, the Smithsonian Institution confirmed that it had removed Mr. Trump from an exhibit on impeachment at the National Museum of American History, despite the fact that he is the only president to have been impeached twice. The exhibit was changed to say that “only three presidents have seriously faced removal,” referring to Andrew Johnson, Richard M. Nixon and Bill Clinton — with no mention of Mr. Trump.
The Smithsonian, which has been under pressure from Mr. Trump to eliminate “anti-American ideology,” as he put it in an executive order, said in a statement that it had made the change after reviewing the “Limits of Presidential Power” section of the exhibit, which also includes sections on Congress, the Supreme Court and public opinion.
Because the other sections had not been updated since 2008, the Smithsonian said it decided to revert the impeachment section back to its 2008 version, even though it now presents a false account of history. After The Washington Post and other outlets reported about the change, the Smithsonian on Saturday said the exhibit would be “updated in the coming weeks to reflect all impeachment proceedings in our nation’s history.”
The president’s decision to fire Erika McEntarfer, the commissioner of the Bureau of Labor Statistics, came just hours after her office issued its monthly report showing that job growth in July was just half as much as last year’s average. The bureau also revised downward the estimated job creation of the two previous months.
Mr. Trump erupted at the news and ordered her dismissed, claiming on social media that the numbers were “RIGGED in order to make the Republicans, and ME, look bad.” He offered no proof but just said it was “my opinion.”
Both Democrats and Republicans criticized the move, including Mr. Trump’s labor statistics chief in his first term, William W. Beach, who wrote on social media that it was “totally groundless” and “sets a dangerous precedent.”
Speaking with reporters before heading to his New Jersey golf club for the weekend, Mr. Trump asserted bias on the part of Dr. McEntarfer, who was appointed by Mr. Biden and confirmed by a large bipartisan vote in the Senate, including Vice President JD Vance, then a senator. The example Mr. Trump offered as evidence was flatly untrue.
“Days before the election, she came out with these beautiful numbers for Kamala,” Mr. Trump said, referring to his opponent, Vice President Kamala Harris. “Then right after the election — I think on the 15th, Nov. 15 — she had an eight or nine hundred thousand-dollar massive reduction.” What he meant was that the bureau revised downward its estimate of how many jobs had been created by 800,000 or 900,000 only after the election so as not to hurt Ms. Harris’s chances of victory.
Except that it actually happened the exact opposite way. Dr. McEntarfer’s bureau revised the number of jobs created downward by 818,000 in August 2024 — before the election, not after it. And the monthly report her bureau released just days before the election was not helpful to Ms. Harris but instead showed that job creation had stalled. The White House offered no comment when asked about the president’s false account.
“It’s a post-factual world that Trump is looking for, and he’s got these sycophants working for him that don’t challenge him on facts,” said Barbara Comstock, a former Republican congresswoman from Virginia.
But firing the messenger, she said, will not make the economy any better. “The reality is the economy is worse, and he can’t keep saying it’s better,” she said. “Joe Biden learned that; people still experience the experience they have, no matter how much” you tell them otherwise.
Thom Hartmann, accomplished author, blogger, and podcaster, urges progressives to learn from the success of the radical Right. The ultra-Right as for many years a fringe group, far from the power center of the Republican Party. Now the extremists control the Republican Party. Hartmann explains how they accomplished this feat and why progressives should do the same.
He writes:
What if, lacking an organized resistance to fascism like we have had in previous eras (the civil rights movement, SDS, BLM, the Wobbly’s) the Democratic Party itself could play the role of producing radical, positive transformation across America?
Sound crazy? It’s actually happened twice.
The first time was in the 1930s, when Franklin Roosevelt’s New Deal literally flipped our politics and the American economy upside down, turning us from a raw, harsh capitalist system to a democratic socialist system with Social Security, legalized unions, unemployment insurance, a minimum wage, workplace safety rules, massive infrastructure construction, and millions of Americans being employed directly by the government to end poverty.
It happened again in the 1960s, with Lyndon Johnson’s Great Society, producing Medicare, Medicaid, the civil rights act, the voting rights act, food stamps, low income housing, National Public Radio, a transformation of our educational system for the better, USAID, Job Corps, VISTA, Head Start, a major Social Security expansion, The National Endowment for the Arts, and what was essentially free college.
Sunday, I was on Ali Velshi’s show on MSNBC a conversation about protest movements. I pointed out that back in the 60s, when I was in SDS, there were a number of groups that were quite active, particularly on college campuses, but today most of them have been gutted or banned.
Black Lives Matter has disintegrated, the movement against Israel’s slaughter in Gaza has led to universities rolling over and capitulating, and the #MeToo and abortion rights movements are essentially leaderless.
Which leaves the Democratic Party, as I mentioned on Ali’s show. Billionaires and racists turned the Republican Party into a neofascist protest party over the past decade; progressives and those of us who want to preserve democracy in America need to similarly says control of and radicalize the Democratic Party in the tradition of FDR and LBJ.
There is a vital lesson progressives must learn, which is how the far right took control of the Republican Party over a decade ago and forced the entire Conservative establishment to lurch so far to the Right that they’ve even dumped people like Liz Cheney and George W. Bush.
If progressives hope to have any shot at influencing today’s Democratic Party and kicking out the corporate sellout Democrats and replacing them with real-deal progressives, then we need to get to work right now to do exactly what the Tea Party did a decade and a half ago to take power.
And it starts in our own backyards.
Let me introduce you to the now-defunct Concord Project, a right-wing organization that, a decade ago, was in charge of helping the Tea Party’s Successful effort to take over and radicalize the GOP.
The Concord Project expanded their get-out-the-vote strategy beyond just traditional phone banking, canvassing, and putting up “vote Republican” signs. Instead, they decided to infiltrate local politics by encouraging Tea Partiers and conservatives more generally to become “Precinct Committee Members.”
“What’s the most powerful political office in the world? It is not the President of the United States. It’s Precinct Committeeman.”
So why is a Precinct Committeeman (or person) so important?
“First, because precinct committeemen and only precinct committeemen get to elect the leaders of the political parties; if you want to elect the leadership of one of the two major political parties in this country, then you have to become a precinct committeeman.”
As in the oldest and most basic governing reality in a republic: true and effective political power flows up from the bottom.
It starts with Precinct Committeemen and women — people who are either appointed or win local elections with very few votes at stake, in some cases only 10 or 20 votes — to gain positions that pretty much anyone can hold but which wield enormous power.
It’s Precinct Committee Persons who elect district, county, and state party officials and delegates, who choose primary nominees that then go on to hold elected office, and who help draft a party’s platform.
They’re also generally the first people who elected officials meet with when they come back into the district. And those officials listen carefully to what Precinct Committee persons have to say.
So, the Concord folks told their people, if far right Tea Partiers moved in and took over Precinct Committee seats then they’d also be able to nominate a slew of Tea Partiers to hold higher offices within the Republican Party and for primaries.
And those Tea Party Republican Party primary candidates would then be winnowed down in the primary to one Tea Party Republican to run against the Democrat in the general election. This way, Tea Partiers would end up dominating the GOP.
That was their pitch: take over the party from the inside, from the bottom up. And it worked….
July 28, 2025, by Dr. Chet Haskell: The headlines are full of uncertainty for American higher education. “Crisis” is a common descriptor. Federal investigations of major institutions are underway. Severe cuts to university research funding have been announced. The elimination of the Department of Education is moving ahead. Revisions to accreditation processes are being floated. Reductions in student support for educational grants and loans are now law. International students are being restricted.
These uncertainties and pressures affect all higher education, not just targeted elite institutions. In particular, they are likely to exacerbate the fragility of smaller, independent non-profit institutions already under enormous stress. Such institutions, some well-known, others known only locally, will be hard hit particularly hard by the combination of Trump Administration pressures and the developing national demographic decline for traditional-age students.(https://www.highereddive.com/news/decline-high-school-graduates-demographic-cliff-wiche-charts/738281/) These small colleges have been a key element of the American higher education scene, as well as for numerous local communities, for many decades.
It is widely understood that the vibrancy of American higher education comes, in part, from the diversity of its institutions and educational goals. The rich mixture of American colleges and universities is a strength that many other nations lack. Students have opportunities to start and stop their educations, to change directions and academic goals, to move among different types of institutions.
Smaller undergraduate colleges play important roles in this non-systemic system. They provide focused educational opportunities for younger adults, where they can build their lives on broad principles. Impressively large percentages of small college graduates go on to graduate education for various professions. Small colleges provide large numbers of graduates who enter PhD programs and eventually enter the professorate.
There are approximately 1179 accredited private institutions with enrollments of fewer than 3000 students. Of these, 185 have between 3000 and 2000 students. Another 329 have enrollments below 2000 but above 1000. A final 650 institutions have enrollments below 1000. These 1179 institutions students include few wealthy colleges such as Williams, Amherst, Carleton or Pomona, as well as numerous struggling, relatively unknowns.
A basic problem is one of scale. In the absence of significant endowments or other external support, it is very difficult to manage small institutions in a cost effective manner. Institutions with enrollments below 1000 are particularly challenged in this regard. The fundamental economics of small institutions are always challenging, as most are almost completely dependent on student enrollments, a situation getting worse with the coming decline of traditional college age students. There are limited options available to offset this decline. Renewed attention to student retention is one. Another is adding limited graduate programs. However, both take investment, appropriate faculty and staff capacity and time, all of which are often scarce.
These institutions have small endowments measured either in total or per student value. Of the 1179. There are only 80 with total endowments in excess of $200 million. While a handful have per student endowments that rival the largest private universities, (Williams, Amherst and Pomona all have per student endowments in excess of $1.8 million), the vast majority have per student endowments in the $40,000 range and many far less.
Most of these schools have high tuition discount rates, often over 50%, so their net tuition revenue is a fraction of posted expense. They are all limited by size – economies of scale are difficult to achieve. And most operate in highly competitive markets, where the competition is not only other small schools, but also a range of public institutions.
So, what is the underendowed, under resourced small college to do?
The most common initiatives designed to address these sorts of challenges are consortia, collaborative arrangements among institutions designed to increase student options and to share expenses. There are numerous such arrangements, examples being the Colleges of the Fenway in Boston, the Five Colleges of Western Massachusetts, the Washington DC Metropolitan Area Consortium, and the Claremont Colleges in California, among others.
The particulars of each of these groups differ, but there are commonalities. Most are geographically oriented, seeking to take advantage from being near each other. Typically, these groups want to provide more opportunities for students through allowing cross-registrations, sharing certain academic programs or joint student activities. They usually have arrangements for cost-sharing or cost reductions through shared services for costs like security services, IT, HR, risk management options, pooled purchasing and the like. In other cases (like the Claremont Consortium) they may share libraries or student athletic facilities. Done well, these arrangements can indeed reduce costs while also attracting potential students through wider access to academic options.
However, it is unlikely that such initiatives, no matter how successful, can fundamentally change the basic financial situation of an independent small college. Such shared services savings are necessary and useful, but usually not sufficient to offset the basic enrollment challenge. The financial impact of most consortia is at the margins.
Furthermore, participating institutions have to be on a solid enough financial basis to take part in the first place. Indeed, a consortium like Claremont is based on financial strength. Two of the members have endowments in excess of $1.2 billion (Pomona’s is $2.8 billion.) The endowments of the others range from a low of $67 million (Keck Graduate with 617 students) to Scripps with $460 million for 1100 students.) The Consortium is of clear value to its members, but none of these institutions is on the brink of failure. Rather, all have strong reputations, a fact that provides another important enrollment advantage.
One important factor in these consortia arrangements is that the participating institutions do not have to give up their independence or modify their missions. Their finances, alumni and accreditation are separate. And while the nature of the arrangement indicates certain levels of compromise and collaboration, their governance remains basically unchanged with independent fiduciary boards.
At the other end of the spectrum are two radically different situations. One is merging with or being acquired by another institution. Prep Scholar counts 33 such events since 2015. (https://blog.prepscholar.com/permanently-closed-colleges-list). Lacking the resources for financial sustainability, many colleges have had no choice but to take such steps.
Merging or being acquired by a financially stronger institution has many advantages. Faculty and staff jobs may be protected. Students can continue with their studies. The institution being acquired may be able to provide continuity in some fashion within the care of the new owner. Endowed funds may continue. The institution’s name may continue as part of an “institute” or “center” within the new owner’s structure. Alumni records can be maintained. Real estate can be transferred. Debts may be paid off and so forth. There are multiple examples of the acquiring institution doing everything possible along these lines.
But some things end. Independent governance and accreditation cease as those functions are subsumed by the acquiring institution. Administrative and admissions staffs are integrated and some programs, people and activities are shed. Operational leadership changes. And over time, what was once a beloved independent institution may well fade away.
The end of a college is a very sad thing for all involved and, indeed, for society in general. Often a college is an anchor institution in a small community and the loss is felt widely. The closure of a college is akin to the closure of a local factory. As Dean Hoke and others have noted, this is a particular problem for rural communities.
Are there other possible avenues, something between a consortium and a merger or outright closure?
One relatively new model has been organized by two quite different independent institutions, Otterbein University and Antioch University, that came together in 2022 to create the Coalition for the Common Good. Designed to be more than a simple bilateral partnership, the vision of the Coalition is eventually to include several institutions in different locations linked by a common mission and the capacity to grow collective enrollments.
At its core, the Coalition is based on academic symbiosis. Otterbein is a good example of the high-quality traditional undergraduate residential liberal arts institution. It has been well-run and has modest financial resources. Facing the demographic challenges noted earlier (in a state like Ohio that boasts dozens of such institutions), it developed a set of well-regarded graduate programs, notably in nursing and health-related fields, along with locally based teacher education programs and an MBA. However, despite modest success, they faced the limitations of adult programs largely offered in an on-campus model. Regardless of quality, they lacked the capacity to expand such programs beyond Central Ohio.
Antioch University, originally based in Ohio, had evolved over the past 40 years into a more national institution with locations in California, Washington State and New Hampshire offering a set of graduate professional programs to older adults mostly through distance modalities in hybrid or low-residency forms. Antioch, however, was hampered by limited resources including a very small endowment. It had demonstrated the capacity to offer new programs in different areas and fields but lacked the funds necessary for investment to do so.
Within the Coalition, the fundamental arrangement is for Antioch to take over Otterbein’s graduate programs and, with Otterbein financial support, to expand them in other parts of the country. The goal is significant aggregate enrollment growth and sharing of new revenues. While they plan a shared services operation to improve efficiencies and organizational effectiveness, their primary objective is growth. Antioch seeks to build on Otterbein’s successes, particularly with nursing programs. It already has considerable experience in managing academic programs at a distance, a fact that will be central as it develops the Otterbein nursing and health care programs in a new Antioch Graduate School of Nursing and Health Professions.
It is assumed that additional new members of the Coalition will resemble Otterbein in form, thus further increasing opportunities for growth through enhanced reach and greater scale. New members in other geographic locations will provide additional opportunities for expansion. One early success of the Coalition has been the capacity to offer existing Antioch programs in Central Ohio, including joint partnerships with local organizations, health care and educational systems. Crucially, both institutions remain separately accredited with separate governance and leadership under a Coalition joint “umbrella” structure.
This is not to assert that this model would work for many other institutions. First, many schools with limited graduate programs will be reluctant to “give up” some or all these programs to another partner in the same fashion as Otterbein has with Antioch. Others may not fit geographically, being too remote for expansion of existing programs. Still others may not wish to join a group with an avowed social justice mission. Finally, as with some consortia, the Coalition arrangement assumes a certain degree of institutional financial stability – it cannot work for institutions on the brink of financial disaster, lest the weakest institution drag down the others.
Are there other organizational variants that are more integrated than consortia, but allow the retention of their independence in ways impossible in a merger or acquisition model? What can be learned from the Coalition initiative that might help others? How might such middle-ground collaboration models be encouraged and supported?
How can philanthropy help?
This is an opportunity for the segments of the philanthropic world to consider possible new initiatives to support the small college elements of the education sector. While there will always be efforts to gain foundation support for individual colleges, there will never be enough money to buttress even a small portion of deserving institutions that face the financial troubles discussed above
Philanthropy should take a sectoral perspective. One key goal should be to find ways to support smaller institutions in general. Instead of focusing on gifts to particular institutions, those interested in supporting higher education should look at the multiple opportunities for forms of collaborative or collective action. Central to this effort should be exploration of ways of supporting diverse collaborative initiatives. One example would be to provide sufficient backing to a struggling HBCU or women’s college to enable it to be sufficiently stable to participate in a multi-institutional partnership.
As noted, institutional consortia are well established as one avenue for such collaboration. Consortia have existed for many years. There are consortia-based associations that encourage and support consortia efforts. However, every consortium is unique in its own ways, as participating institutions have crafted a specific initiative of a general model to meet their particular situations and need. Consortia can be important structures for many institutions and should be encouraged.
But there is a large middle ground between consortia arrangements and mergers and acquisitions. The Coalition for the Common Good is but one such arrangement and it is still in its early stages. What has been learned from the experience thus far that might be of use to other institutions and groups? How might this middle ground be explored further for the benefit of other institutions?
One thing learned from the Coalition is the complexity of developing a new model for collective action. Antioch and Otterbein separately pursued individual explorations of options for two or more years before determining that their partnership together should move forward. It then took a full year to get to the point of announcing their plans and another year to complete negotiations and sign completed legal documents and to obtain the necessary accreditor, regulator and Department of Education approvals. The actual implementation of their plans is still in a relatively early stage. In short, it takes time.
It also takes tremendous effort by leadership on both sides, as they must work closely together while continuing to address the daily challenges of their separate institutions. Everyone ends up with at least two major jobs. Communication is vital. Boards must continue to be supportive. The engagement of faculty and staff takes time and can be costly.
What is often referred to as “fit” – the melding of cultures and attitudes at both the institutional and individual levels – is essential. People must be able to work together for shared goals. The burdens of accreditation, while necessary, are time-consuming and multifaceted. There are many things that can go wrong. Indeed, there are examples of planned and announced mergers or collaborations that fall apart before completion.
Philanthropic institutions could support this work in numerous ways, first for specific initiatives and then for the sector, by providing funding and expertise to facilitate new forms of coalitions. These could include:
Providing financial support for the collaborative entity. While participating institutions eventually share the costs of creating the new arrangement, modest dedicated support funding could be immensely useful for mitigating the impact of legal expenses, due diligence requirements, initial management of shared efforts and expanded websites.
Providing support for expert advice. The leaders of two institutions seeking partnership need objective counsel on matters financial, legal, organizational, accreditation and more. Provision of expertise for distance education models is often a high priority, since many small colleges have limited experience with these.
Funding research. There are multiple opportunities for research and its dissemination. What works? What does not? How can lessons learned by disseminated?
Supporting communication through publications, workshops, conferences and other venues.
Developing training workshops for boards, leadership, staff and faculty in institutions considering collaborations.
Crafting a series of institutional incentives through seed grant awards to provide support for institutions just beginning to consider these options.
These types of initiatives might be separate, or they might be clustered into a national center to support and promote collaboration.
These and other ideas could be most helpful to many institutions exploring collaboration. Above all, it is important to undertake such explorations before it is too late, before the financial situation becomes so dire that there are few, if any, choices.
Conclusions
This middle ground is not a panacea. The harsh reality is that not all institutions can be saved. It takes a certain degree of stability and a sufficient financial base to even consider consortia or middle ground arrangements like the Coalition for the Common Good. Merging with or being acquired by stronger institutions is not a worst-case scenario – there are often plenty of reasons, not just financial, that this form of change makes great sense for a smaller, weaker institution.
It is also important for almost all institutions, even those with significant endowment resources, to be thinking about possible options. The stronger the institution, the stronger the resistance to such perspectives is likely to be. There are examples of wealthy undergraduate institutions with $1 billion endowments that are losing significant sums annually in their operating budgets. Such endowments often act like a giant pillow, absorbing the institutional challenges and preventing boards and leaders from facing difficult decisions until it may be too late. Every board should be considering possible future options.
In the face of likely government rollbacks of support, the ongoing demographic challenges for smaller institutions and the general uncertainties in some circle about the importance of higher education itself, independent private higher education must be more creative and assertive about its future. Also, it is essential to remember that the existential financial challenges facing these institutions predate the current Presidential Administration and certainly will remain once it has passed into history.
Just trying to compete more effectively for enrollments will not be sufficient. Neither will simply reducing expense budgets. New collaborative models are needed. Consortia have roles to play. The example of the Coalition for the Common Good may show new directions forward. Anyone who supports the diversity of American higher education institutions should work to find new ways of assuring financial stability while adhering to academic principles and core missions.
Chet Haskell is an independent higher education consultant. Most recently, he was Vice Chancellor for Academic Affairs and University Provost at Antioch University and Vice President for Graduate Programs of the Coalition for the Common Good.