In this post, Peter Greene continues his coverage of a teacher in West Ada, Idaho, who got into trouble for putting up a poster that showed different colored hands in the air and said “Everyone is Welcome Here.” District leaders said the poster was unwelcome because it violated federal guidelines that banished DEI, and had to be removed. Some didn’t object to the sentiment but objected to the portrayal of nonwhite hands.
Greene wrote:
Sarah Inama has put her poster up in a new classroom.
Inama, you may recall, is the 6th grade world history teacher told by her district bosses at West Ada School District that her “Everyone Is Welcome Here” poster, complete with hands of many human shades, would not be tolerated in the district. (I’ve been following this here, here, and here). West Ada is the largest district in Idaho, but their treatment of Inama has been spectacularly awful, both from an Awful Display of Racism standpoint, a Grotesque Mistreatment of Staff standpoint, and a Boneheaded PR Management standpoint.
Inama went to local news and the story blew up, delivering the shame that West Ada so richly deserved. We know a lot more thanks to some stellar reporting by Carly Flandro and the folks at Idaho Ed News, who FOIAed 1200 emails surrounding this and showcasing the board’s stumbling response. You should read the resulting stories (here and here).
The day after Inama was on the Today show, the district issued a memo entitled “Ensuring a Consistent and Supportive Learning Environment.” They decided to go with sports analogies. The Chief Academic Officer is a like a referee who enforces rules “to ensure a fair and level playing field.” And there’s this howler–
If one player decided to wear a different uniform, use a different-sized ball, or ignore the rules, the game would lose its structure, creating confusion and imbalance.
Then a report from BoiseDev that the Board of Trustees is considering making every teacher put up an “Everyone is welcome” poster– just without those multi-colored hands. Responding to BoiseDev, a district spokesperson explained:
Regarding the Everyone is Welcome Here posters, the district determined that while the phrase itself is broadly positive, certain design elements have been associated over time with political entities and initiatives that are now subject to federal restriction.
Inama told Idaho EdNews, “That’s appeasing not a political view, but a bigoted view that shouldn’t even be considered by a public school district.”
Inama was told the poster was divisive, that it was “not neutral,” that the problem was not the message, but the hands of v arious skin tones. Teachers shouldn’t have political stuff in the classroom. Inama nails the issue here
“I really still don’t understand how it’s a political statement,” she said. “I don’t think the classroom is a place for anyone to push a personal agenda or political agenda of any kind, but we are responsible for first making sure that our students are able to learn in our classroom.”
Some parents and students showed up at school to make chalk drawings in support. And yet many folks within and outside the district saw this as a divisive issue. How could anyone do that? Meet district parent Brittany Bieghler, who was dropping her kids off the day that parents were chalking the “Everyone is welcome here” message on the sidewalks.
“The ‘Everyone is Welcome’ slogan is one filled with marxism and DEI, there is no need for those statements because anyone with a brain knows that everyone is welcome to attend school, so there is no need to have it posted, written or worn on school grounds,” she wrote. “My family and I relocated here from a state that did not align with our beliefs and we expected it to be different here, but it seems as time goes by, its becoming more like our former state, which is extremely disheartening.”
“Anyone with a brain” might begin to suspect that everyone is not welcome here under these circumstances. And the school board itself couldn’t decide what to respond, drafting an assortment of emails that tried to show conciliation to those that were defiant and defensive, including one complaining in MAGA-esque tones that Inama was naughty for going to “new media.”
Imana resigned from her position, and by June the word was out that she was a new hire at Boise Schools. She told Idaho Ed News,
I’m so grateful to be able to work within a district that knows the beauty of inclusion and diversity and doesn’t for a second consider it an opinion but embraces it. As an educator, it’s an amazing feeling to know your (district’s) officials, board, and administrators fully uphold the fundamentals of public education and (have) the dignity to proudly support them. I really feel at home knowing we are truly all on the same team … and that’s a team that is rooting on all of our students.
Damned straight. And just last week, as reported by KTVB news, Inama posted video of herself putting up an “Everyone is welcome here” poster in her new classroom.
So the story ends well for Inama, and that’s a great thing. This is the sort of boneheaded administrative foolishness that can drive teachers out of the profession. The unfortunate part of the story is that up the road in West Ada schools, the administration, board and a non-zero number of parents think that challenging racism is bad and saying that students of all races are welcome in school is just one person’s opinion that shouldn’t be expressed openly in a school. Shame on West Ada.
Polk County Public Schools expressed relief July 25 after learning that the Trump Administration would release about $20 million in funding that it had withheld for weeks.
The district issued a news release, noting that the previously frozen grants in four categories directly fund staff positions and services supporting migrant students, English-language learners, teacher recruitment and professional development, academic enrichment programs and adult education.
The relief, though, was only partial. When the district eight days earlier took the unusual action of issuing a public statement warning of “significant financial shortfalls,” it cited not only the suspended federal grants but also state policies.
Legislative allocations for vouchers — scholarships to attend private schools or support home schooling — combined with increased funding for charter schools “are diverting another $45.7 million away from Polk County’s traditional public schools,” the district’s news release said.
The statement reflected warnings made for years by advocates for public education that vouchers are eroding the financial stability of school districts.
“The state seemingly underestimated the fiscal impact that vouchers would have,” Polk County Schools Superintendent Fred Heid said in the July 17 news release. “As a result, the budget shortfall has now been passed on to school districts resulting in a loss of $2.5 million for Polk County alone. We now face having to subsidize state priorities using local resources.”
Florida began offering vouchers in the 1990s, initially limiting them to students with disabilities and those in schools deemed as failing. Under former Gov. Jeb Bush, the state expanded the program in 2001 to include students from low-income families.
The number of students receiving vouchers rose as state leaders adjusted the eligibility formula. In 2023, the Legislature adopted a measure introducing universal vouchers, available to students regardless of their financial status.
Get the Daily Briefing newsletter in your inbox.
Start your day with the morning’s top news
Delivery: DailyYour Email
All of Polk County’s legislators voted for the measure: Sen. Ben Albritton, R-Wauchula; Sen. Colleen Burton, R-Lakeland; Rep. Melony Bell, R-Fort Meade; Rep. Jennifer Canady, R-Lakeland; Rep. Sam Killebrew, R-Winter Haven; and Rep. Josie Tomkow, R-Polk City.
Allotment for vouchers swells
The vouchers to attend private schools are known as Florida Empowerment Scholarships. The state also provides money to families through the Florida Tax Credit Scholarship and the Personalized Education Program, which financially supports home-schooled students.
The money for vouchers comes directly from Florida’s public school funding formula, the Florida Education Finance Program.
Families of students receiving such scholarships have reportedly used the money to purchase large-screen TVs and tickets to theme parks, spending allowed by Step Up For Students, the nonprofit that administers most scholarships.
The state allotment for vouchers has swelled from $1.6 billion in the 2021-2022 school year to about $4 billion in fiscal year 2024-2025, according to an analysis from the Florida Policy Institute, a nonprofit with a progressive bent.
0:19
/
0:19
In Polk County, 5,023 students claimed vouchers in the 2021-2022 school year, according to the FPI report. Those scholarships amounted to just over $41 million.
The figures rose in 2022-2023 to 6,124 students and nearly $58 million. The following year, the total was 7,854 students and nearly $72 million.
In the 2024-2025 school year, 11,297 students in Polk County received vouchers totaling more than $97 million, FPI reported.
A calculation from the Florida Education Finance Program projects that nearly $143 million of Polk County’s state allotment for education will go to Family Empowerment Scholarships in the 2025-2026 school year, a potential increase of about 47%. The total reflects 16.3% of Polk County’s state funding.
Statewide, the cost of vouchers has risen steadily and is projected to reach nearly $4 billion in the 2025-26 school year.
Florida’s State Education Estimating Conference report from April predicts that public school enrollment will decline by 66,000 students over the next five years, or about 2.5%. Over the same period, voucher use is projected to increase by 240,000.
The state projected that only about 27% of the new Family Empowerment Scholarship recipients would be former public school students.
Subsidizing wealthy families?
Since the state removed financial eligibility rules for the scholarships in 2023, voucher use has soared by 67%, the Orlando Sentinel reported in February. And the majority of scholarships have been claimed by students who were already attending private schools.
By the 2024-25 school year, more than 70% of private school students were receiving state scholarships, the Sentinel reported. The total had been less than a third a decade earlier.
The Sentinel published a list of private schools, with the number of students on state scholarships from the years before and after the law took effect.
Among Polk County schools, Lakeland Christian School saw a jump from 40 to 89, a rise of 122.5%. The increases were 102.7% for All Saints Academy in Winter Haven and 60.3% for St. Paul Lutheran School in Lakeland.
The scholarships available to Polk County students for the 2025-2026 school year are $8,209 for students in kindergarten through third grade; $7,629 for those in grades four through eight; and $7,478 for students in ninth through 12th grades. Those figures come from Step Up for Students.
There have been news reports of private schools boosting their tuition rates in response to the universal voucher program. Lakeland Christian School’s advertised tuition for high school students has risen from $14,175 in 2022-2023 to $17,975 for the current school year, a jump of 26.8%.
Stephanie Yocum, president of the Polk Education Association, decried the trend of more state educational funding going to private schools.
“In the 2023-24 school year, 70% of Florida’s universal vouchers went to students who already were in private schools,” Yocum said. “Seventy percent of those billions and billions and billions of dollars are going to subsidize already wealthy families, and our state continues to push welfare for the wealthy, while they are siphoning off precious dollars from our students that actually attend a public school, which is still the supermajority of children in this state.”
Critics of vouchers point to Arizona, which instituted universal school vouchers in 2022. That program cost the state $738 million in fiscal year 2024, far more than Arizona had budgeted, according to a report from EdTrust, a left-leaning advocacy group.
Arizona is facing a combined $1.4 billion deficit over fiscal years 2024 and 2025, EdTrust reported. The net cost of the voucher program equals half of the 2024 deficit and two-thirds of the projected 2025 deficit, it said.
Meanwhile, there is a move toward a federal school voucher program. The “One Big Beautiful Bill Act” that Congress adopted in early July uses the federal tax code to offer vouchers that students could use for private school tuition or other qualifying education expenses.
The Senate revised the initial House plan, making it not automatic but an opt-in program for each state. The Ledger emailed the Florida Department of Education on Aug. 4 asking whether the state plans to participate. A response had not come by Aug. 6.
The federal program could cost as much as $56 billion, EdTrust reported. Becky Pringle, president of the National Education Association, the nation’s largest teachers’ union, called the program “a moral disgrace,” as NPR reported.
Canady: Let parents choose
Proponents of vouchers say that it is essential to let students and parents choose the form of education they want, either through traditional public schools, charter schools, private schools or homeschooling.
Canady, who is in line to become state House Speaker in 2028, defended the increase in scholarship funding.
“In Florida, we fund students — not systems,” Canady said by text message. “Parents have the freedom they deserve to make the decisions that are best for their own children. There are a lot of great school options — public district, public charter, private, and homeschool.”
She added: “In Florida, decisions about which school a child will attend are not made by the government — parents are in control.”
Canady has taught at Lakeland Christian for nearly 20 years and is director of the school’s RISE Institute, which encompasses research, innovation, STEM learning and entrepreneurship. She began her career teaching at a public school.
None of Polk County’s other legislators responded to requests for comment. They are Rep. Jon Albert, R-Frostproof; Rep. Jennifer Kincart Jonsson, R-Lakeland; and Albritton, Burton and Tomkow.
Canady noted that 475 fewer students were counted in Polk County Public Schools for funding purposes in the 2024-2025 than in the previous year.
“That reflects the choices that families have made,” Canady wrote. “During the same time, the Florida Legislature increased teacher pay by more than $100 million dollars and continues to spend more taxpayer money on education than ever before.”
She added: “Education today looks different than it did decades ago, and districts around the state are all adapting to the new choice model. Funding decisions should always be about what is good for students and honor the choices that families make.”
The 475 net loss of students in Polk’s public schools last year is far below the increase of 3,443 in Polk students receiving state scholarships.
Questions of accountability
Yocum said that public school districts face certain recurring costs that continue to rise, no matter the fluctuations in enrollment resulting from the use of vouchers.
“You’ll still have the same — I call them static costs, even though those are going up — for maintenance, for buildings, for air conditioning, for transportation,” Yocum said. “All of those costs still exist. But when you start to siphon off dollars that public schools should be getting to run a large-scale operation of educating children, then we are doing more and more with less and less.”
Yocum also raised the question of accountability. The Florida Department of Education carefully controls public schools, largely dictating the curricula they teach, overseeing the certification of teachers and measuring schools against a litany of requirements codified in state law.
Public schools must accept all students, including those with disabilities that make educating them more difficult and costly.
By contrast, Yocum said, private schools can choose which students to accept or reject. The schools are free from much of the scrutiny that public schools face from the Department of Education.
The alert that Polk County Public Schools issued on July 17 mentioned another factor in its financial challenges.
“PCPS is facing an immediate $2.5 million state funding shortfall due to what state officials have described as dual-enrollment errors that misallocated funding for nearly 25,000 Florida students,” the statement said.
That seemed to refer to a “cross check” that the Florida Department of Education performs twice a year, said Scott Kent of Step Up for Students. The agency compares a list of students on scholarships with those reported as attending public schools.
If a student appears on both lists, the DOE freezes the funding. Step Up for Students then contacts the students’ families and asks for documentation that they were not enrolled in a district school, Kent said.
“This is a manual process that can be time-consuming, as the state and scholarship funding organizations want to ensure accuracy and maintain the integrity of the scholarship programs,” Kent said by email. “The DOE currently is checking the lists before releasing funds to Step Up to pay eligible students.”
In the 2025 legislative session, the Florida Senate passed a bill that would have clarified which funds are dedicated to Family Empowerment Scholarships, a way of addressing problems in tracking students as they move between public and private schools. But the bill died, as the state House failed to advance it.
Yocum said the House rejected transparency.
“They want it to look like they’re funding public schools at the level that they should be funding it, where, in reality, more and more of our dollars are running through our budgets but being diverted to corporate charter, private schools and home schools that have no accountability to our tax dollars,” she said.
Effect of charter schools
The warning from the Polk County school district mentioned funding for charter schools as part of a “diversion” of $45.7 million traditional public schools.
Charter schools are publicly funded schools that operate independently. Polk County has 36 charter schools covering all grades. Those include two charter systems: Lake Wales Charter Schools with seven schools, and the Schools of McKeel Academy with three.
Some other charter schools are affiliated with national organizations, including for-profit companies.
Yocum lamented the passing of public funds through the school district to charter schools, though specified that she had no criticism of the McKeel or Lake Wales systems.
“We’re talking about the corporate-run charters that are in it to make money,” she said. “We keep seeing billions and billions of our state dollars diverted to those money-making entities that do not make decisions in the best interest of children. They make decisions in the best interest of their bottom line.”
Canady sponsored a bill in 2023 establishing the transfer of hundreds of millions of dollars from traditional public schools to charter schools’ capital budgets by 2028. It passed with the support of all Polk County lawmakers, and Gov. Ron DeSantis signed it into law.
The Florida Legislature passed a bill in the 2025 session (HB 1105), co-sponsored by Kincart Jonsson, that requires public school districts to share local surtax revenues with charter schools, based on enrollment share.
The bill, which DeSantis signed into law, also makes it easier to convert a public school into a charter school, allowing parents to initiate the change without requiring cooperation from teachers. It also authorizes cities or counties to transform public schools with consecutive D or F grades into “job engine” charter schools.
Nancy Bailey frames her latest post as a program to end truancy. But in fact, she lays out a bullet list of reforms that would make school what it’s supposed to be: a welcoming place to learn, to make friends, to expand your world, to learn how to work with others.
She writes:
School starts for students whose families rely on public education, which the Trump administration is trying to end. For years, however, school reforms have made schools less personable; as a result, school attendance has decreased, especially since the pandemic.
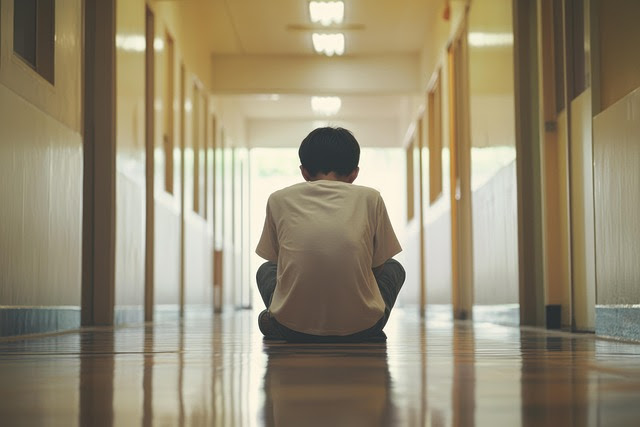
Why do kids reject school? Bullying, harassment, family problems, parental work schedules, mental health, illnesses, transportation, and residual effects of COVID might be issues that school districts must address.
Another reason is disengagement; public education has become impersonal, due to terrible school policies over the years, which may overlook the unique capabilities of individual students. If no welcome mat is rolled out to show children they’re valued, why would they care?
It wouldn’t be hard to fix the issues discouraging students from going to school. Teachers do their best, but poor schools, lacking resources or following poorly devised reforms, face a greater challenge in attracting students.
Here are a few considerations.
Provide safe schools with smaller class sizes.
School officials and communities must ensure student safety. Children and teens should not fear school.
Smaller class sizes (at least one homeroom) allow teachers to know students, enabling friendships, ending bullying, and better welcoming families.
Every school leader, teacher, and staff member should know the warning signs of students. Here’s one checklist. There are more online.
School gatherings like sports, plays, art exhibits, concerts, etc., help bring families and students together and show school pride in students’ achievements. The motto: Know and Care About Every Student!
Teachers and students need support.
Teachers and students also require support, counselors, school psychologists, social workers, and outside specialists to help when a child is facing trauma or a crisis. Resources and placement settings for children must be available.
End poor and over-assessment.
Pushing privatization, high-stakes standardized testing has been a tool used against public schools and teachers. Students aligned to tests focus on the same information, but much is excluded, and individual strengths may be overlooked. Parents have understood thisfor years!
Children judged harshly for poor test performance are left without options and safety nets, made to feel like failures.
Want to excite students about school? End repetitive high-stakes standardized tests!
Focus on child development.
Students are pushed to perform beyond their age and development. Kindergartnersare expected to read earlier. High school studentsare expected to do college work.
Reduce pressure with a focus on what’s appropriate for the age and development of students.
Increase community support.
Community businesses supporting local public schools help students, teachers, and families. Too often, the focus is on the future workforce, getting students to do what companies want.
What’s most important is the student focus, helping young people to know that they belong, businesses are behind them, and that they have the freedom to choose what they do based on their interests and abilities.
Businesses can sponsor concessions at sports events, high school plays, or art shows, or they might work with teachers to tutor students. Acts like this tell students that the community believes in them and their achievements. They are proud of their public schools.
Offer a variety of extracurricular activities.
Extracurricular activities encompass a wide range of topics. (Prep Scholar(scroll) lists activities.)
In the Abbott Elementary episode “Wishlist,” the teacher Jacob tries to find what interests a student who seems disengaged. Most teachers work to unearth what students care about. This student eventually shares his interest in golf.
Extracurricular activities can bridge the gap between academic pursuits and leisure.
Insist that students have qualified teachers and staff.
Well-prepared teachers, counselors, paraprofessionals, psychologists, nurses, librarians, media specialists (including educational technologists), and administrators, fairly paid, comprise a school well-equipped to teach subjects and provide the support students need to learn effectively. These professionals should understand how to engage students in learning.
When school districts show disdain for teachers, water down credentials, or teachers face cuts or staff shortages, children don’t get the assistance they need. Students may learn incorrect information, or critical subjects essential for their future success may be omitted.
Establish school libraries with real librarians in everyschool.
Research indicates that children who attend public schools with school libraries tend to perform better academically. Sadly, many poor school districts have closed their school libraries.
How do children learn to read if a school doesn’t provide them access to books and enjoyable reading material?
Offer students socialization opportunities.
Understanding how to care for others essentially begins in school with integration, during school recess, where kids learn through free, supervised play and opportunities to interact with those who may look different and hold different beliefs.
We want students not to fear their fellow students, but to like them, not merely to tolerate them.
Develop innovative, nonstigmatizing special education programs.
Since 1975, public school teachers have worked to address the needs of students with disabilities. Ensuring that children have access to quality programs and well-qualified teachers who communicate effectively with parents is key.
Welcoming children with differences and embracing diversity is a strength of America’s public school system.
Reduce technology.
Over the years, a significant portion of school funding has been allocated to technology, yet we’re told that learning outcomes have not improved. Now, serious questions surround the implementation of AIin public schools.
Most parents want their children to rely less on screens and more on beneficial human connections, whether it be with their families or friends. It seems prudent to proceed slowly with AI and any technology. Help students work on human relationships.
Run a vibrant arts program.
Since NCLB, and even before, school districts cut art programs; yet, music, acting, dance, drawing, painting, and chorus give children a creative outlet to explore their interests. These classes are both fun and critical for learning, and they shouldn’t be made tougher or used for assessment. Nor should they be eliminated. The arts can lead to careers for many.
Children with mental health difficulties and the poor may thrive with the arts, and the arts can keep children in school.
Welcome students with lovely school facilities.
Studies have shown that clean, efficiently run school buildingswith a positive school climate can make a significant difference in student progress. Students don’t want to attend buildings that resemble prisons. The school should be clean, safe, and welcoming.
Schools should also ensure that there are few interruptions and that classrooms are conducive to learning with comfortable temperatures and quietness.
Ensure that students have a whole curriculum.
Public schools should offer a variety of instructional options starting at a young age to pique a child’s curiosity. Reading and math are important, but so are geography, science, history, civics, life skills, and the arts, all of which should have a place in public education.
Public schools have never been perfect, but they have educated the masses, and it’s reckless and irresponsible to dismantle them without proof that whatever replaces them will be better. If you want students to come to school, end harsh school reforms, and make public schools a personable, exciting place to be.
Laura Meckler of the Washington Post visited Arizona to learn about the effects of an expansive program of charter schools and vouchers. Arizona voted overwhelmingly against vouchers in a state referendum in 2018. Vouchers lost by 65-35%. The rightwing legislature and Governor Douglas Ducey, encouraged by billionaire Charles Koch, ignored the views of the electorate and enacted a large voucher program.
Now the state underwrites the tuition of kids who were already in private schools, many of whom come from affluent families. Voucher schools admit the students they want and exclude those they don’t want.
Arizona’s charter sector includes for-profit charters and charters run by entrepreneurs and grifters. It has experienced numerous scandals.
There’s no accountability for voucher schools and minimal accountability for homeschoolers whose parents spend money on sports equipment, ninja warrior training, toys, LEGO sets, and a wide variety of nonacademic stuff.
Vouchers and charters have not produced academic gains. On the National Assessment of Educational Progress (NAEP), Arizona is among the lowest-ranking states.
But the biggest consequence of voucher expansion has been the closing of neighborhood public schools. .
Meckler writes:
PHOENIX — The party at John R. Davis Elementary School was in full swing, but at the snow cone station, the school’s librarian was in tears.
Inthe cafeteria, alumni marveled at old photographs on display and shook their heads. On a wall of the library, visitors posted sticky notes to describe their feelings: “Angry,” read a purple square. “Anxious,” said a pink one. “Annoyed.” “Heart broken.” “Bummed.” And more than any other word: “Sad.”
Ten days later, John R. Davis Elementary School would close — not just for the summer, but for good.
Now, as the new school year begins, the Roosevelt Elementary School District opens with just 13 schools. That’s almost a third fewer than it had last spring, a response to enrollment declines as the state offers unprecedented taxpayer funding for alternatives to public school.
The party gave the community a few hours to celebrate the school’s 43 years — to say goodbye.
“It’s a grieving process for me,” Antionette Nuanez, the librarian, told a pair of Davis graduates who dropped by the party. Everyone at the party, it seemed, was feeling the loss — loss of tradition, of community, of simply having a school in walking distance. Nuanez, in particular, was overcome with the emotion of it all: “It’s like a death,” she said.
Perhaps more than any other state, Arizona has embraced market competition as a central tenet of its K-12 education system, offering parents an extraordinary opportunity to choose and shape their children’s education using tax dollars, and developing a national reputation as the Wild West of schooling.
The state has supported a robustcharter school system, tax money for home schooling and expansive private school vouchers, which are available to all families regardless of income. Nearly 89,000 students receive Empowerment Scholarship Accounts, a form of vouchers, state data show; a second voucher program awarded nearly 62,000 tax-supported private school scholarships in 2024, though some students received more than one. More than 232,000 students attend charter schools.
Together, these programs help explain why just 75 percent of Arizona children attended public schools in 2021, the most recent year for which data is available. That’s one of the lowest rates in the country.
Supporters of school choice say families are turning to alternatives because public schools are not serving their children well. It’s only right, they argue, that tax dollars follow children towhatever educational setting their families choose.
Critics complain that vouchers eat up state funding, benefit families who can afford private school on their own, disrupt communities and send tax dollars to schools that face little accountability. Unlike public schools, private schools don’t have to administer state tests. They can pick and choose their students, while public schools must educate everyone.
The modern school choice movement began in 1990 with a small voucher program in Milwaukee and has grown into a central plank of the Republican education agenda, with programs now operating in more than half the states. In 2022, Arizona created the first universal program — open to all, not just low-income families. Since then, about a dozen conservative states have adopted universal or near-universal programs. And in July, President Donald Trump signed into law the first federal voucher program, which will require states to opt in, at an estimated cost of $26 billion over the next decade.
Some stateprograms have now grown so large that spillover effects on public schools are coming into view. In Ohio, the legislature agreed toincrease voucher spending to $1.3 billion by 2027, up from just over $1 billion in 2025, while traditional public schools, which serve far more children, were given a smaller increase — and less than what public education advocates say had been promised under a multiyear agreement to ramp up school spending. In Florida, which has a $4 billion voucher program, public schools districts are seeing enrollment declines, meaning less money from the state and, in many cases, budget cuts.
The ramifications for public education have been particularly clear in Arizona, offering an early picture of K-12 education under the Republican vision of maximum school choice, or what proponents call education freedom. Here, public schools are starting to close.
The challenge: more competition for the same number of students. For the past 15 years, the state’s school-age population has remained steady, though the overall population has grown, said Rick Brammer, principal manager of Applied Economics, a consulting firm that has analyzed enrollment trends, demographic data and the effects of school choice programs in dozens of Arizona school districts.
“You’re taking the same size pie and cutting it into more pieces,” Brammer said. “As we’ve created and funded alternatives, we’ve just emptied out school after school from the districts. In a tight nutshell, that’s the whole story.”
CENTENNIAL, Colo. — Colorado Skies Academy, a Centennial-based charter school with a focus on aviation and aerospace education, abruptly announced its closure on Friday, just 16 days before the start of the school year.
The announcement, which came in an email on Friday at 8:17 p.m., leaves parents scrambling to find alternative schools for their children.
The school cited financial challenges as the reason for the immediate closure. A spokeswoman for the Colorado Charter School Institute, which serves as the school’s authorizer, said there were “unanticipated financial developments” over the summer which, caused the school’s viability to “rapidly deteriorate.”
CSI acknowledged the sudden closure was not ideal, but said it supported the board’s decision to close now, rather risk closing mid-school year which would have been more challenging.
Still, the timing of the announcement has particularly frustrated parents, who received the closure notice hours after the school posted on Facebook about an upcoming back-to-school night event.
“They posted in the morning, come join us for back-to-school night. Then they send an email in the evening saying sorry, there’s gonna be no school at all,” parent Erin Hess said. Her son Connor was set to attend sixth grade at the 6-8 school.
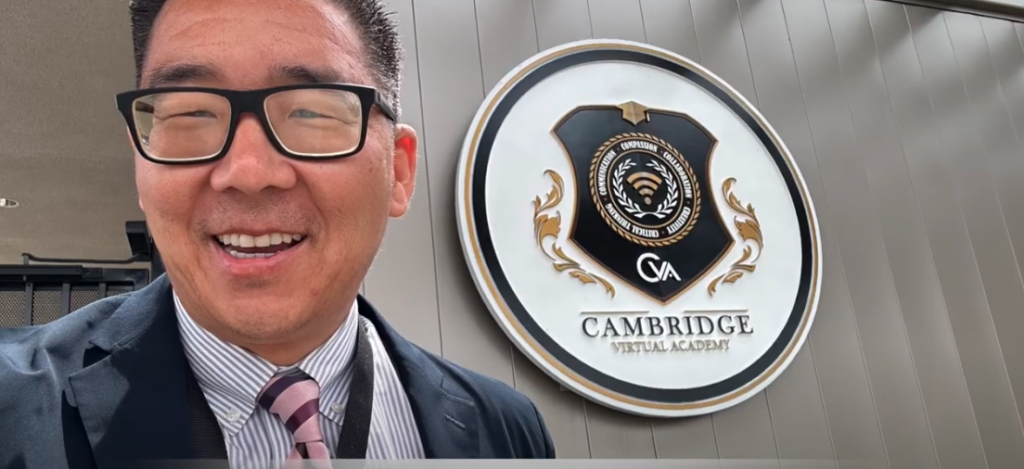
Jeff Kim, a teacher at Cambridge Virtual Academy in Anaheim Union, is teaching the first-ever Korean American ethnic studies course for high school students.
Credit: Courtesy of Jeff Kim
Jeff Kim, a world history teacher in Anaheim Union High School District, had long dreamed about how a Korean American studies course could help his students connect with their heritage. But it was the surge of hatred against Asian Americans during the pandemic that made him realize just how urgently the class was needed.
Shortly before the pandemic reached the U.S., a seventh grade student came up to him before class and expressed concern that she or her family might face anti-Asian violence because of this new virus in China. Although Kim had experienced discrimination in his own life, he wanted to reassure her and so told her that in California, a relatively liberal state, and Orange County — where 23% of students are Asian — she and her family would not face those problems.
“I just said, ‘We live here in California, I don’t see that type of violence happening to Asian Americans here,’” Kim said. “I gave her the wrong information.”
That Kim was wrong became apparent in the early days of the pandemic, during which time a surge of xenophobic rhetoric scapegoated Asian Americans as the cause of the pandemic. It was both a local and national issue. Anti-Asian hate crimes doubled in California in 2020, compared with the prior year. In Orange County, the number of hate incidents against Asian Americans jumped 1,800% in 2020, according to the annual Orange County Hate Crime Report. News of Asian American spa workers in Georgia who were killed in a shooting rampage was a turning point for Kim.
He asked himself, “What is a way I can respond with love and wisdom?”
Fast-forward to this year – the Anaheim Union High School District has launched a first-of-its-kind high school ethnic studies course focused on the experiences of Korean Americans.
For the past three years, Kim worked with district leaders in Anaheim Union High and scholars of Korean American history — many of whom are based in Southern California — to pioneer the first high school course dedicated to Korean American history. It’s a historic moment in the development of Korean American studies, which has been maturing as an academic field in recent decades.
“It’s huge,” said professor Edward Chang, the founding director of the Young Oak Kim Center for Korean American Studies at University of California Riverside. “It’s a starting point, and I’m hoping it will spread to other school districts.”
Chang is the co-author of “Korean Americans: A Concise History,” a book that covers leading figures and highlights in Korean American history in a little over 100 pages, a book he said he conceived with future K-12 students in mind, and which now serves as a textbook for Anaheim Union High’s new course.
The course debuted earlier this month as a virtual course through Anaheim Union High’s Cambridge Virtual Academy and is open to all high school students in the district.
Building the curriculum
The Korean Consulate General in Los Angeles sponsored the development of the curriculum; Kim worked with Grace Cho, a professor in Cal State Fullerton’s department of secondary education, to come up with the components of the proposed course, which consists of seven lessons adapted to California state standards, and available online.
The lessons begin with the earliest wave of 19th-century Korean immigrants and end with K-pop’s global dominance. There are lessons on the struggles and triumphs of key figures, such as war hero and humanitarian Col. Young Oak Kim and Dosan Ahn Chang Ho, the founder of the first American Koreatown.
It’s a class for everyone, said Kim. Other ethnic groups can connect with Korean stories of resilience, such as how gold medal-winning Olympic diver Sammy Lee was barred from practicing in public pools because of his race or how most Koreans were barred from immigrating to the United States before 1965.
“This class is not just about Korean Americans. It’s U.S. history, but through the eyes of Korean Americans,” said Cho. “By learning other ethnic groups’ history, you get to expand your perspectives and views.”
The course will enable students to fulfill the ethnic studies requirement that will go into effect for all California high school students in two years. But many of the first 34 students who signed up for the course simply wanted to learn more about their own cultural background.
Celine Park, a freshman at Oxford Academy, said this class is a unique opportunity for second-generation Korean Americans like her who haven’t had a way to synthesize Korean and American history in their lives.
“I wanted to meld these two together, to make these connections between the two histories and bond my own identity, while helping other second-generation Korean Americans like me,” Park said.
It has also inspired pride in students’ families. Yuri Yamachika, a first-year student at Oxford Academy, said that her mom, a first-generation Korean American, didn’t have many opportunities to learn about her culture beyond what her own parents shared with her.
“She was excited and proud that we have a course to learn about our own heritage,” said Yamachika. “She’s glad I took it.”
Parents are a crucial firsthand source of information in the course. Understanding that every student has an ethnic heritage is a key part of the ethnic studies discipline. Kim encouraged his students, no matter their background, to learn and reflect on their families’ stories.
“Sometimes parents haven’t had a chance to tell these stories, because there’s a language barrier or a cultural barrier,” Kim said. “But if I make it a class assignment, they’re much more inclined to ask — and parents are much more inclined to tell their story.”
That makes the course a draw to students — including those who aren’t Korean American.
When Karina Soliman interviewed her father for a class assignment, she learned about the discrimination he faced as an Egyptian in the post-9/11 era, when Arab Americans were widely stereotyped as terrorists. The senior at Savanna High School connected this to the stereotypes that other ethnic groups in the U.S. have faced. She hopes the course will help her model the importance of respecting others’ stories.
“I’ve grown more cognizant of other cultures and other people, and realizing how important that is,” Soliman said.
Students in Kim’s class will also participate in a civic project of students’ own choosing. This is a facet that has earned the notice of the California Asian American & Pacific Islander Legislative Caucus. In a letter of support, Assemblymember Evan Low and state Sen. Dave Min praised the course for “allowing students to foster collaborations and partnership with Asian American organizations.”
This new course also represents a high-water mark for scholars who have promoted Korean American studies. It was only recently that there was a critical mass of scholars interested in Korean American history, Chang said. There’s a growing interest in the field in higher education, but promoting it at the K-12 level has been a major goal of scholars.
Korean American history didn’t make it into the early drafts of the state’s ethnic studies model curriculum, but scholars pushed back, said Cho. The state’s model curriculum now includes a lesson on the L.A. civil uprising of 1992, known as Saigu or 4/29 among Korean Americans, which marked a turning point in the community’s identity.
Chang said that he looks forward to students like Kim arriving at college. He has seen students’ eyes widen as they learn about their own history. He believes college is too late for that experience.
Kim said in the early days of deciding to push forward with the curriculum, he felt like he was taking a big risk. He worried about how the course might be misunderstood, but he feels like it has paid off. Now he reminds his students of their own role in blazing a trail for the next generation of students. His students are already eager to see that continue.
Soliman has advice for teachers or administrators considering a course like this: “Don’t be afraid to put it out there, or to start a conversation for that kind of course to be created because it can greatly impact and inform a lot of students on topics that they’re not traditionally going to learn about until college.”
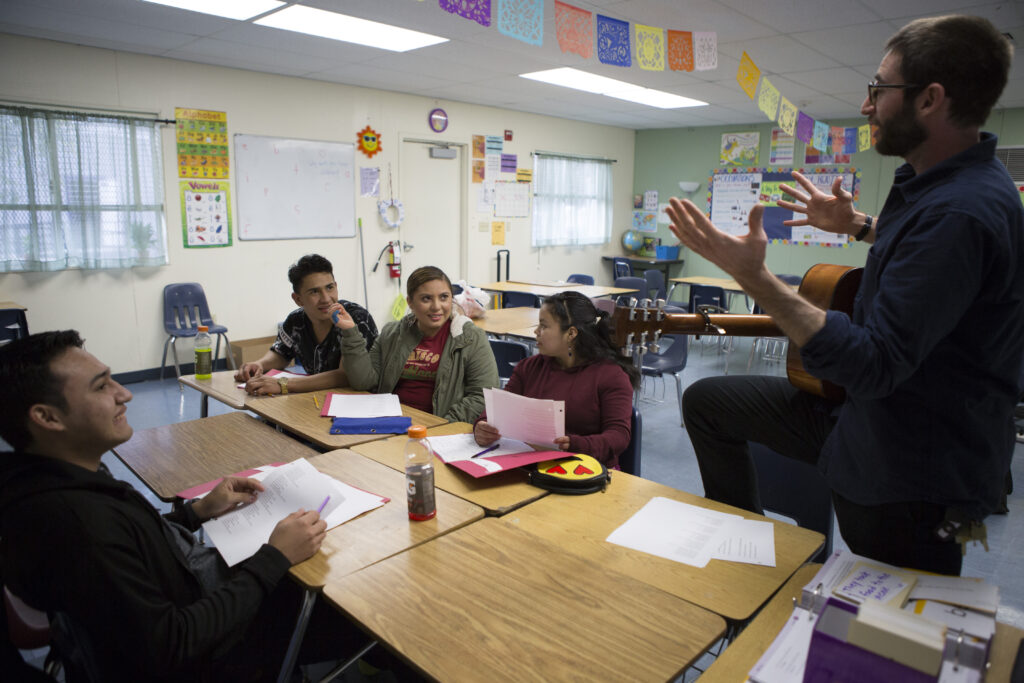
High school senior Martha Hernandez was born in Baja California, Mexico, and came to the U.S. when she was 10 years old, in fifth grade. She was still considered an English learner when she entered high school, based on California’s test of English proficiency.
When students are classified as English learners, they must take English language development classes to improve their language skills, in addition to English language arts and all other academic classes.
But at Hernandez’s high school, Mountain Empire High School in the mountains of rural San Diego County, English learners enroll in English as a second language classes through the local community college. They earn college credit while learning English.
Researchers and advocates say that dual enrollment — taking college courses during high school — can increase rates of graduation, college enrollment and college success. Yet students who are still learning English in high school often face barriers to dual enrollment courses.
According to one study by Wheelhouse: The Center for Community College Leadership and Research at UC Davis, 10% of English learners had taken at least one community college class while in high school, compared with 18% of all students.
English learners are less likely than many other groups to finish the required courses for entering UC and CSU — known as A-G requirements — and to attend college in the first year after graduating from high school. Only 16.8% of students not proficient in English were marked as “prepared” for college and career on the California School Dashboard in 2019, compared with 44.1% of all students.
Hernandez was surprised to get college credit for her English language classes and she says it inspired her to do well in the courses.
“It benefits me more, because if I’m going to learn something, I should gain something, too,” Hernandez said. “I guess that’s a good strategy to make people motivated.”
She says the class helped her learn how to compose a paragraph, structure an essay and give a presentation in English.
After sophomore year, Hernandez tested out of the program. No longer considered an English learner, she enrolled in both AP English and AP U.S. history her junior year. She’s now a senior, and she plans to go to a four-year college after graduation to study to become a doctor.
This dual enrollment program for English learners offered by Mountain Empire Unified and Cuyamaca College is one of several highlighted in a 2020 report by the nonprofit organization Jobs for the Future.
“English learners can rise to the challenge and have better academic outcomes when they have the opportunity to do things like take college courses,” said Sarah Hooker Bentley, director of population-specific strategy for JFF and one of the authors of the report.
Often, Bentley said, district staff believe English learners cannot enroll in dual enrollment courses because they need to prioritize English language development courses or credit recovery courses if they recently arrived from other countries.
“You really can build in the dual enrollments at the same time you’re doing all the other things,” she said.
The report recommended specific strategies as especially beneficial for English learners. One is enrolling these students in college-based English language courses like the ones Hernandez took at Mountain Empire High School.
English learners can also do well if they are able to enroll in advanced college courses in their native languages — Spanish literature, for example, or in courses related to their career interests.
It is crucial to provide extra support for English learners to help them understand vocabulary and grammar that they may need to succeed in college-level courses, Bentley said.
“It’s especially unique if it’s really provided by teachers who have been trained in English learner education,” Bentley said. “That’s the distinction that makes it especially effective for English learners.”
Dual enrollment for English learners works best when courses are specifically designed for them, said April Moore, president of the California Coalition of Early & Middle Colleges, which is dedicated to dual enrollment.
She said English learners need extra time to practice their language skills with each other, learn academic language and help with learning how to take notes.
“If we don’t strategically and mindfully design these pathways for various student groups, we run the risk of perpetuating the gaps that we already see in the data with who is achieving and who is not yet achieving and needs additional support,” Moore said.
Mountain Empire and Cuyamaca College have been offering college courses in English as a second language for high school English learners since 2018.
Superintendent Patrick Keeley said the district noticed that the students enrolled in college English courses had fewer D’s and F’s overall than English learners who were not enrolled in college classes.
“We were trying to draw a correlation: Was that because they were building confidence in themselves that they could achieve in other areas?” Keeley said. “When a student dual enrolls or concurrently enrolls in a college course, I think that has a positive impact for that student because they’re building confidence for themselves taking a college course and walking out with the knowledge, skills and belief that ‘I can go to college.’”
Keeley said students’ scores have also improved on the English Language Proficiency Assessment of California – a test that all English learners must take every year until they earn a high enough score to be considered proficient. He said that 72% of English learners at Mountain Empire High School increased at least one level on the test from 2021-22 to 2022-23. Statewide, 47.5% of English learners increased one level in 2022.
The college courses are held on the high school campus, but once a semester, the students enrolled in ESL courses visit the Cuyamaca College campus.
“They get tours of the different programs at Cuyamaca,” Keeley said. “It’s a way to welcome them to the school and affirm that they are college students.”
Moore said some early and middle colleges also offer dual enrollment English language classes.
“I think that would be a great recommendation or goal for [more] schools to aspire to,” Moore said.
Many school districts are hesitant to offer this type of classes for English learners, in part because the requirements for college-based ESL courses are so different from the requirements for teaching English language development to students in high school, Moore said.
For example, the California Department of Education requires a different number of hours of English language development for students in K-12 than the number of hours required in a college-level course.
Lack of information is also a barrier to English learner participation in dual enrollment courses.
James Espinoza, principal of Middle College High School in San Bernardino Unified School District, said more district staff need to be made aware that they can and should design dual enrollment courses for English learners and other under-represented groups.
“People don’t know they’re supposed to actually target students that are first generation and under-represented. A lot of the success rates are students that might be successful already,” Espinoza said.
Bentley said the more adults at schools know about dual enrollment opportunities for English learners, the better.
“Whether it’s a guidance counselor, their ELD teacher, or a newcomer liaison when a newcomer first starts high school, if those individuals are not well-connected or don’t have strong understanding or knowledge of dual enrollment opportunities and the potential benefits for English learners, it’s even more difficult for that information to get down to students and families,” she said.
Three months ago, in a confrontation over the inclusion of LGBTQ+ content, Gov. Gavin Newsom warned the politically conservative Temecula Valley Unified school board that either it replaces an outdated history social studies textbook for elementary school students or the state would buy an updated version on the district’s dime, and fine it for its recalcitrance.
There was no High Noon, as it turned out. The school board backed down within days and agreed to purchase a more inclusive textbook that a committee of 47 Temecula Valley teachers had recommended.
But Newsom is about to gain the formal authority to head off similar actions by other like-minded school boards. On Thursday, the Legislature passed Assembly Bill 1078, which his advisers helped craft. The nearly party-line votes of 30-9 in the Senate and 55-16 in the Assembly provided the two-thirds “urgency” margin the governor wanted for the bill to take effect as soon as he signs it.
The bill, authored by first-term Assemblymember Corey Jackson, D-Perris, in Riverside County, would expand existing state law, includingthe 2011 FAIR Act, which requires instructional materials to accurately portray the history, viewpoints and experiences of California’s diverse and underrepresented racial, ethnic, and other groups, including LGBTQ+ Californians. It says that school boards that refuse to include materials or remove library books or textbooks that would interfere with the FAIR Act would be committing censorship and discrimination.
“Schools may not adopt textbooks or other materials or sponsor instruction or activities that promote discriminatory bias against or reflect adversely on persons” on a range of characteristics, including race, ethnicity, nationality, gender, gender identity, gender expression, and religion, wrote Newsom, Attorney General Rob Bonta and State Superintendent of Public Instruction Tony Thurmond, a sponsor of AB 1078, in aJune 1 letter that referred to the FAIR Act. It was sent to all county and district superintendents and charter school administrators.
AB 1078 would create a new complaint process for parents and other residents to ask the state superintendent of public instruction to investigate and overrule a board’s book ban if found to violate the FAIR Act or other anti-discrimination laws. California school librarians report that orders to remove books more often come not from school boards but from principals pressured by parents angered by sexually graphic novels or what they consider age-inappropriate books on gender.
In a situation where the superintendent determines that a district school board failed to provide students with sufficient instructional materials in order to avoid FAIR Act compliance, the state department of education would order and provide the textbooks that students needed and fine the district.
Newsom praised the quick passage of the bill Thursday, saying it would send a message to school boards not to put their own political agenda ahead of the education rights of children.
“California is the true freedom state: a place where families — not political fanatics — have the freedom to decide what’s right for them,” Newsom said. “With the passage of this legislation that bans book bans and ensures all students have textbooks, our state’s Family Agenda is now even stronger. All students deserve the freedom to read and learn about the truth, the world, and themselves.”
But Bill Essayli, a first-term Republican assemblymember from Norco, in Riverside County, said that the real intruders on freedom are Newsom and state leaders who are running roughshod over school boards that families chose to elect.
“You have Sacramento politicians who do not like decisions being made by duly elected school boards, and are trying to erode their control and attack their authority,” Essayli said. “This should be viewed as nothing short of an attack on democracy. And that’s something that we must be very vigilant of.”
While Newsom had Temecula Valley and rear-guard tactics of conservative boards in mind, the new complaint system could prompt people with opposite politics to demand action against materials and curriculums they claim are discriminatory. Jewish groups have characterized Santa Ana Unified’s ethnic studies treatment of the Arab-Israeli struggle as anti-Semitic. The newly formed Los Angeles-basedCoalition for Empowered Education, which says it opposes “dogmatic, politicized agendas in K-12 education across the country,” could be motivated to file complaints of bias in the Liberated Ethnic Studies curriculums adopted by some California districts.
Jackson said he foresees complaints against districts that have banned the teaching of critical race theory, a school of thought that analyzes white privilege and the persistent and enduring forms of institutionalized racism. Jackson said districts are banning critical race theory as a means to suppress honest discussions of race. But only an investigation could establish a school board’s true intention, he said.
The problem, Essayli countered, is that “the complaint process is extremely subjective. It puts the determination in the hands of another politician (the state superintendent of public instruction) who has political motives.” Disputes like these should be done by an impartial judge through a lawsuit, he said.
Troy Flint, the school boards association’s chief information officer, said the uncertain scenarios that the bill could produce are a reason CSBA opposed the bill.
“There are a number of different ways that people could apply this law beyond what was intended. That’s a byproduct of the fact that AB 1078 was reactive,” he said.
Flint said the school boards association is troubled that complainants will be able to file directly with the state superintendent, who could intervene without giving school boards an opportunity to respond before making a finding.
Jackson said he wasn’t concerned about people filing complaints. “I really think that no matter what a parent’s concerns are, they deserve to be investigated. Now, they might not like the outcome of the investigation. But this is not meant to exclude people.”
He said he would watch the complaint process unfold. “If the state superintendent or the governor feels like this is becoming a problem, then we will address it with cleanup language next year,” he said.
Incensed by Temecula Valley’s board
Newsom was drawn into the issue by the resistance of Temecula Valley’s newly conservative majority to buy an urgently needed new history-social studies series.
The committee of teachers and parents who volunteered to review proposed textbooks had vetted and recommended Social Studies Alive! Its fourth-grade textbook on California history included a section on the gay rights movement, including the struggle for gay marriage. The majority said they opposed “sexualized” materials for elementary students and the inclusion in a teacher’s guide of material on gay rights activist Harvey Milk, the first gay elected official in California, whom board President Joseph Komrosky denigrated as a pedophile.
The board’s plan to delay that approval meant Temecula Valley would have begun the year with a 17-year-old out-of-print textbook with insufficient copies for every student, a violation of state law. The state already had the authority to order new textbooks and charge the district in such a situation.
The delay also created a dilemma for teachers. As Carolyn Thomas, a Temecula Valley Unified teacher, told EdSource in May, “We also find ourselves in the precarious position of determining how to teach the required state standards while simultaneously complying with our employer’s decision to restrict us from teaching about the historical contributions of diverse individuals.”
AB 1078 would additionally impose a financial penalty, not for a FAIR Act violation per se, but for a district’s intentional inaction to provide all students with enough textbooks at the start of a year. The penalty would amount to what a district received a decade ago when the state still earmarked funding for textbooks and materials, adjusted for inflation. The Legislative Analyst’s Office estimated that would amount this year, in today’s dollars, to about $95 per student or $950,000 for an average district with 10,000 students. For 27,000-student Temecula Valley, that would have been about $2.6 million.
Jackson said he believes other districts with “extremist” boards have adopted Temecula Valley’s strategy of delay — ignoring buying new textbooks because they include covering the deep history of racism in America and perspectives on ethnicity and gender. “So they are gaming the system,” he said.
Essayli said that Jackson is reading into their motives, and “I don’t think that is proper to do.”
AB 1078 had the support of the California Federation of Teachers, the ACLU and some organizations advocating for students of color. Opponents included the county school boards in County and Placer counties, the California Policy Center and the state school boards association.
Student walk up and down the Promenade to Shields Library at UC Davis.
Credit: Gregory Urquiaga / UC Davis
The University of California is joining a national initiative to offer free online courses to students at low-income high schools across the country beginning next year.
The university system is joining the National Education Equity Lab and beginning in the winter term of 2024 will offer two for-credit classes to students enrolled in Title I schools, a federal designation for schools with high numbers of low-income students, UC’s board of regents learned Wednesday. UC is hopeful that the program will allow students — who might not otherwise have access to college courses — the opportunity to take UC classes and get a taste of college.
The classes are free to students, but the participating high schools will need to pay a fee of $250 per student to the equity lab to cover administrative and support costs.
The specific classes that will be offered haven’t yet been determined, but they will be for college credit and are existing courses developed by UC faculty. Currently, 12 other universities participate in the national program. The classes available to students include a poetry course from Harvard, an environmental studies course from Howard University and a bioengineering course from Stanford.
UC will be the second public university to join the partnership and also the second university from California, joining Stanford.
The program will allow the university to expand access to low-income high school students who might not otherwise have a chance to take rigorous courses, said Rolin Moe, executive director of UC Online.
“These courses are focused on establishing that love of learning and that opportunity to show people that they can succeed in college,” Moe added. “A student who gets to say, ‘I took a course from Berkeley,’ or ‘I took a course from Santa Cruz,’ what that means for somebody internally and intrinsically could be all the difference.”
UC faculty will be responsible for creating the course syllabus and course materials as well as developing assessments. Teaching fellows, including UC undergraduate and graduate students, will help facilitate the courses by leading Zoom sessions, grading student work and answering questions. Teachers at the local high schools will also work with UC faculty to help facilitate the courses.
Students across the country and in California can already access college courses through dual enrollment programs that are offered mainly by community colleges. One regent, Jose Hernandez, said during Wednesday’s meeting that he’s concerned UC is “late to the game” and that community colleges have already “cornered the market” when it comes to offering college courses to students still enrolled in high school.
UC’s courses will be different from traditional dual enrollment courses, said Yvette Gullatt, UC’s vice president for graduate and undergraduate affairs, because they will be classes and subjects that students “can’t get in high school or community college.”
She said the courses “resemble our university deep dive courses. These are the things our faculty do so very well. This is their research in the classroom. This is their teaching. So this goes beyond our traditional A through G and our general ed and into those spaces where our faculty’s teaching and research come together.”
The program will also be reaching different students. The students who typically enroll in dual enrollment courses “tend to be a much more middle class constituency,” whereas the UC program will be targeted to low-income students, said Katherine Newman, UC’s provost and executive vice president of academic affairs.
“And it’s that connection to the university world, the four-year university world that I think is going to make this particularly attractive,” Newman added.
A late-session strategy by Democrats in the California Legislature to sabotage a tax-limitation initiative may determine whether citizen groups can propose a school parcel tax requiring only a majority of voters to pass.
The anti-tax initiative, called the Tax Protection and Government Accountability Act and organized by the California Business Roundtable and the anti-tax Howard Jarvis Taxpayers Association, has already qualified for the November 2024 election ballot. Among its provisions would be an expanded definition of taxes to include some revenue sources that state and local governments consider fees, thus making them harder to impose. And it would require all local special taxes — those passed to fund specific purposes, as opposed to general taxes, like sales and income taxes — to require a two-thirds majority to pass.
The initiative is partly aimed at school parcel taxes which, under a 1996 state ballot proposition, are considered special taxes, subject to the two-thirds vote majority. That’s a high threshold, which is why only about 1 in 8 school districts have passed a parcel tax, and only about 60% of the parcel taxes proposed historically have passed, according to Ed-Data. Many districts looked at the barrier and decided the odds of failure were too big to try.
Over the past two decades, two Bay Area state senators proposed lowering the threshold for passing a parcel tax to 55%, the same requirement for passing school construction bonds. But they couldn’t come up with the two-thirds majority in the Legislature needed to place a constitutional amendment on a state ballot. An analysis in 2019 by Michael Coleman, the creator of California Local Government Finance Almanac, found that historically 91% of parcel tax ballot measures would have passed, had the 55% threshold been in effect.
But two years ago, in a decision on a San Francisco ballot measure, a three-judge panel on the San Francisco-based California Court of Appeal unanimously ruled that a parcel tax initiated by citizens — and not put on the ballot by school boards and other government bodies — requires only a simple majority of 50% plus one vote for passage. The state Supreme Court declined to hear the case, leaving the appeals court ruling as the guiding decision.
“The two-thirds majority requirement only benefited wealthy communities that could afford well-funded campaigns,” said Carol Kocivar, a former president of the California State PTA and a frequent contributor to the parent education website Ed-100. “It’s a question of equity, to let voters speak by a majority vote on initiatives brought by the people, not by government.”
However, the victory in court could be short-lived if the Howard Jarvis-Business Roundtable initiative passes in 2024. It would overrule the court decision and require a two-thirds vote for special taxes without exception.
Enter the Democratic lawmakers. Assembly Constitutional Amendment 13, passed in the last week of the legislative session, is written to make the Tax Protection and Government Accountability Act harder to pass. It says that any state ballot measure put on the ballot after Jan. 1, 2024, that would raise the voter threshold for passing taxes would require the same proportion of voters to enact it.
In other words, an initiative raising all special taxes to a two-thirds threshold would need the authorization of two-thirds of voters. That could be hard to get in a tax-liberal state like California. Dozens of labor unions, including the California Teachers Association, and city and county governments supported the legislation.
Jon Coupal, president of the Howard Jarvis group, called ACA 13 “a dagger at the heart” of the initiative and a “cynical attack” on the initiative process that is “too clever by half.”
Assemblymember Christopher Ward, D-San Diego, called it a “common sense measure” to counter a system that allowed a simple majority of voters to impose on future voters a higher threshold to raise revenue.
But Coupal responded that every ballot measure changing the California Constitution has required only a majority vote, including the landmark Proposition 13 in 1978, which requires two-thirds approval of the Legislature for future state tax increases.
Supporters of ACA 13 assert that its provision would take priority, though Coupal disputes that. It’s possible that if both ballot measures pass, the one with the most votes would govern the outcome; based on its polling, Coupal said he is confident that his initiative would prevail.
For cash-strapped districts, a parcel tax subject to a majority vote could be a major boon. With state revenues projected to fall in districts with declining enrollments and an end by Jan. 1, 2025, of the availability of federal Covid assistance, Kocivar expects more districts will take advantage of the option. And the proposed uses for the extra funding might change to better reflect what parents and the community view as priorities. Proponents would still need to gather enough signatures to place an initiative on the ballot — a significant challenge — but qualifying would signal popular support, she said.
Another challenge is the nature of a parcel tax. Because of the provisions of the 1978 anti-tax initiative Proposition 13, the amount of a parcel tax must be uniform and cannot be based on a property’s value. The owner of a mobile home and a 10-bedroom mansion both pay the same amount, from about $100 per year in many districts to upwards of $1,000 annually in wealthy communities. Some recent parcel taxes charge by the square footage of a home or building, generally making it less regressive.
For now, local teachers and parent groups should keep plans for lower threshold parcel taxes in their back pockets until it’s clear that the 2021 Court of Appeal’s decision will prevail.