برچسب: report

  • As protests surge across college campuses, student journalists report from the front lines

    As protests surge across college campuses, student journalists report from the front lines


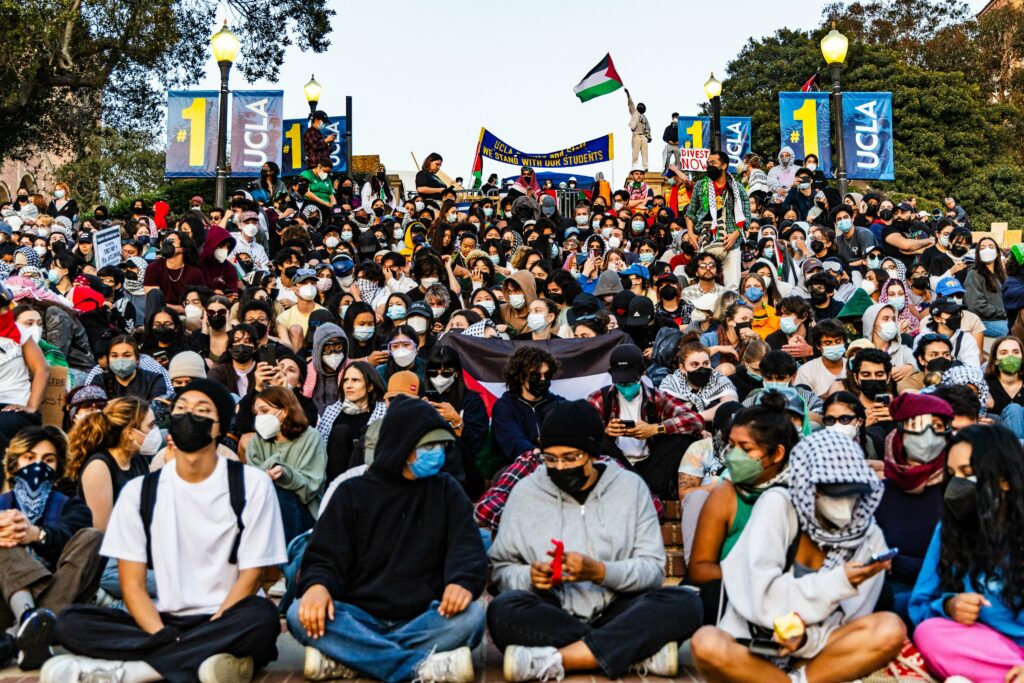
    Hundreds of UCLA students protest in support of Palestinians on May 2, 2024.

    Credit: Christine Kao

    A critical presence persists across the dozens of university campuses nationwide where students have organized demonstrations in support of Palestinians: student journalists reporting for their school newspapers, at times providing round-the-clock coverage and, increasingly, doing so under threats of arrest and violence.

    “They recognize that the eyes of the world are on college campuses and they can be a lens through which people can see what’s happening,” said Christina Bellantoni, director of the Annenberg Media Center at USC.

    Student journalists are central to the reporting of historic national protests calling for universities to divest from companies with military ties to Israel and for a ceasefire in Gaza.

    “We have a job to do as student journalists. I like to say we’re not student journalists, we’re journalists,” said Matthew Royer, national editor and higher education editor at the Daily Bruin, UCLA’s student newspaper.

    At some schools that have shut down access to nonstudents, like USC, a private institution, student journalists are the only regular source of news on campus grounds. And at schools where journalists from outside news organizations are present, like UCLA, student journalists have remained top producers of the most accurate, up-to-date information.

    A post by Matthew Royer from The Daily Bruin at UCLA.

    The Daily Bruin had such high readership this week that its site was down for several hours Wednesday, requiring the newsroom to extend the site’s bandwidth.

    Amid their reporting, some have also become part of the story.

    This week at UCLA, a group of four student reporters were verbally harassed, beaten, kicked and pepper-sprayed by a group of pro-Israel counterprotesters who that night had attacked the on-campus encampment for hours.

    A police officer grabs a protester by the back of their jacket to stop him from moving toward the encampment on May 2, 2024.
    Credit: Brandon Morquecho / Daily Bruin Photo Editor

    At least one of the reporters, Catherine Hamilton, went to the hospital with injuries after the violent assault.

    “Truly, there’s not much time for us to recover. As the new day starts, we have to be prepared for anything to happen,” Hamilton said in an interview with CNN. She returned to her reporting post shortly after being released from the hospital.

    Royer confirmed that UCLA had promised journalists a safe room that night, but “the doors were locked, and they weren’t given access by the hired UCLA security.”

    UCLA has not responded to a request for comment.

    In a statement Thursday, UCLA Chancellor Gene Block said the violence on campus “has fractured our sense of togetherness and frayed our bonds of trust, and will surely leave a scar on the campus.”

    His statement made no reference to the assault on journalists.

    “I think it’s our jobs to continue to do what we can in the safest manner possible,” said Royer, who said counterprotesters have yanked his press badge, blasted megaphones near his ears, and blocked his camera over multiple days while reporting.

    Student journalists nationwide have also been threatened with arrest by police arriving on campus to clear student encampments.

    “We train these students to put safety first,” said Bellantoni. “What I cannot guarantee is that they won’t be arrested in this. If they are arrested, I can guarantee you those charges will not stand and we will make sure that we fight that because journalists have a right to be there and a right to witness it.”

    A man wearing a jacket that reads “Anti Genocide Social Club” records a livestream of a line of CHP officers between Royce Hall and Haines Hall on May 2, 2024.
    Credit: Brandon Morquecho / Daily Bruin Photo Editor

    Protests in support of Palestine are nothing new on UC Berkeley’s campus, according to Aarya Mukherjee, 19, who has covered campus activism and the encampment as a student life reporter for months at The Daily Californian.

    But when he heard Daily Bruin reporters were assaulted, he said he “felt for them.”

    “Last night, there was a very good chance of a raid. … So we were kind of preparing for the same thing to happen to us,” Mukherjee said, noting that the campus has been generally peaceful with little hostility toward the press. “It’s honestly scary, but … we accept that risk. We just hope it doesn’t happen.”

    Given UC Berkeley’s history of protest and constant stream of student activism, managing editor Matt Brown said Daily Cal reporters are uniquely prepared to cover events that may turn violent. For years, guidelines on staying safe have been passed down through the organization’s editors.

    “Everybody’s always in pairs. Everybody’s always taking shifts. Everybody’s always communicating. Nobody goes out there without a press pass,” Brown said.

    Free Palestine encampment at UC Berkeley on April 29, 2024.
    Credit: Kelcie Lee / EdSource

    The Daily Cal published an editorial late Wednesday that expressed solidarity with reporters at The Daily Bruin. It also condemned UCLA for failing to protect campus journalists.

    “Everybody was on board; and within about an hour, we had a draft,” Brown said.

    “We condemn the attackers and any attempt to stifle student coverage,” the editorial read. “It is the community’s duty to safeguard the students who are putting themselves in harm’s way to keep them informed.”

    Many have also collaborated across campuses, a sign of their understanding that they hold a powerful position. The Daily Trojan, the Daily Bruin, the Emory Wheel, The Daily Californian, Washington Square News (NYU), the Berkeley Beacon (Emerson College) and the Daily Texan (UT Austin) joined forces to produce a compilation of photos of protests at their respective campuses.

    ‘That’s our Achilles’ heel’

    Mercy Sosa, 22, received a tip that protests were starting at Sacramento State University on Monday at 6 a.m.

    As editor-in-chief of The State Hornet, she got to work. By 6:30 a.m., she was on the scene — and continued to report on developments at the encampment for the next two days despite upcoming final exams.

    “The amount of walking I did, the amount of not sleeping that I did — it’s exhausting,” Sosa said. “But I felt like it was my duty to be there and to make sure that students knew what was going on. And this isn’t just a Sac State story: This is a national story. … I couldn’t just turn a blind eye.”

    The campus announced the encampment could remain intact until May 8. Unlike at other campuses, student reporters at Sacramento State haven’t faced aggression from campus or other stakeholders. The environment, Sosa said, has been mostly peaceful, with some counterprotesters and few police.

    It’s similar at Sonoma State University, where Ally Valiente’s team at the Sonoma State Star are covering their growing student encampment.

    But the current calm hasn’t made it easier for them to stomach the violence that played out at UCLA.

    Daily Bruin homepage on May, 1, 2024.
    Daily Bruin homepage on May, 2, 2024.

    “It sort of makes me scared this could actually happen to any campus,” said Valiente, news editor.

    Being a member of student media, where reporters and protesters can interact student-to-student, has played a key role in developing trust with sources, who are sometimes classmates, according to Chris Woodard, a managing editor at The State Hornet.

    It’s a unique level of access that Brad Butterfield leaned into while reporting for Cal Poly Humboldt’s The Lumberjack, along with his knowledge of campus grounds.

    Not all reporters covering Humboldt’s protests understood “how complex our campus is,” he said, which impacted police when it came to “gaining control.”

    They also often work alongside journalists from other publications, who at times forget they are students.

    Woodard recalled being in line for an interview by the encampment alongside a half dozen reporters from other publications.

    “I kind of went up to all the other publications like ‘Hey guys, if you can please do me a favor and let me do the next interview? I have to go to class,’” Woodard said.

    “I could tell this by the reaction of all the other professional journalists they’re like, ‘Oh, yeah, that’s a thing for you.’”

    They let him go ahead — and he made it to class 20 minutes late.

    Mukherjee and his Daily Cal colleagues are taking shifts to cover the protests and encampment, sometimes reporting in the field for 24 hours straight in the days leading up to final exams.

    He said a relentless news cycle has made it harder to focus on school and that it is sometimes hard to separate life as a student from life as a reporter.

    “Students should obviously be studying, hitting the books,” Mukherjee said. “Because of the constant news, we feel as though … we have a responsibility to report that, kind of, almost supersedes our due diligence as students.”

    Others, like The Lumberjack’s Butterfield, did not attend class once protests began.

    “Because I am a journalism major, I think that’s important to note: I don’t feel like I’m missing out too much on what’s happening in my classes because I’m out in the field doing what I’m going to school to learn how to do,” said Butterfield, 26. “When there’s a massive and important story on our campus to cover, at least my professors have been pretty lenient in understanding that that does take its priority in a lot of ways — and I’ll catch up on my work at some point in the next week or two.”

    With local newsrooms growing sparse, Sosa said student press has become increasingly important in filling that void of local coverage for both the campus and larger community.

    But in communities like Humboldt, student coverage is sometimes nonexistent over the summer.

    “I think that’s our Achilles’ heel, when the semester ends a lot of folks kind of go their own separate ways, especially here in Humboldt County ’cause there’s so little jobs,” said Butterfield.

    Woodard also said that “it’s hard to bear that pressure” for being at the forefront of national reporting as a student.

    “You’ve become the No. 1 news source for the biggest story in the country. But at the same time, we have finals next week,” said Woodard, 30. “It’s like, which one do I take more pride in?”

    A few days ago, he said he sat on the floor of his apartment and cried.

    The toll, he said, can be especially difficult on editors — who are not only going to school and contributing to coverage, but also managing teams of their peers and classmates, often in their late teens or early 20s.

    “Being an editor of student media and being an editor in real media are two very, very different things,” Woodard said. “For all the student editors out there that are dealing with this: I hope everyone just gives them a hug.”


    Source link

  • A Personal Report to My Friends Who Read the Blog

    A Personal Report to My Friends Who Read the Blog


    I spent this past weekend at my sixty-fifth reunion at Wellesley College. Since I graduated in 1960, I have never missed one. Part of my faithfulness is grounded in nostalgia, in a chance to relive a wonderful part of my life. The four years at Wellesley were transformative, and today my closest friends are classmates.

    The high point of the weekend is the parade of alumnae on the last day. The youngest cohort goes first, marching about 3/4 of a mile from one end of the campus to the center, called Alumnae Hall. As each group reaches its destination, it stops and lines the road. Then along comes the next group of graduates, five years older. Eventually the road is lined with alumnae from different cohorts, with the oldest ones marching last. That was my group, about 50 women in their mid-80s. The group behind us was the class of 1955, mostly 92 years old, riding in antique Fords, Model A.

    1931 Model A Ford

    Since we were the last grads standing, we marched past all the younger groups, and they cheered us vigorously, while we applauded them.

    What was striking was to see the demographic changes over time. Our class was all white, though we did have a few Asian students.

    The classes of 1965 and 1970 had a few nonwhite faces.

    Starting with the graduates of 1975, the numbers of African American, Hispanic, and Asian students noticeably increased. Every class from that point was markedly diverse.

    I have to say it filled me with pride to see how my Alma Mater had changed.

    An example: when I arrived at our lodgings, there were students to help us settle in. A beautiful and vibrant young woman brought my luggage to the room. I asked her where she was from. “Rwanda,” she said. “Do you like Wellesley?” She replied, “I love it!” She is majoring in biochemistry and plans to be a medical doctor and to return to Rwanda. Again, I was proud of how my college was changing the world for the better.

    But there is another personal note that I wanted to share with you.

    In late February, I went for my annual mammogram. The test spotted an anomaly. Several mammograms and a sonogram later, the doctor told me I had breast cancer. In April, I had surgery and the cancer was removed. But the surgeon reported that she didn’t get it all, so I had a second surgery. The pathologist decided that it was all out. None of it was painful.

    But that’s not the end of the story. I start radiation on June 2, which will be five treatments in five days. Then a daily pill, all for the purpose of ensuring that the cancer doesn’t return.

    I am not worried or frightened. I’m taking it all a day at a time, knowing that my case was caught early and that I have excellent doctors.

    Frankly, I am truly worried about my beloved dog Mitzi. She was diagnosed with cancer in 2023, we took her to an oncologist, he put her on a drug that worked, and in June 2024, he declared her cancer-free. But a few weeks ago, we noticed that something bad was happening to her skull. The oncologist said she apparently has a trigeminal nerve sheaf tumor. Her head, on the right side, is noticeably recessed. That is, it’s caved in above her eye.

    I am much more worried about Mitzi than about myself. I will be fine. She won’t be. There is no treatment for her medical problem. So we intend to love her, spoil her, make every day a good day for her.

    I love this sweet dog
    When Mitzi met Martha Stewart in Greenport
    A beauty


    Source link

  • Report shows few California college students enroll in CalFresh, despite qualifying

    Report shows few California college students enroll in CalFresh, despite qualifying


    At the University of California, Irvine, the basic needs center offers a food pantry, housing support and more to meet students’ basic needs.

    Photo: UCI Basic Needs Center

    Few college students participate in the state’s CalFresh food program despite being eligible, according to a report published Tuesday by the University of California’s California Policy Lab.

    The report, “Filling the Gap: CalFresh Eligibility Among University of California and California Community College Students,” is the first to link together datasets that provide estimates on the number of California college students who are eligible for CalFresh, the state’s food benefits program, in addition to their take-up rate — the share of students who are eligible and also participate in the program.

    The report’s authors found that CalFresh eligibility and students’ subsequent enrollment in the program depended significantly on which institution of higher learning they attended, age, housing situation, and other factors. The school they were enrolled in was often connected to the level of outreach they received informing them of the food benefits program and whether they received a certain financial aid grant that made them eligible for CalFresh.

    “California in the last few years has been increasingly focused on this channel of potential support for college students. It’s one of the pieces that students can paste together to put together a financial package that allows them to go to college,” said Jesse Rothstein, report co-author, about the CalFresh program.

    CalFresh, once known as food stamps, is designed to provide money for groceries for California residents, making it a significant support program for low-income students. College students are typically eligible for CalFresh if they meet the regular rules that everyone, whether a student or not, must meet, in addition to at least one of more than a dozen exemptions. Understanding the long list of eligibility criteria specific to students has long been seen as a significant barrier for students, according to the report.

    “But because CalFresh is run by a different agency — it’s not part of the education system — I think it’s hard for students to navigate,” said Rothstein, Carmel P. Friesen Professor of Public Policy and Economics at UC Berkeley and the faculty director of the California Policy Lab’s UC Berkeley site.

    The data for the report was collected by the UC’s California Policy Lab from four institutions: California Community College Chancellor’s Office, University of California Office of the President, California Department of Social Services and California Student Aid Commission.

    In gathering data from these four agencies, the authors developed a database connecting college enrollment numbers, monthly CalFresh participation records, and annual federal financial aid (FAFSA) details.

    The data points to differences in eligibility and take-up rates between students in the California community colleges and the UC campuses as well as which students actually enroll to receive the benefits if they are eligible.

    Data from the fall of 2019, the semester immediately prior to the Covid-19 pandemic, provides one of the clearest examples. During that time, the data showed a significant discrepancy between students who were eligible for CalFresh versus those who applied to receive the food aid — and further disparities depending on whether students were enrolled in a community college or a UC.

    They found that 20% of community college students, 33% of UC undergraduates and 7% of UC graduate students were likely eligible for CalFresh. Yet just 26% of eligible community college students, 22% of eligible UC undergraduates, and 27% of eligible UC graduate students actually enrolled to receive CalFresh benefits.

    The authors suggest a few reasons for the discrepancies.

    First, UC students are less likely to live at home with their parents, increasing their chances of being eligible for CalFresh.

    Second, students in the community colleges are overall less likely to be eligible for CalFresh. This is because “the version of the Cal Grant given to UC students qualifies many of them for CalFresh eligibility, but the version given to CCC students does not,” per the report’s authors.

    And, finally, the UC has increased outreach efforts to enroll more eligible students into basic needs programs like CalFresh. This would explain, the authors wrote, why the take-up rate among UC undergraduates has increased substantially since 2017, while the same rate among community college students has declined.

    The authors note that they can only provide data estimates in the report because the multiple eligibility determination factors may be captured inaccurately, although errors were likely insignificant and “our estimates are a good approximation of the share of students who would be found eligible under individualized determinations.”

    A deeper look into data from the fall of 2019 highlights important details, including:

    • The Central Coast’s UC Santa Barbara had the third-highest eligibility rate at 37% but the highest take-up rate at 37%
    • Of the community college regions statewide, the Central Valley had both the highest eligibility rate at 29% and the highest take-up rate at 33%, while the Bay Area had the lowest eligibility rate at 15% and the lowest take-up rate at 20%
    • Black and Latino students were more likely to be eligible than white or Asian peers regardless of the institution attended
    • When it came to actually enrolling in CalFresh, Black and Latino students were more likely to do so if attending a UC, but Latino students were less likely to enroll in the program if attending a community college
    • Students over the age of 23 had higher take-up rates than those 23 years and younger at both institutions

    Some of those details were expected given the history of outreach out of certain institutions. Santa Barbara County and UC Santa Barbara, for example, have long worked toward smoothing out the process for students to both determine their CalFresh eligibility and to apply for the program.

    Other details, such as the low take-up rates in Los Angeles and the San Francisco Bay Area, highlight the potential need for additional outreach in regions with increasingly high housing and cost of living expenses. Among community college students in Los Angeles, just 5% of the population were both eligible and participating in CalFresh during the fall of 2019. That number is 3% during the same timeframe in the Bay Area.

    The development of a new dataset

    The report included data from millions of students who attended UC and community college campuses between the 2010-11 and 2021-22 school years. While the report’s authors were largely focused on the most recent data, they included previous years’ data that was consistent across the four agencies they had data sharing agreements with — and this happened to take them as far back as the 2010-11 school year.

    The bulk of the project took about four years to complete, according to Rothstein, who noted that this project took “longer than most” he’s worked on in his career. The team first needed to execute data sharing agreements between each of the institutions included in the report and then clean it up to ensure accuracy.

    “It’s really beyond the ability of the individual agencies to do this kind of project,” said Rothstein.“It just takes too long and requires too much collaboration between agencies.”

    Notably missing from the institutions that shared their data was California State University, which is the nation’s largest four-year public university system.

    The CSU “was more reluctant” to share their data, said Rothstein, and his team decided to move forward without that system’s information. He noted that his team plans to work on another edition of the report in which they hope to be able to include CSU data.

    “Our hope is that by kind of developing long-term relationships with the agencies we can build the trust that’s required to do this kind of project,” said Rothstein. “We can also build the kind of specialized knowledge of the individual data sets that makes it possible.”

    The story has been updated to reflect changes made to the report by the California Policy Lab.


    Source link

  • California ranks bottom third in overall child well-being, per new report

    California ranks bottom third in overall child well-being, per new report


    LAUSD’s Nueva Vista Elementary School in Bell.

    Photo Credit: Betty Márquez Rosales

    California’s children rank in the bottom third of all states in overall well-being, according to a new report released this week.

    The authors of the report, “2024 KIDS COUNT Data Book: State Trends in Child Well-Being,” found that over half of California’s 3- and 4-year-olds are not in school, less than one-fourth of its eighth graders are proficient in math, and a greater number children and teens per 100,000 died than in previous years.

    “One way to think about it is where we see the most progress are the states who are investing in their children — heavily in their children,” said Leslie Boissiere, vice president of external affairs at the Annie E. Casey Foundation, who oversaw the compilation of the report.

    Now in its 35th year and published by the foundation, a private philanthropy and research organization, the annual report measures children’s well-being across 16 indicators within the categories of education, economic well-being, health, and family and community.

    Out of all states, California ranked 43rd in economic well-being, 35th in education, 10th in health, and 37th in family and community.

    California’s children fared better than most other states only in the health indicator. Even so, the number of babies with low birth-weight slightly increased from 7.1% in 2019 to 7.4% in 2022, as did the number of child and teen deaths, rising from 18 per 100,000 in 2019 to 22 per 100,000 in 2022.

    “The movement in indicators generally follows investments, and it depends on the particular state of how they’re investing in their children,” Boissiere said.

    This year’s report largely focused on comparisons between 2019 and 2022 data to provide a pre-pandemic and post-pandemic view of how children are faring, Boissiere said. Sources for the data included the U.S. Census Bureau, U.S. Department of Education, the National Center for Education Statistics, the National Assessment of Educational Progress, and the Centers for Disease Control and Prevention.

    Impact of low well-being on chronic absenteeism

    The authors noted that the report’s findings provide context to the conversation on chronic absenteeism, which is defined as missing 10% or more of the school year.

    The percentage of chronically absent students in California skyrocketed from the pre-pandemic rate of 12.1% in the 2018-19 school year to 30% in 2021-22. The reasons for such high absenteeism vary from district to district and even from student to student, but experts agree that the issue is exacerbated when children’s basic needs are not being met.

    “What we know is that it’s critically important that all children arrive in the classroom ready to learn and, in order for them to be ready to learn, their basic needs have to be met,” Boissiere said.

    National data included in the report highlighted the relationship between absences and academic performance. The more students miss school, the lower their reading proficiency.

    In 2022, the percentage of fourth-grade students nationwide scoring proficient at reading was 40% for students with zero absences in the month before they took the National Assessment of Educational Progress, or NAEP. Reading proficiency lowered to 34% with one to two absent days in that month; to 28% with three to four absences; 25% with five to 10 absences, and down to 14% for students who had more than 10 absences in the same one-month time frame prior to taking the NAEP.

    The authors also found that racial inequities play a critical role in nearly all the index measures in the report.

    “As a result of generations-long inequities and discriminatory policies and practices that persist, children of color face high hurdles to success on many indicators,” the authors wrote.

    For example, the authors found “alarming increases” in the rate of child and teen death rates among Black children nationally, and that American Indian or Alaska Native children “were more than twice as likely to lack health insurance.”

    Disaggregating racial demographic data also pointed to notable inequities.

    For example, authors found that Asian and Pacific Islander children experienced one of the lowest rates of poverty nationally at 11%; the rate of poverty among Burmese children was 29%, 24% for Mongolian children, and 23% for Thai children. The national average for child poverty is 16%, per the report, highlighting the stark poverty rates for many Asian children nationwide.

    Looking at distinct racial inequities, the authors found exceptions where children of color were faring better than the national average. For example, Black children were more likely to be in school at ages 3 and 4, to be insured, and to have a head of household with at least a high school diploma. Latino children and teens had lower death rates, and they were also less likely to have low birth-weight.

    “Today, kids of color represent a majority of the children in the country, as well as in 14 states, the District of Columbia, Puerto Rico and the U.S. Virgin Islands,” the authors wrote. “The future success of our nation depends on our ability to ensure all children have the chance to be successful.”


    Source link

  • California School Dashboard lacks pandemic focus, earns a D grade in report

    California School Dashboard lacks pandemic focus, earns a D grade in report


    Credit: Alison Yin / EdSource

    National surveys have determined that parents significantly understate how far behind children are academically because of pandemic learning setbacks. The A’s and B’s  that their kids have been getting on their report cards don’t tell the full story, concluded a survey of 2,000 parents .

    “To hear parents tell it, the pandemic’s effects on education were transitory. Are they right to be so sanguine? The latest evidence suggests otherwise,” wrote education professors Sean Reardon of Stanford and Tom Kane of Harvard.

    States’ websites that annually report the scores on standardized tests and other valuable data, like chronic absenteeism, could provide a reality check by clearly and easily displaying performance results over time. However, the California School Dashboard, the public’s primary source for school and district performance data, has failed to do that. The Center on Reinventing Public Education concluded this in the report State Secrets: How Transparent Are State School Report Cards About the Effects of COVID? issued Thursday. California was one of eight states to receive a D grade on an A-F scale, behind the 29 states that did better, including 16 states with an A or B.  

    The report focused on how states handled longitudinal data — showing changes in results over multiple years — from pre-Covid 2018-19 or earlier to now. In most states, that multiyear look would show a sharp drop on the first testing after the pandemic, followed by a slow recovery that has not made up for lost ground. For California, the decline in 2021-22, following two years of suspended testing, wiped out gradual gains since the first dashboard in 2014-15.

    “The (California) dashboard makes it hard to identify longitudinal results,” said Morgan Polikoff, professor of education at the USC Rossier School of Education and the lead author of the report. “Because the dashboard never puts yearly data next to each other; you have to pull up multiple years, download the data, and put the data in Excel or something like that if you want to look at longitudinal trends.”

    By contrast, one of seven states to receive an A, Connecticut shows five years of results in bar charts and line graphs for 11 measures.

    Connecticut’s dashboard, praised in the report, shows changes over time for multiple performance measures.
    Source: Connecticut’s Next Generation Accountability Report

    “If we had rated states on something else (e.g., how clearly they presented data for the given year), we would have arrived at different ratings,” the report said.

    Researchers examined longitudinal data for seven metrics: achievement levels in English language arts, math, science and social studies, achievement growth in English language arts and math, chronic absenteeism, high school graduation rates and English learner proficiency and growth. Teams of evaluators from the center, which is based at Arizona State University, used a point system for each metric based on whether it was easy, somewhat difficult, much too difficult or impossible to find longitudinal data.

    “It’s not about having the data — it’s about presenting the data to the public in a way that’s usable,” Polikoff said of California’s dashboard.

    California collects the data for five of the seven metrics. It no longer administers a statewide social studies test. It also doesn’t compile achievement growth using students’ specific scores over time, although the state has been considering this approach for more than six years. Instead, it compares scores of this year’s students with different students’ scores in the same grade a year earlier.  

    Some other states also don’t give a social studies test; California could still have gotten an A grade without it, Polikoff said.

    The California Department of Education said that the dashboard undergoes an annual review for refinements to make sure it is “genuinely accessible and useful to our families.”

    “We always remain open to the feedback and needs of our families, and we look forward to understanding more about the approach taken by the Center for Reinventing Public Education,” Liz Sanders, director of communications for the department, said in a statement.

    She added that School Accountability Report Cards and DataQuest supplement the dashboard and can readily answer questions raised by the Center for Reinventing Public Education. “The dashboard serves a specific purpose to help California’s families understand year-over-year progress at their students’ schools, and the user interface is simplified based on feedback from diverse and representative focus groups of California families,” Sanders said.

    Not a priority

    At the direction of the State School Board, the California Department of Education chose to focus on disparities in achievement as its top priority for the dashboard. For every school and district, it has made it easy to see how 13 student groups, including low-income students, students with disabilities, English learners, and various racial and ethnic groups performed on multiple measures.  

    The state developed a rating system using five colors (blue marking the highest performance and red the lowest). Each color reflects the result for the current year combined with the growth or decline from the previous year. The colors send a signal of progress or concern. 

    However, without reporting longitudinal results for context, the color coding can prove problematic. The statewide chronic absence rate in 2022 was a record high of 30%. Declining 5.7 percentage points in 2023 to 24.3% earned a middle color, yellow signifying neither good nor bad. Yet the chronic absence rate was still at an alarmingly high level. Viewers would have to look closely at the numerical components behind the color to understand that.

    No ability to compare schools and districts

    Unlike some other states’ dashboards, the California School Dashboard also does not permit comparisons of schools and districts. That was by design. Reflecting the view of former Gov. Jerry Brown, the state board focused on districts’ self-improvement and discouraged facile comparisons that didn’t consider the data behind the colors. 

    However, both EdSource’s annual alternative dashboard and Ed-Data, a data partnership of the California Department of Education, EdSource, and the Fiscal Crisis and Management Assistance Team/California School Information Services, encourage multi-school and district comparisons.

    Ed-Data has a five-year comparison of test scores and other metrics. Although this year it no longer starts with 2018-19, the pre-Covid base year for comparisons, viewers can use the year slider above the charts to view data for earlier years.

    EdSource has created graphics showing longitudinal statewide results in math and English language arts, including breakouts for student groups, dating to the first year of the Smarter Balanced testing.

    “If California had reported all of the outcomes in a format like that, it would’ve gotten an A because that’s exactly the kind of comparison we are looking for,” Polikoff said.

    The report separately analyzed the usability of states’ dashboards to determine whether they are easy to use and well-organized. California is one of 16 states rated “fair,” with 23 states rated “great” or “good,” and 11 states, mainly small states like Vermont, but also Texas and New York, rated “poor.”

    “We were struck by how difficult it was to navigate some state report card websites,” the report said. “We found many common pitfalls, ranging from the relatively mundane to the massive and structural.”

    Kansas, for example, lacked a landing page with overall performance data, while Texas school report cards “offer a wealth of data broken down by every student group imaginable” in massive data tables but no visualizations.

    The five states with “great” usability are Illinois, Indiana, Oklahoma, Idaho and New Mexico, the last two of which got an F for longitudinal data.

    “California’s dashboard is far from the worst out there,” said Polikoff. “The reality is little tweaks are not going to cut it. That probably means a pretty substantial overhaul to be usable for longitudinal comparisons. Now, the state might say, ‘We don’t care about longitudinal trends’ and that’s their prerogative, but what purpose is the dashboard trying to serve, and who’s it trying to serve?”

    Answer those questions, he continued, “and then design the dashboard accordingly.”


    Source link

  • Pandemic recovery in schools will be a ‘long slog,’ says sobering national report

    Pandemic recovery in schools will be a ‘long slog,’ says sobering national report


    Student mental health was declining even before the pandemic, research has shown.

    Alison Yin for EdSource

    Nearly five years after Covid-19 began, a national report released Tuesday shows that recovery from the pandemic for students will be a “long slog.”    

    “The State of the American Student,” a report by the Center for Reinventing Public Education (CRPE) states that the findings are “sobering, daunting, and discouraging,” and that the slow pace of recovery from the pandemic has left an indelible mark on education, with long-term implications for students’ income, racial inequity and social mobility in the United States. 

    “If policymakers and educators do not get serious about ensuring these students have access to proven interventions, then we will continue to see the educational impact of the pandemic reverberate for many years, both in our schools and in our economy,” the report stated.

    For the last three years, CRPE — a research organization out of the Mary Lou Fulton Teachers College at Arizona State University — has released annual reports examining the academic, social, emotional and mental health effects of the pandemic on students. CRPE Executive Director Robin Lake said the reports were an attempt to ensure that schools wouldn’t go back to business as usual before students were “made whole.”

    Fears that the pandemic would widen pre-existing opportunity gaps have come to fruition, according to the report’s summary of a wide span of research. The report focuses extra attention on certain groups: young children, disabled students, English learners and homeless students, and students who still lag far behind from where they would have been if not for the pandemic. Lake added these groups were largely not well served by schools before the pandemic began.

    The report takes a sweeping look at the issues that have been harming students’ recovery since 2020, including chronic absenteeism, staffing shortages, poor teacher morale and student disengagement. These are all signs pointing to a pandemic recovery effort that will require a “long haul.”

    Struggling students need more attention

    Currently, schools are facing “gale-force” headwinds trying to address these challenges, the report states. Pandemic-era funding is drying up, declining school enrollment is stretching district finances, and many educators are facing burnout. But the worst part is that the problem is underappreciated, Lake said.

    “Perhaps the most concerning thing to us is how little discussion there is about these problems,” Lake said. 

    Politicians are not talking about pandemic recovery, especially when it comes to the groups that have been struggling the most, she said. For instance, CRPE pointed out how some states, including California, do a poor job communicating data about how students have fared since the pandemic.

    Additionally, parents do not seem to know just how far behind their children are — thanks in part to grade inflation and some schools’ poor communication, Lake said.

    USC’s Center for Economic and Social Research conducted interviews with the parents of disabled students.

    One parent did not learn from the school that their child was failing two courses, making him ineligible to graduate from high school: “I didn’t know until we were in the process of graduation,” the parent told interviewers.

    The number of students who are served under the Individuals with Disabilities Education Act has skyrocketed in recent years. It dipped during the peak of the pandemic when school campuses were closed, but surged again as students returned to the classrooms. It’s not clear why, but different theories have emerged.

    While it states that kindergartners who have not attended preschool are more likely to have academic and social struggles, including a rising number of behavioral issues and speech delays, the report notes that students who start school behind their peers may be being over-identified as having a disability or that the high numbers could be because students who might have simply been treading water in a previous era are now being correctly identified as having a disability.

    The problems faced by disabled students exemplify many of the biggest struggles of pandemic recovery efforts in schools. Disabled students’ academic performance has long lagged behind other students, but that gap has widened in the wake of the pandemic. The teacher shortage is particularly acute among special education teachers, now that they are needed most. Meanwhile, some effective efforts, such as tutoring, are not reaching disabled students. Low expectations for students with disabilities is a crisis that has failed to garner proper attention and resources, Lake said.

    One parent interviewed for the report said that getting help for their disabled students required constant fighting. “Multiple times, they promised in-person, in-school tutoring — which they just were understaffed and were never able to find anyone,” the parent said.

    Another parent said that without speech therapy, their son with epilepsy fell behind in school during the pandemic.

    “He fell further behind because my husband and I tried our best, but we can only do so much if you’re not a teacher, which is very frustrating,” the parent said in an interview.

    Recovery solutions are straightforward

    The strategies that helped schools recover have “not been rocket science,” Lake said. 

    Many schools have been successful with programs such as tutoring, high-quality curricula, extending learning time and improving communication with parents. Some schools are making these strategies a permanent part of the school experience, which is good news: Tutoring and small-group instruction are some of the most powerful tools schools have at their disposal, the report states.

    But scaling can be tricky, and many of the students who need help the most are not getting it, CRPE notes. Fewer than half of students who most needed that help enrolled in summer school, according to a Rand study, and just 1% of eligible students in Louisiana enrolled in a tutoring program for struggling readers.

    The report recommends focusing on the specific needs of struggling students, such as students with a disability or English learners, rather than so-called average students. Addressing the issues that these students are struggling with will pay dividends for the broader student population, Lake said.

    Some schools are demonstrating that recovery is possible, even if it’s not the dominant story right now. Students and educators alike are struggling, but there is a renewed understanding of the crucial role that school plays in a community. That has led to some schools rebuilding and strengthening that institution.

    “During the pandemic, you remember, there was so much talk about more joyful education, more engaging, more flexible,” Lake said. “We think that that has actually taken hold.”


    Source link

  • College is one of life’s ‘biggest investments.’ A new report asks — is it worth it?

    College is one of life’s ‘biggest investments.’ A new report asks — is it worth it?


    Credit: Julie Leopo / EdSource

    A new report released by the College Futures Foundation finds that while a large majority of California college programs allow graduates to recoup the costs of their postsecondary education in five years or less, a handful leave recent graduates earning less than the typical Californian with only a high school education. 

    The report by researcher Michael Itzkowitz of the HEA Group finds programs that did not result in recent graduates earning more than people with a high school diploma were concentrated at private, for-profit colleges. The paper flags such programs as having no economic return on investment.  

    By contrast, all programs analyzed at the California State University and the University of California had a positive return on investment, measured as the difference between the median graduate’s earnings five years after graduation and the median earnings among Californians aged 25 to 34 with no college education. Less than 1% of programs at both university systems were expected to take more than 10 years to pay off.

    Eloy Ortiz Oakley
    Credit: College Futures Foundation

    Eloy Ortiz Oakley, the president and CEO of the College Futures Foundation and a former chancellor of California Community Colleges, said the report is a response to survey data highlighting increasing skepticism about the value of higher education amid its rising costs. 

    “Paying for a higher education is, in many ways, one of the biggest investments that a student or their family is going to make in their life, second probably only to a mortgage,” he said. “If you think about it, people get a lot more information about other investments that they’re going to make, or other indebtedness they’re getting into, than they do when they invest in an institution of higher education. So we want to make sure that there’s greater transparency and more information for the student and their families when they’re investing in higher education.”

    Oakley said the report is not a judgment on whether a particular academic program should be offered as a result of its economic payoff. Rather, he said the report aims to help Californians to think of a college or university’s value less in terms of its acceptance rate and more in terms of its potential for increasing graduates’ economic mobility.

    Defining ‘return on investment’ 

    The report, “California College Programs That Pay,” analyzes data from the U.S. Department of Education’s College Scorecard to understand the earnings of roughly 260,000 people who graduated from undergraduate certificate, associate and bachelor’s degree programs in California with support from a federal loan or grant.

    Looking at 2,695 programs across 324 institutions, Itzkowitz compared students’ out-of-pocket costs for a credential to the additional money they earn as a result of completing it.

    To judge how much a postsecondary program costs, the study uses colleges’ self-reported data on how much students are responsible for paying after deducting grants and scholarships. That figure includes not just tuition, but also fees, books, supplies and other living costs. This net cost is used to calculate a price-to-earnings premium, a measure of how many years it will take to recoup the cost of a credential. 

    The study makes a couple of simplifying assumptions to calculate that premium. 

    The first is that students will take one year to earn a certificate, two for an associate degree and four for a bachelor’s degree. Those assumptions are not true for many students in practice. For example, only about 36% of Cal State first-year students who started in 2019 completed their degrees in four years. In cases where finishing a program over an extended period of time would be more expensive, the study could underestimate students’ actual costs.

    A second assumption is that every program offered by a given institution cost the same, since cost breakdowns for given fields of study were not available. 

    Finally, the study universe is limited to students who graduated, not those who started a program but didn’t finish it. Previous research suggests students who start a college program but don’t receive a credential tend to earn less than graduates, Itzkowitz said, and are more likely to struggle to pay down debt.

    Report highlights

    Across all programs included in the study, Itzkowitz calculated that 88% prepared graduates to earn back the costs of their credential in five years or less. Median earnings five years after graduation were at least $10,000 more than those of a typical high school graduate for the vast majority of programs, too.

    But 12% of programs left graduates taking five years or longer to recover out-of-pocket costs and, of those, 112 were flagged as having no economic return on investment.

    The report also notes differences across education sectors. Itzkowitz found that 17% of programs offered by for-profit schools had no return on investment, compared with only 1.2% and 1.3% of majors and credentials at nonprofit and public institutions, respectively. 

    One way for-profit institutions differed from their nonprofit and public peers is that the for-profit institutions offered the most undergraduate certificates in the state — and a larger share of those programs resulted in no economic payoff. Two fields, cosmetology and somatic bodywork, stood out as having the most programs with no measured return on investment.

    Still, many programs showed returns even at a one-year time horizon. The report calculated that almost half of programs at public institutions allowed graduates to recoup the costs of their credential within a year. Among private, nonprofit institutions, 7% of programs positioned graduates to earn back their costs within that period. Thirteen percent of for-profit institutions met the same criteria.

    Oakley said that he hopes the report inspires more research into whether higher-earning programs are attracting students of color, where high-return programs are located regionally and how to replicate programs giving the best economic payoff.

    “There are a lot of programs within our public institutions that provide a good return on investment,” he said. “What surprises me is that when we ask those institutions why, they don’t necessarily know why.”

    Other approaches to measuring the value of college

    While the College Futures Foundation report focuses on graduates’ earnings in the five years after they graduate, other recent research has sought to project college-goers’ earnings over a longer time horizon.

    For example, a 2019 report from Georgetown University’s Center on Education and the Workforce ranked 4,500 colleges by calculating their projected returns 40 years after enrollment. That analysis estimates the net present value of a student’s potential future earnings — that is, it balances the costs of paying for a college education today against the potential for higher earnings over time.

    The Foundation for Research on Equal Opportunity in May released a study framing return on investment in terms of how much college increases a student’s lifetime earnings after subtracting the costs of college. Rather than compare college-goers to the median high school graduate, that study estimates what college-goers would have earned had they not pursued higher education. It also takes into account colleges’ actual completion rates, a step that acknowledges the risk to students that start a program but don’t finish it. 

    EdSource receives funding from several foundations, including the College Futures Foundation. EdSource maintains sole editorial control over the content of its coverage.


    Source link

  • Report: How dual enrollment in California compares with other states

    Report: How dual enrollment in California compares with other states


    Students attend Sociology 101 at Aspire Ollin University Preparatory Academy, one of several dual enrollment classes offered at the school in partnership with East Los Angeles College this semester.

    Credit: Kate Sequeira / EdSource

    A national report finds that dual enrollment can be a powerful strategy for addressing equity gaps in college enrollment and completion rates, but that the students who most need dual enrollment — Black, Latino and low-income students — still struggle to access it.

    The problem of limited access to dual enrollment is true in California, as well as the rest of the nation, according to a report released Monday night by the Community College Research Center (CCRC) at Teachers College, Columbia University.

    The study followed students who began taking dual enrollment courses in 2015, typically high school juniors or seniors, through 2021 using data from the National Student Clearinghouse. Researchers say this report is the first look at college outcomes for dual enrollment students after they graduate from high school with results broken down by race, income and gender — at both the state and national level.

    This report demonstrates how California’s dual enrollment students fare in college compared with other states through a data dashboard.

    For instance, it shows that California students earning college credit in high school are about as likely to enroll in college in the year after high school as other dually enrolled students across the country: 80% compared with 81% nationally. However, dual enrollment students in California are less likely to complete any kind of college degree in the four years after high school: 34% compared to 42% nationally.

    According to John Fink, a senior research associate at the Community College Research Center who is one of the report’s authors, the report raises questions about why some states have much stronger outcomes or better access than others.

    The report shows that some dual enrollment programs have great outcomes but may not have much access, while others have great access but not great outcomes. The best programs, Fink said, have both — the ability to open the doors widely and offer support to ensure students are successful. 

    That’s the best way to “fully realize the potential of dual enrollment to broaden college access and attainment and equity,” Fink said.

    Caliifornia’s Black, Latino and low-income students in dual enrollment lag behind their counterparts on metrics such as college-going rates or college completion, according to the report. However, these same students are much more likely to do better after high school than those students who are not in dual enrollment.

    In California, 25% of Black students in dual enrollment courses were able to attain a bachelor’s degree, compared to 17% of those who had no dual enrollment. Likewise, 20% of Hispanic students in dual enrollment received a bachelor’s degree four years after graduating high school compared to 13% who were never dual enrolled.

    Black students tend to be underrepresented in dual enrollment nationally, but nationally the students that do enroll are more likely to attend four-year colleges, enroll in more selective colleges and major in STEM fields, which have high-earning potential.

    “The implication is that we need to address the issues around access to dual enrollment for Black students and increase the supports, because we see here what the potential is for increasing postsecondary access and attainment,” Fink said.

    The report does not have specific data on why one state might perform better than another, but Fink noted that policies such as charging for classes, requiring certain test scores and other administrative hoops can limit access to dual enrollment for groups who could most benefit.

    California was notable in that it relied much more heavily on community colleges for dual enrollment: 87% of its dually enrolled students are taking classes through community colleges compared with 72% nationally.

    Students who took dual enrollment courses in California were more likely to continue at a community college after high school, 41% compared to 30% for the rest of the country.

    The report found that dual enrollment programs offered by four-year universities tended to have better outcomes, but these institutions under-enrolled Black, Latino or low income students. These programs were more likely to be restrictive and have barriers, such as having more eligibility requirements and not offering transportation.

    The year that the study began following students — 2015– was an important one for dual enrollment in California. That was the year the state passed the College and Career Pathways Act, which made it easier for colleges and K-12 schools to work together to expand access to college courses for high school students. The legislation specifically named dual enrollment as a strategy to improve outcomes for students who struggle with academics or are at risk of dropping out.

    Dual enrollment more than doubled between 2015 and 2021 in California. Though California is the most populous state, its dual enrollment numbers in 2015 were just a fraction of Texas’. Other states with better developed dual enrollment programs in 2015 include Florida and Ohio.

    Fink noted that while a lot has changed in dual enrollment since 2015, research has demonstrated that many of the problems highlighted by this study remain, such as persistent gaps in access for students who are Black, Latino and low-income.

    An analysis of data by EdSource in 2022 found that Black and Latino students were disproportionately underrepresented in dual enrollment classes.


    Source link

  • California should emulate states posting gains on ‘nation’s report card’

    California should emulate states posting gains on ‘nation’s report card’


    Credit: Alison Yin for EdSource

    Once again, California’s scores on the National Assessment for Educational Progress — often called the ‘nation’s report card’ — were disappointing across the board.

    Most news coverage, locally and nationally, focused on the stagnant post-Covid recovery nationwide. But this discouraging coverage overlooks a more positive development: Some states are continuing to see growth in student learning. And it’s happening because of focused, visionary state leadership — something California’s leaders would do well to learn from.

    A recent analysis by the Edunomics Lab at Georgetown University identified states that successfully leveraged federal Covid recovery funds to fuel academic improvement. It’s no accident that states like Louisiana, Mississippi, Tennessee and Kentucky are on the list of places where students have made gains over the past two years. These are all states that set a clear vision for how to improve curriculum and instruction in schools, are giving schools the necessary tools and resources, and are tracking outcomes to fuel continuous improvement.

    For example, in Louisiana, the state Department of Education first set a high bar for curriculum and instruction. Then it identified curricula that met that high bar; incentivized districts to adopt those curricula; identified effective curriculum implementation partners and provided funding for districts to hire them. While this may sound like a top-down reform effort, it was anything but: It included input from teacher leaders from the start, leading to changes like providing each district a single contact person for all state programs and working with teachers to develop Louisiana’s own literacy curriculum. Now, Louisiana is one of only two states where students’ scores have exceeded pre-pandemic results.

    Source: Edunomics (red arrows pointing out CA added by Jennie Herriot-Hatfield)

    California, unfortunately, has set no such vision for curriculum and instruction. The state creates lots of frameworks, but it’s unclear how those massive documents affect what’s happening in classrooms. (In my five years of teaching, I never heard about or used any state framework documents.) The state spent billions of dollars in Covid recovery funds, but didn’t use the funds to pursue any particular instructional improvement strategy, and failed to systematically track outcomes from different spending strategies.

    The states that have pursued instructional improvement with positive results seem to have two common characteristics: a visionary state education leader who makes this work a priority over the long term; and a willingness to learn from other states that have done this work. California hasn’t had either recently, but perhaps that could change, if parents, teachers, and other advocacy groups work together to influence current leadership or find new leaders willing to prioritize this work.

    California is a leader in so many fields — but not in education. Hopefully, that will change soon, with statewide elections less than two years away. With more purposeful state leadership, future NAEP score releases could someday highlight better results for California’s students too.

    •••

    Jennie Herriot-Hatfield is a K-12 education consultant, former elementary school teacher and public school parent in San Francisco.

    The opinions expressed in this commentary represent those of the author. EdSource welcomes commentaries representing diverse points of view. If you would like to submit a commentary, please review our guidelines and contact us.


    Source link

  • Academic gaps ‘allowed to linger’ among California’s Black students over past decade, report says

    Academic gaps ‘allowed to linger’ among California’s Black students over past decade, report says


    Aleka Jackson-Jarrell, coordinator of the Heritage Program at Adelanto High in California’s High Desert, regularly meets with Black students to make sure they stay on track to graduate and meet A-G requirements that enable them to apply to a public university.

    Emma Gallegos/EdSource

    In the areas of chronic absenteeism, suspension and reading proficiency, the rates for Black students in California remain largely the same as they were a decade ago. That is the focus of a new report, Black Minds Matter 2025, which provides new insight and recommendations on education for Black students in California a decade after the first iteration of the report was published by Education Trust-West.

    “This report really meets the moment that we’re in when we’re seeing so many cuts to education funding and programs that are inevitably going to impact Black students,” said Melissa Valenzuela-Stookey, director of research at the prominent nonprofit behind the report that advocates for equity in education.

    Ten years ago, Black students were nearly three times more likely than white students to be suspended, and while suspension rates among Black students have since declined from 14% to 9%, the rate is still three times higher than white students, according to data from the California Department of Education included in the report. The chronic absenteeism rates are similar: in 2016-17, Black students had the second-highest rate of chronic absenteeism of any student group, just under Native American students — a statistic that remained the same in 2023-24.

    “None of the opportunity gaps or outcome gaps explored in this report are new — all have been allowed to linger over the past decade,” concluded the report authors.

    Black students represent about 5% of California’s student population from transitional kindergarten to 12th grade. That totals about 287,400 students, with about a third of them living in Los Angeles County, per 2023-24 state data. About 150,000 Black students are enrolled at institutions of higher education, both public and private.

    “We constantly have in the front of our minds that there are students and families and communities behind every single data point,” said Valenzuela-Stookey. “For that reason, it felt really important to not mince words and just bring to bear the information that we have about what conditions students and families are facing and are up against; despite the fact that they enter those systems with really ambitious aspirations, something is pushing against them, and that something is systemic.”

    The “ambitious aspirations” Valenzuela-Stookey mentioned refers to a finding by The United Negro College Fund in which 9 in 10 Black students agreed that earning a college degree is important, plus additional studies that found Black parents “are highly engaged and invested in their children’s educations, particularly in the early years,” per the report.

    The report, published Thursday, highlights multiple key findings, including:

    • The percentage of Black students in California at grade level in math increased from 16% to 18% in the decade since 2015-16 but has remained the lowest of all student groups
    • The gap between California’s Black and white students who have met or exceeded the state’s reading proficiency exams, known as California Assessment of Student Performance and Progress, has not changed significantly since 1998
    • Three in 4 Black students are socioeconomically disadvantaged, which is 13 percentage points higher than the statewide average
    • The rate of Black students completing A-G course sequences in high school, which are required to attend the University of California and California State University systems, has increased by just 4 percentage points in the last decade
    • While the number of Black children enrolled in transitional kindergarten more than doubled from 2021 to 2023-24, the rate still makes up less than half of the number of Black 4-year-olds who are eligible to enroll
    • Black elementary school students report feeling sadness more frequently than any other student group
    • The number of Black teachers remained disproportionately lower than the share of Black students statewide; just over a quarter of school districts employ Black teachers at a rate proportionate to their Black student population
    • The rate at which Black students participate in dual enrollment increased by only 6 percentage points in the last seven school years, from about 11% to nearly 17%, while other student groups increased between 8 and 14 percentage points
    • Black college students in California face the highest rates of food and housing insecurity

    “This status quo is not an accident — it is the consequence of systems designed to produce unequal outcomes operating largely unchecked for centuries,” the report’s authors wrote. “It is also the consequence of incremental changes made in place of what’s called for: much more fundamental transformation.”

    A deeper look into some of the data cited in the report reveals alarming trends. For example, dual enrollment rates increased among all student racial groups between 2015-16 and 2021-22, per an analysis of state data by Policy Analysis for California Education, but Black students recorded the lowest rate of growth — at nearly 17% in 2021-22, just under the rate of dual enrollment participation for Asian students in 2015-16.

    Also, according to data from the California Community Colleges, within their first year in community college, Black students were completing and passing transfer-level coursework at a rate lower than their peers, with a difference of 30 percentage points between Asian students at 77% and Black students at 47%.

    While the report’s authors acknowledged the pandemic exacerbated some of the academic gaps, many existed long before Covid lockdowns began, and the data included in the report reflected that longevity. “It was really important for us to make sure that people had a long view of how entrenched these systemic inequities are because the solutions to them should follow from how long they’ve been baked into our systems,” said Valenzuela-Stookey.

    In addition to sharing the stark disparities, the report’s authors highlighted a handful of programs and initiatives they believe are working to close the gaps.

    These include a teacher residency program called The Village Initiative and created in collaboration with the Watts of Power Foundation; Los Angeles Unified School District; and California State University, Dominguez Hills. Fifteen Black male teachers were part of the program in 2023, and the partnership estimates they will place 113 fully credentialed, Black teachers in school over the next decade.

    Farther north, at Berkeley High School, the campus’ African American Studies Department is credited for the high rate of graduating within four years among the Black student population, at nearly 95% in the latest school year, compared to the statewide average of just over 86%.

    One of the overarching recommendations proposed by the authors was the creation of a Commission on Black Education Transformation, made up in part by Black students, parents and educators. This would be a standing state commission with the authority to make actionable decisions, including the allocation of resources to ensure follow-through from state and local agencies on policies related to academic progress for Black students.

    Other recommendations include:

    • Mandating that all high schools incorporate the 15-course A-G curriculum required for eligibility to the UC and CSU systems
    • Increasing award amounts for the existing Cal Grant program to aid students with non-tuition costs
    • Prioritizing the hiring and retention of Black educators in both TK-12 and higher education
    • Expanding pandemic-era supports, such as before- and after-school programming and academic tutoring
    • Requiring that all school staff receive training to end the disproportionate impact on Black students of punitive disciplinary practices
    • Modifying the state’s Local Control Funding Formula to target funds based on an index of metrics such as levels of adult educational attainment and homeownership rates
    • Instructing school districts to report “evidence-based strategies” aimed at supporting Black students in their Local Control and Accountability Plans

    Valenzuela-Stookey noted that her team sees both the progress and persistent gaps over the last decade “as a reminder that policy change is just the first step in closing a lot of these opportunity gaps that are highlighted in the report, and implementation and on-the-ground practice work is really the necessary next step if any of that is to come to fruition.”


    Source link