Written by NPE Executive Director Carol Burris, the report will be released in three sections. The first one, Decline, documents the startling halt in charter school growth. Once heralded as the salvation of American education, charter schools are no longer growing. Despite the lack of demand for new charters, the Trump administration recently increased the annual appropriation to the federal Charter Schools Program from $440 million every year to $500 million a year.
The report will be released in three parts: Decline, Disillusionment, and Costs. This is the first part.
Burris begins:
In 1992, City Academy — the nation’s first charter school — opened in St. Paul, Minnesota. Created and led by experienced teachers, it was designed as an alternative school for students struggling in traditional settings. With just 53 students, City Academy embodied the original vision for charter schools: small, teacher-run schools within public districts that tested innovative strategies to reach hard-to-teach kids.
When successful, those strategies would inform and strengthen public education as a whole.
That was the idea supported by American Federation of Teachers President Al Shanker in 1988.
But by the early 1990s, Shanker had become disillusioned. As his wife Edith later explained, “Al became increasingly critical of charter schools as they moved further from their original intent.
He warned that without well-crafted legislation and public oversight, business interests would hijack the charter school concept, ‘whose real aim is to smash public schools.’”
His warning proved prophetic. In the decades since, real estate investors, for-profit management companies, and corporate charter chains have taken over what began as teacher-led experiments. Today, more than fifty charter trade associations—some state-based, others national—lobby aggressively to block charter school oversight and resist any legislative reform. The National Alliance for Public Charter Schools reported over $26.5 million in income in 2023, with more than $28 million in assets. The California Charter Schools Association reported nearly $13 million in revenue that same year. These organizations are not only advocates but powerful lobbyists, intent on protecting all existing charters and promoting unlimited growth.
During the Obama years, federal initiatives like Race to the Top fueled charter expansion with strong bipartisan support. But that coalition has since un-raveled. While Republican enthusiasm for any alternative to public education— charters, vouchers, homeschools — has surged, Democratic support has eroded, particularly as concerns grow over transparency, equity, and privatization.
Today, the charter sector stands at a reckoning point. Growth has slowed.
For-profit models are expanding. The push to create religious charter schools has fractured the movement from within. Meanwhile, charters are now competing not just with public schools and each other, but with a growing network of voucher-funded private schools and publicly subsidized homeschools.
This report, released in three parts — Decline, Disillusionment, and Costs —examines the trajectory of the charter school movement. It contrasts the promise of its early days with its complex, often troubling reality today.
As the charter experiment enters its fourth decade, the question is no longer what charter schools were meant to be — but whether they can still be reformed in order to serve the public good….
Burris questions why the federal government–which claims to be cutting costs and cutting unnecessary programs–continues to send $500 million every year to a sector that is not growing and does not need the money. DOGE eliminated most employees of the U.S. Department of Wducation but left the federal Charter Schools Program untouched.
The charter school sector stands at a critical juncture. Once heralded as a bold experiment in innovation and opportunity, it is now characterized by stagnation, retrenchment, and rising school closures. Between 2022 and 2025, growth has nearly halted, and closures — often sudden and disruptive— are accelerating. Federal investment, rather than adapting to the sector’s shifting realities, has ballooned to half a billion dollars annually, funding schools that never open, quickly fail, or operate with minimal oversight and accountability.
As the data show, under-enrollment is the primary driver of failure. There is no crisis of unmet demand. Hundreds of charter schools, according to NCES data, can’t fill even a single classroom. The frequently cited “million-student waitlist” has been thoroughly debunked, yet continues to be invoked to justify ever-increasing taxpayer support.
Meanwhile, mega-charters and online schools like Commonwealth Charter Academy siphon vast sums of public dollars while delivering dismal academic outcomes. Others, like Highlands Community Charter School, have defrauded taxpayers and exploited students under the guise of second chances.
With enrollment stagnating and oversight failing, taxpayers should ask: Why are we continuing to fund with federal dollars an expansion that isn’t happening? It is time for Congress and the Department of Education to reassess the Charter Schools Program. Federal dollars should no longer subsidize a shrinking and troubled sector. Instead, they must be redirected toward accountable, transparent, and student-centered public education.
Part II of this report, Disillusionment, to be published this fall, will further explain the reasons behind the sector’s decline.
The use of education technology in schools, such as artificial intelligence, digital surveillance and content filters, poses a threat to the civil rights of students with disabilities, LGBTQ students and students of color, a new report released Wednesday warns.
Some technology used in schools to block explicit adult content and flag students at risk of self-harm or harming others have also created serious problems for already vulnerable students, cautions the report by the Center for Democracy and Technology, a nonprofit, nonpartisan organization that advocates for civil rights in the digital world.
The report is based on a wide-ranging online national survey about the technology used by schools, students and teachers. This summer, the Center for Democracy and Technology polled 1,029 ninth- through 12th-grade students, 1,018 parents of sixth through 12th grade students and 1,005 teachers of sixth through 12th grade students in a sample the organization said was weighted to be “nationally representative.”
According to the Center for Democracy and Technology, the surveys also indicate widespread confusion about the role of artificial intelligence in the classroom, with a majority of parents, students and teachers saying they want more information and training about how to properly use it.
Report outlines education technology’s risks to students
The report outlines how school technology can, often inadvertently, harm students. The Center for Democracy and Technology says these harms are felt most acutely by vulnerable students.
Students reported incidents of LGBTQ classmates being outed by digital surveillance, a potentially traumatizing event of sharing their sexual identity or orientation without their consent.
Students with disabilities said they were most likely to use artificial intelligence — and they were more likely to report facing disciplinary action for using it.
One-third of teachers said content related to race or the LGBTQ community is more likely to be restricted by filters. The center said this “amounts to a digital book ban.”
Some schools have faced pushback for the way they deployed technology. After the American Civil Liberties Union sued a school district in Texas, the district loosened a filter that had blocked the website of the Trevor Project, a website aimed at LGBTQ youth.
“There are certain groups of students who should already be protected by existing civil rights laws, and yet they are still experiencing disproportionate and negative consequences because of the use of this education data and technology,” said Elizabeth Laird, director of equity in civic technology for the Center for Democracy and Technology.
Although schools often have dedicated staff and other practices set up to ensure that students’ civil rights are being protected, Laird said its survey indicates that schools have not fully wrestled with how education technology is affecting the promise of an equitable education, resulting in civil rights and technology being treated as separate issues.
“I think they’ve been kept separate, and the time is now to bring those together,” Laird said.
Civil rights groups call for more federal guidance
While schools have been conducting more outreach than in previous years, the survey shows an increase in student and parent concerns about data and privacy over the past year. Survey data collected in previous years shows both parents and students need more outreach and engagement on how schools are selecting and using technology.
Last October, the White House released a Blueprint for an AI Bill of Rights, but civil rights groups — including the ACLU, the American Association of School Librarians, American Library Association, Disability Rights in Education Defense Fund and the Electronic Frontier Foundation — signed a letter accompanying the Center for Democracy and Technology’s report, petitioning the federal Department of Education for more guidance.
“In the year since the release of the Blueprint, the need for education-related protections remains and, if anything, is even more urgent with the explosive emergence of generative AI,” according to the letter.
Fifty-seven percent of teachers in the survey stated they haven’t had any substantive training in AI, while 24% say they have received training in how to detect inappropriate use of AI.
The survey also found that 58% of students have used ChatGPT or other generative AI programs, and 19% said they have submitted a paper written using AI. Students report using AI both for school assignments and for dealing with mental health issues or personal problems with family and friends.
Students with disabilities are more likely to use generative AI: 72% said they’ve used the technology. Parents of students with disabilities are more likely to say that their students have been disciplined for their use of artificial intelligence. The report calls higher rates of discipline among vulnerable communities “particularly worrisome.”
These students and their parents — 71% of students with disabilities and 79% of their parents — express more concern than others about the privacy and security of the data collected and stored by the school.
Licensed special education teachers are more likely to have conversations with students and their parents about student privacy and equity issues in technology, a “promising practice that could be extended to the rest of the school population,” the Center for Democracy and Technology recommends.
School surveillance’s long arm
The civil rights issues can go beyond the walls of the school. Some students, particularly students of color and those from lower-income communities are more likely to rely on school-issued devices when they are at home. Monitoring and tracking can therefore follow them home.
“Their learning environment for those students is quite different than those who can essentially opt out of some of this tracking,” Laird said.
Students who use technology devices to charge their personal phones may also find that this technology will scan and monitor these personal devices as well. Among students who have used their school device for charging, 51% said school software began syncing with and downloading content from their personal device.
Monitoring technology became prevalent in the pandemic-era remote learning, but it has persisted, with 88% of teachers reporting their schools use the technology. The White House named preventing the unchecked monitoring of students a priority in its blueprint. The Center for Democracy and Technology says that the use of surveillance technology can cause a host of problems for students.
Students with disabilities and LGBTQ students are more likely to report being disciplined as a result of technology that monitors them. Laird said that sometimes students are disciplined for something the technology flagged, but other times, they are disciplined because of their reaction to being flagged.
Schools sometimes share data directly with law enforcement — even after school hours. Fifty-three percent of special education teachers and 46% of teachers in Title I schools said data was shared with law enforcement after hours. During an interview with the Center for Democracy and Technology, the parent of a ninth grader said that law enforcement was contacted even before she was notified when something on her child’s device was flagged by the school’s monitoring technology. Her son was questioned for an hour without her consent.
“All of those things can result in students being removed from the classroom and losing instructional time,” said Laird. “And so if those students are being disproportionately flagged and being intervened in a disproportionate way, this could also be a potential violation of [a student’s right to a free and appropriate public education], which is specific to preventing discrimination on the basis of disability.”
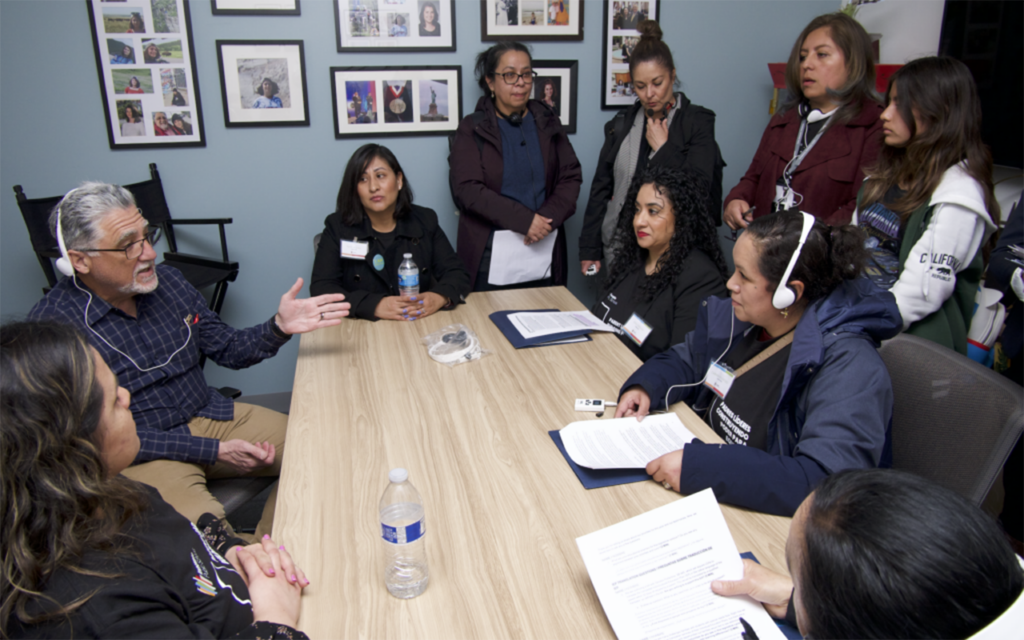
When Los Angeles mother Tania Rivera signed a crucial document for her son Luis’ special education program in 2022, she was hoping he would be able to return to in-person classes after two years of distance learning.
Butthe individualized education program, or IEP, required for all children who need special education, was available only in English. Rivera’s first language is Spanish.
Later she was told Luis, who has autism, would have to continue with online learning because the document did not specify that he needed in-person classes. In addition, she says, the document removed his occupational therapy for handwriting because a language interpreter erroneously said she objected.
“It is a big disadvantage that we have, because I have some English, but it is very basic,” Rivera said in Spanish. “If we’re talking about educational terms or legal terms, the meaning can be lost with just one word” mistranslated.
Monthslong waits and faulty or incomplete translations of special education documents are widespread across California for parents who speak languages other than English, according to special education advocates. They say these problems violate parents’ rights to participate in their children’s education plans under the Individuals with Disabilities Education Act, the federal law that regulates special education.
A proposal in the state Legislature, Senate Bill 445, aims to solve some of these problems, but its fate remains uncertain because of concerns over potential cost.
“I’ve never seen a timely translation and I’ve never seen all documents being fully translated,” said Lisa Mosko Barros, founder of SpEducational, an organization that works to educate parents to be advocates for their children with special needs and improve their access to high-quality education. Mosko Barros has worked with dozens of families in Southern California, including Rivera, and trained hundreds of others on navigating the IEP process.
She said she has heard the same complaints over and over.
“I literally spoke to one parent this morning in the Inland Empire who a couple of years ago signed an IEP and didn’t realize she was signing consent to eliminating speech services for her child who is non-verbal with autism,” Mosko Barros said. “It really can make or break a child’s access to a free and appropriate public education.”
Rivera’s son Luis, now in eighth grade, remained in online classes since fifth grade until this fall and regressed as a result, his mother said.
In total, he lost three years of in-person classes, first in 2020-21 when all students had distance learning, again in 2021-22 because he has chronic asthma and his pediatrician recommended he stay home since vaccinations against Covid-19 were not yet available for children. Then, in 2022, the translation problems kept him out of in-person schooling foranother year.
“He has had academic setbacks, and socially, he regressed a lot because it was three years without interaction,” Rivera said.
When asked how long the district takes to translate special education assessments and IEP documents, the Los Angeles Unified School District communications team wrote that “the District works to parallel the IEP timeline for consistency and return the translated document within the same 30-day timeframe.”They declined to comment on Rivera’s case.
Rivera and almost 200 other people attended an online meeting in September with state Sen. Anthony Portantino, D-Burbank, at which parents shared how long wait times and poor-quality translations have hurttheir children with special needs. They expressedtheir support for Portantino’s bill, which would require IEPs to be translated into a parent or guardian’s native language by a “qualified translator” within 30 calendar days of an IEP meeting or a later request.
Current federal and state laws require that school districts “take any action necessary” to ensure parents understand IEP meetings, and state law requires they translate a student’s IEP at a parent’s request, but no time frame is specified.
“I believe strongly that parents can best advocate for their children when they have the knowledge to do so. Not being able to read an IEP because of language barriers is unacceptable,” Portantino said. “We must find a way to translate IEPs more quickly.”
Portantino said the issue is personal for him because he struggled with dyslexia and ADHD as a student and received limited help from the schools he attended.
“I largely depended on developing my own learning methods, which included lots of repetition and good listening skills,” Portantino said. But he wants to make sure other children can get the help they need.
The bill passed the Senate, the Assembly Education Committee and the Assembly Appropriations Committee with no opposition. But an analysis by the Assembly Appropriations Committee found that the bill could cost the California Department of Education $409,000 annually and could cost school districts between $6 million and $16 million, which might also have to be reimbursed by the state. Believing there was a risk the bill could be vetoed this year because of those costs, Portantino said he chose to make it a “two-year bill,” giving it more time to be discussed in the Legislature and with Gov. Gavin Newsom.
San Francisco Unified School District passed a policy in 2022 to ensure “every effort shall be made” to translate special education documents before meetings so that parents have time to read and understand them. It also requires meeting times to be extended to allow for interpretation.
Carmen Rodríguez is one of dozens of parents who pushed for that policy. Rodríguez has two children with disabilities. Before theSan Francisco Unified policy passed, she said, she waited eight months for a written translation of the first assessment of her older son, who has anxiety and a learning disability, and a year for the IEP for her younger child, who has dyslexia.
“If it’s not in my language, how am I going to understand the document? How do I know that it really says here what my child needs?” Rodríguez said in Spanish.
In addition, she said IEP meetings were often cut short because the district limited them to one hour, with no extra time allowed for interpretation.
Belén Pulido Martínez, senior community organizer for Innovate Public Schools, an organization that worked to get the San Francisco policy passed, said the policy empowers parents.
“Now in San Francisco, the district is training their special ed teachers on the policy, and we’re super happy about that because it’s not just a piece of paper that’s going to die in an office. It’s being implemented,” Martínez said.
Matt Alexander, the San Francisco Unified Board of Education commissioner who worked with parents to write the policy, said school districts have to prioritize translation and interpretation if they want parents to be engaged.
“In our district, over half of our families don’t speak English at home. So if we care about communicating with our families, we have to provide interpretation,” Alexander said. “Step one is, have a clear policy. Step two is, make sure you’re being accountable to families who are directly impacted. Is it working? How do we make it better?”
Rodríguez said since the San Francisco policy passed, several other mothers have thanked her. She said she would love for SB 445 to pass so parents in other districts can also benefit.
“So many children in many different places, many different schools, are not receiving the support they deserve, and their parents have to battle to get an evaluation and to get documents translated, and they find it really hard,” Rodríguez said. “It’s a really, really long document, and it’s a long process. And if it’s in our language, then it will be much easier for us parents to process and understand the document and the evaluation given to our children.”
Chico State University followed proper procedures in how it handled the sex investigation of suspended professor David Stachura and its lengthy aftermath, including not informing faculty and students that Stachura allegedly threatened gun violence on campus, an independent investigation has found.
The 20-page report by San Diego lawyer Nancy Aeling was released late Monday afternoon by the university, nearly a year after EdSource first reported on findings that Stachura had an inappropriate sexual relationship with a student and allegedly threatened to shoot two colleagues who cooperated in an investigation of the matter, and was later named the university’s Outstanding Professor of the 2020-21 school year.
“The university acted consistently with policy by not notifying the Chico State community of Stachura’s alleged threats of violence,” Aeling wrote. Stachura, according to court testimony by his estranged wife, had told her of his intent to kill two professors who cooperated in the 2021 investigation that found he had an inappropriate relationship, which included sex in his office, with a student. Separately, a biology lecturer revealed — and later testified — that Stachura spoke to her about committing a shooting in the biology department.
Aeling did not respond to a phone message left at her office on Monday.
The report was also not critical of the university’s Campus Violence Consultation Team, which recommended that Stachura be allowed to return to campus after investigating the alleged threats against his colleagues and “did not find that he posed a threat of violence.”
A member of that team, Chico State Police Chief Christopher Nicodemus, testified in a court proceeding earlier this year that he did not agree with the team’s findings.
“There were concerns” about Stachura, Nicodemus said on the stand in a legal proceeding that resulted in a judge issuing a three-year workplace violence restraining order against Stachura that bars him from going on campus or near the people he threatened.
Nicodemus said on the stand that he believed “it’s safer to err on the side of caution” when making a threat assessment. He added that it would have been better to have mistakenly fired Stachura than live with the aftermath of a violent event.
Aeling wrote in the report that she did not consider “the appropriateness of Stachura’s actions or communications with his colleagues nor his colleagues’ responses to Stachura and his continued presence on campus, or the overall effectiveness of the procedures or policies in place to address the situation presented by (his) actions or communications.” Rather, the report was limited to “whether (the) responses were reasonable given the information available at the time and were consistent with the policies and procedures governing them.” The report makes no policy recommendations.
A faculty union officer ripped the report Monday night.
“It’s absolutely demoralizing and heartbreaking that no one has taken any accountability for what has happened,’’ Lindsay Briggs, a public health professor and a California Faculty Association Chico Campus Executive Board member, wrote in an email to EdSource.
“This is why survivors of violence don’t speak out and why we don’t feel safe at our jobs; because we’re not. No one cares to do anything other than offer empty platitudes.” Eleven “months of hand wringing and we’re no better off than we were before,” she said.
Gordon Wolfe, a professor who turned over court records about Stachura’s alleged threat to kill witnesses, said in a phone interview Monday evening that he received an email from Chico State saying that Aeling wanted to interview him, but that “she never followed up.”
Stachura remains on administrative leave as the university finishes an investigation of his alleged threat to kill witnesses in the sex case. He was recently ordered by a judge to pay more than $64,000 for the legal fees of a lecturer he unsuccessfully sued for libel. His lawyer did not respond to a request to comment on Aeling’s report.
In a prepared statement that accompanied the report’s release, Chico State President Stephen Perez said, “I appreciate the thorough review and the opportunity to consider our practices moving forward.”
Without mentioning her by name, the report found that former Chico State President Gayle Hutchinson considered the sex case against Stachura as well as the alleged threats he made when approving “Stachura’s promotion to” full professor in 2021. Hutchinson found him “to be a highly productive citizen of the academy, with a strong record of teaching, service and research,” the report states.
Hutchinson retired in June. She could not be immediately reached Monday night.
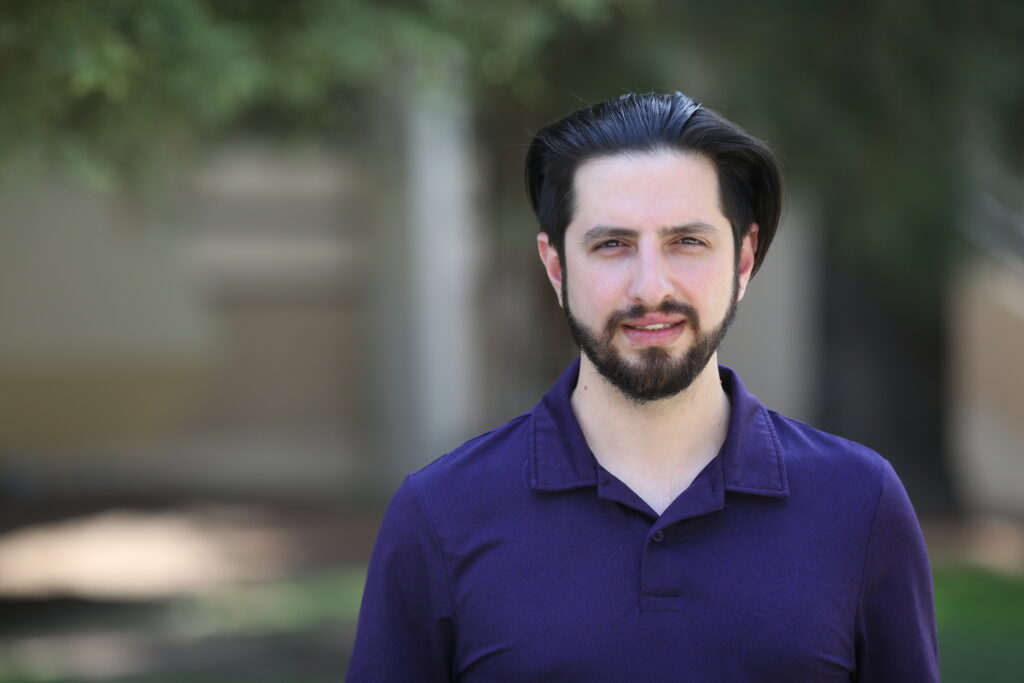
Tom Boroujeni, Fresno City College academic senate president.
Credit: Mark Tabay / Fresno City College
The State Center Community College District placed Fresno City College instructor and president of the school’s Academic Senate, Tom Boroujeni, on administrative leave late Thursday, district officials said in a statement.
District officials cited no specific reason for the action. It takes effect immediately.
The move came one day after EdSoruce reported that in 2021 Fresno State University determined that in 2015, Boroujeni “committed an act of sexual violence” against a professor who also teaches part-time at Fresno City College. He denies committing the act.
Chancellor Carol Goldsmith did not respond to messages Thursday night.
Boroujeni did not respond to messages following the district’s brief announcement.
In a message to the City College campus community Thursday, President Robert Pimentel wrote that “investigative action” was being taken, and that “the college takes allegations of this nature very seriously.” He did not explain the specific allegations.
Boroujeni, 38, of Clovis, is also known as Farrokh Eizadiboroujeni and Tom Eizadi, documents show. He has taught at Fresno City College since 2015, the same year he began his academic career at Fresno State while still a graduate student.
Earlier Thursday, three female instructors in the communication department at Fresno City College refused to teach their classes, citing the EdSource report.
Tiffany Sarkisian, the college’s program-review coordinator and a communication arts instructor, told the administration and her students that she and others decided to stay off campus in an effort to advocate for a safe teaching, learning and working environment.
“The environment at FCC (Fresno City College) grows more toxic and unsafe by the day, especially as an abuser has been – and continues to be – protected by various campus leaders,” she emailed college administrators.
Late Thursday, after learning the district put Boroujeni on administrative leave, Sarkisian said the college’s decision was appropriate.
“It provides a space where other parties can feel safe to actually do the job of teaching and learning,” she said, but the paid administrative leave is “essentially rewarding (him) for behaving badly.”
She added that the college had deeper problems than Boroujeni. “It’s not just this individual being a bad actor; it’s institutionalized practices and structures that allowed this to continue for so long.”
“This (was) another example of an institution protecting the abuser and not the victim,” she told EdSource. “What happened on our campus should not have happened, and there should have been other structures in place.”
Boroujeni told EdSource in an interview that he also faces complaints from three female employees of the college for what he described as gender discrimination.
He was also reprimanded last year by Cyndie Luna, dean of the school’s Fine, Performing and Communication Arts Division, for unprofessional conduct that included allegedly referring to a colleague with an apparent racial slur and threatening “to get” the colleague, according to a copy of the reprimand letter EdSource obtained. Boroujeni claimed Luna fabricated the slur and threat she attributed to him, adding, she “makes things up all the time.”
He also claimed that a Fresno State professor was lying when she told an investigator that she did not consent to sex with Boroujeni in her apartment on June 21, 2015, and that he “pinned down her upper region” and that she “zoned out” during what followed.
EdSource does not identify victims of sexual abuse or violence. The woman declined to be interviewed.
Boroujeni told EdSource the woman made up the assault allegation in retribution for a sexual harassment allegation he brought against her, claiming she seduced him into a relationship he didn’t want but entered into out of fear that she would undermine his ability to earn a master’s degree and become a Fresno State instructor.
That claim, which Bouroujeni linked to his removal in 2020 as coach of the school’s nationally prominent debate team, was dismissed by a university investigator.
It was during the probe of his claim that the alleged victim told the investigator about what happened at her apartment on June 21, 2015. The investigator determined she was credible and found that Boroujeni committed what Fresno State has called “an act of sexual violence.”
The university couldn’t discipline him because he was a graduate student when the alleged violence occurred. Boroujeni resigned from Fresno State last year after officials said a report on the matter would be placed in his personnel file when he was up for a performance review.
In his resignation, he agreed to not seek or accept work in the California State University system again.
But the matter had no immediate impact on his teaching a few miles away at Fresno City College, where the victim teaches part-time in addition to her tenured position at Fresno State.
A State Center Community College District document obtained by EdSource shows that “in August 2021, (the victim) sought a ‘no contact order’ from Fresno City College against Tom Boroujeni… as a result of a sexual misconduct investigation at CSU Fresno.” The ‘no contact order’ was granted, the document, titled an “Administrative Determination,” states.
The district granted Boroujeni tenure in March. He assumed the academic senate presidency in May, after a two-year term as president elect.
Jill Wagner, spokesperson for SCCCD, told EdSource that Boroujeni’s tenure committee “considered multiple factors in favor of granting tenure, and areas of concern were not identified” at the time of the review. Asked if the committee that considered Boroujeni’s tenure had access to or was of the district’s administrative determination which confirmed Fresno State’s finding that an act of sexual violence had occurred, Wagner did not respond directly, writing instead that the district followed state law and the district’s union contract, “which prescribes what information can be included in tenure review.”
Boroujeni told Edsource that he “got tenured with the district’s knowledge of everything that had happened.”
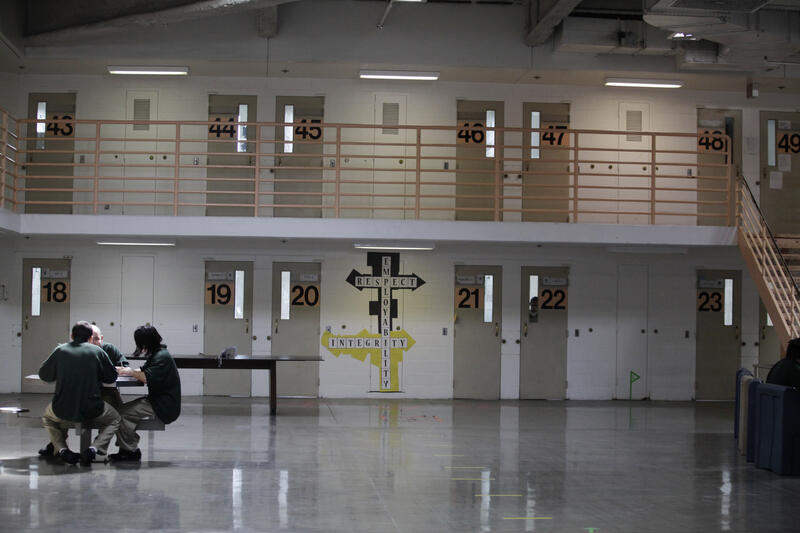
Wards at N.A. Chaderjian Youth Correctional Facility talk at a table in Merced Hall in Stockton, Calif.
Credit: Lea Suzuki / San Francisco Chronicle / Polaris
California is failing to provide a high-quality education to students in the juvenile justice system by not addressing the inadequacies of academic data collection practices, according to a recent report from the national Youth Law Center. Current collection practices, the report authors argue, do not accurately measure student needs and outcomes.
“A failure to design better metrics would be a disastrous choice on the part of California stakeholders to keep these students out of sight and out of mind,” the report’s authors wrote.
The report, “Out of Sight, Out of Mind,” is a follow-up to a 2016 report that similarly found the state to be failing in its mission of providing students in juvenile detention with high-quality education via its disproportionate representation of multiple student populations, high rates of chronic absenteeism, low high school graduation rates, inaccurate or incomplete data, and more.
The most recent report highlighted data from two school years — 2018-19 and 2021-22 — using publicly available data from the California Department of Education as well as public records requests sent to 10 county offices of education that oversee court schools, which are education facilities for youth in the juvenile justice system. Students enroll in court school as they await adjudication or disposition, after they’ve been committed to a juvenile facility, or if they’re in a home placement under the supervision of probation.
During 2018-19, nearly 20,000 students attended court schools in the state. In the 2021-22 school year, the number dropped to 10,891. This decrease likely reflects the lower number of youth in the juvenile justice system, which has trended downward in recent years, per the report.
California’s current academic data system does not capture one crucial data point — that the majority of students attend a court school for less than 31 instructional days, the report noted. This means that few students attend for an entire school year, which is typically the time frame that data collection practices are based on.
What’s more, currently available data does not distinguish between academic needs and outcomes of students who spend days or weeks attending a court school versus those who attend for years.
The report highlighted that it has long been anecdotally understood by researchers, probation staff and others working in education within the juvenile justice system that student attendance is often transitory given the dynamic nature of the legal system. The report’s authors argue that instructional programming should reflect this knowledge by calculating any partial credits earned by recording them in student transcripts once they leave juvenile detention. Students also need additional services to more seamlessly move back into their local schools.
While the report’s authors acknowledge that less time in the juvenile justice system is most beneficial, they maintain that the time youth do spend attending a court school should be as minimally disruptive as possible to their education. Minimizing disruption, they said, could include a heightened focus on the transition process out of juvenile detention.
An ongoing challenge with inadequate data collection is that improvements are difficult to highlight. For example, the report authors found that the college-going rate at 10 court schools exceeded the average for the state’s alternative schools.
“The data doesn’t really care if it’s positive or negative. The limitations exist on both sides,” said Chris Middleton, an Equal Justice Works fellow at the Youth Law Center and a primary author of the report. “And I think here where a really positive story could be told, there’s still a set of limitations that’s very evident.”
Much of the data contained in the report reflects a dire reality.
For example, the overall number of youth in the juvenile justice system decreased significantly from 2018 to 2022, yet the number of students with disabilities rose from 20.1% to 29.8%.
The report suggests a few potential reasons: improved screening and identification, improved communication between schools regarding disability status, or a failure to capitalize on the systemic changes that drove the decrease in youth detention statewide.
The report’s authors also found that foster youth are overrepresented in the juvenile justice system.
While foster youth represent less than 1% of all students enrolled in California schools, in 2018-19 they made up 21.44% of court school enrollments; by 2021-22, they were almost 31 times overrepresented in court schools versus traditional schools. This data was either redacted or unavailable for 27 of 51 court schools.
“The extremely high rate of disability status and the extremely high rate of foster care overlap,” Brady said. “We have long known that young people with disabilities are more likely to be impacted by the juvenile justice system. … The numbers for foster care were still surprising.”
Similarly, high rates of students experiencing homelessness were found at some court schools, but the data for this population of students was particularly unclear; much was either redacted or unavailable. While foster youth status is centrally tracked by the state, homelessness is largely screened by school districts — an identification process that has only in recent years improved through legislation and enforcement.
Regarding chronic absenteeism, the rate was 12.9% among court schools and 12.1% statewide during the 2018-19 school year, and by the 2021-22 school year, that rate was 16.8% among court schools and 30% statewide.
Though lower than the state average, this was alarming for the report’s authors.
Students who attend a local education agency for less than 31 days are not eligible to be considered chronically absent, which indicates that the true rate of chronic absences is much higher, given that most court school students attend for less than 31 instructional days, the report authors wrote.
Additionally, the authors found while some students refuse to attend class, some cannot attend due to decisions made by probation staff. Two examples shared in the report include a practice in Los Angeles County “of barring entire living units of young people from attending school if one of them misbehaved” and refusal by probation staff to provide “timely transport” of students to school.
According to the report, “A necessary element of addressing chronic absenteeism in court schools must include better documentation of missed instructional time and the reasons why students are absent from class.
“Additionally, efficient and effective coordination between probation and school staff is critical to ensuring the basic educational responsibility of students being present in their classrooms is met.”
While the rate of chronic absences was lower among court schools during the 2021-22 school year, it should be noted that the percentages across court schools varied. Some schools reported a rate of over 30% while other schools reported 0%.
One recent allocation of $15 million toward post-secondary education programs for youth in the juvenile justice system might turn the tide on better understanding outcomes. The funding will create and expand community college programming inside juvenile facilities, and a portion is intended to go toward evaluating such programs.
This ongoing funding “is the single most positive and exciting thing that’s going on in the area of juvenile justice and education right now,” said Lauren Brady, managing director of the legal team at Youth Law Center.
Many of the issues with data collection that researchers found were due to unavailable data or redactions — when a group includes fewer than 10 students, data is withheld to protect student privacy.
“We can’t tell the complete story. That’s where we’re at right now. … In order to truly transform the experience for students and to give them the best chance to have a brighter future, we have to be able to measure what they’re experiencing,” report co-author Middleton said. “And I think that we have the capability. I have faith in California and our institutions that we are able to properly develop these measures and ensure that the data’s actually being reported.”
Teacher apprentice Ja’net Williams helps with a math lesson in a first grade class at Delta Elementary Charter School in Clarksburg, near Sacramento.
Credit: Diana Lambert / EdSource
Top Takeaways
California leaders dismiss the criticism and methodology of the rankings.
And yet, graduate credentialing programs cram a lot in a year.
Many teachers may struggle with the demands of California’s new math framework.
In its “State of the States” report on math instruction published last week, the National Council on Teacher Quality sharply criticized California and many of its teacher certification programs for ineffectively preparing new elementary teachers to teach math and for failing to support and guide them once they reach the classroom.
“Far too many elementary teacher prep programs fail to dedicate enough instructional time to building aspiring teachers’ math knowledge — leaving teachers unprepared and students underserved,” the council said in its evaluation of California’s 87 programs that prepare elementary school teachers. “The analysis shows California programs perform among the lowest in the country.”
The report’s call for more teacher math training and ongoing support coincides with the state’s adoption this summer of materials and textbooks for a new math framework that math professionals universally agree will be a heavy lift for incoming and veteran teachers to master. It will challenge elementary teachers with a poor grasp of the underpinnings behind the math they’ll be teaching.
Kyndall Brown, executive director of the California Mathematics Project based at UCLA, agrees. “It’s not just about knowing the content, it’s about helping students learn the content, which are two completely different things,” he said.
And that raises a question: Does a one-year-plus-summer graduate program, which most prospective teachers take, cram too much in a short time to realistically meet the needs to teach elementary school math?
California joined two dozen states whose math preparation programs were rated as “weak.” Only one state got a “strong” rating.Source: National Council on Teacher Quality, 2025 State of the States report
Failing grades
The council graded every teacher prep program nationwide from A to F, based on how many instructional hours they required prospective teachers to take in major content areas of math and in instructional methods and strategies.
Three out of four California programs got an F, with some programs — California State University, Sacramento, and California State University, Monterey Bay — requiring no instructional hours for algebraic thinking, geometry, and probability, and many offering one-quarter of the 135 instructional hours needed for an A.
But there was a dichotomy: All the Fs were given to one-year graduate school programs offering a multi-subject credential to teach elementary school, historically the way most new teachers in California get their teaching credential.
On the other hand, many of the colleges and universities offering a teaching credential and a bachelor’s degree through an Integrated Undergraduate Teacher Credentialing Program got an A, because they included enough time to go into math instruction and content in more depth. For example, California State University, Long Beach’s 226 instructional hours, apportioned through all of the content areas and methods courses, earned an A-plus.
The California State University rejects the recent grading from the National Council on Teacher Quality about our high-quality teacher training programs
California State University
Most of the universities that offer both undergraduate and graduate programs — California State University, Bakersfield; San Jose State University; California State University, Chico; California State University, Northridge, to name a few — had the same split: A for their undergraduate programs, F for their graduate credentialing programs.
Most California teacher preparation programs have received bad grades in the dozen years that the council has issued evaluations. The state’s higher education institutions, in turn, have defended their programs and denounced the council for basing the quality of a program on analyses of program websites and syllabi.
California State University, whose campuses train the majority of teachers, and the California Commission on Teacher Credentialing, which accredits and oversees teacher prep programs, issued similar denunciations last week.
“The California State University rejects the recent grading from the National Council on Teacher Quality about our high-quality teacher training programs,” the CSU wrote in a statement. The council “relies on a narrow and flawed methodology, heavily dependent on document reviews, rather than on dialogue with program faculty, students and employers or a systematic review of meaningful program outcomes.”
The credentialing commission, in a more diplomatic response, agreed. The report “reflects a methodology that differs from California’s approach to educator preparation,” it said. “While informative, it does not fully capture the structure of California’s clinically rich, performance-based system.”
Heather Peske, president of the National Council on Teacher Quality for the past three years, dismissed the criticism as “a really weak critique.”
“You can look at a syllabus and see what’s being taught in that class much in the same way that if you go to a restaurant and look at the menu to see what’s being served,” she said. “Our reviews are certainly a very solid starting place to know to what extent teacher preparation programs are well preparing future teachers to be effective in teaching.”
It’s not just a problem in California.
“When we compare the mathematics instructional hours between the undergrad and the graduate programs, often on the same campus, we saw on average that undergrads get 133 hours compared to just 52 hours at the graduate level. In both cases, it is not meeting the recommended and research-based 150 hours,” Peske said.
Part of the problem is that graduate programs usually don’t have enough time to instill future teachers with the content knowledge that they need.
Heather Peske
Whether or not examining website data is a good methodology, the disparities in hours devoted to math preparation between undergraduate and graduate programs raise an important issue.
True jacks of all trades, elementary teachers must become proficient in many content areas — social studies, English language arts, English language development for English learners, and science, as well as math. Add to that proficiency in emerging technologies, classroom management, skills for teaching students with disabilities, and student mental health: How can they adequately cover math, especially?
“Part of the problem is that graduate programs usually don’t have enough time to instill future teachers with the content knowledge that they need,” Peske said. “California programs have to reckon with this idea that they’re sending a bunch of teachers into classrooms who have not demonstrated that they are ready to teach kids math.”
Brown said, “There’s no way that in a one-year credential program that they’re going to get the math that they need to be able to teach the content that they’re responsible for teaching.”
That was Anthony Caston’s experience. Before starting his career as a sixth-grade teacher at Foulks Ranch Elementary School in Elk Grove three years ago, Caston took courses for his credential in graduate programs at Sacramento State and the University of the Pacific. There wasn’t enough time to learn all he needed to teach the subject, he said. A few classes were useful, but didn’t get much beyond the third- or fourth-grade curriculum, he said.
“I had to take myself back to school, reteach myself everything, and then come up with some teaching strategies,” Caston said.
Fortunately for him, veteran teachers at his school helped him learn more about Common Core math and how to teach it.
The math content Brown refers togoes beyond knowing how to invert fractions or calculate the area of a triangle; it involves a conceptual understanding of essential math topics, Peske said. Only a deeper conceptual grasp will enable teachers to diagnose and explain students’ errors and misunderstandings, Peske said, and to overcome the math phobia that surveys show many teachers have.
Ma Bernadette Salgarino, the president of the California Mathematics Council and a math trainer in the Santa Clara County Office of Education, acknowledges that many math teachers have not been taught the concepts behind the progression of the state’s math standards. “It is not clear to them,” she said. “They’re still teaching to a regurgitation of procedures, copy and paste. These are the steps, and this is what you will do.”
Although a longtime critic of the council, Linda Darling-Hammond, who chaired California’s credentialing commission before becoming the current president of the State Board of Education, acknowledges that the report raises a legitimate issue.
“Time is an important question,” she said. “It is true that having more time well spent — the ‘well spent’ matters — could make a difference for lots of people in learning lots of subjects, including math.”
Darling-Hammond faults the study, however, for not factoring in California’s broader approach to teacher preparation, including requiring that teaching candidates pass a performance assessment in math and underwriting teacher residency programs, in which teachers work side by side with an effective teacher for a full year while taking courses in a graduate program.
“You could end up becoming a pretty spectacular math teacher in a shorter amount of time than if you’re just studying things in an undergraduate program disconnected from student teaching,” she said.
Weak state policies
The report also grades every state’s policies on math instruction, from preparing teachers to coaching them after they’re in the classroom. California and two dozen states are rated “weak,” ahead of seven “unacceptable” states (Montana, Arizona, Nebraska, Missouri, Alaska, Vermont and Maine) while behind 17 “moderate” states, including Texas and Florida, and a sole “strong” state, Alabama.
The council bases the rating on the implementation of five policy “levers” to ensure “rigorous standards-aligned math instruction.” However, California’s actions are more nuanced than perhaps its “unacceptable” ratings on three and “strong” ratings on two would indicate.
For example, the council dinged the state for not requiring that all teachers in a prep program pass a math licensure test. California does require elementary credential candidates to pass the California Subject Examinations for Teachers, or CSET, a basic skills test, before they can teach students. But the math portion is combined with science, and students can avoid the test by supplying proof they have taken undergraduate math courses.
At the same time, many superintendents and math teachers may be doing a double-take for a “strong” rating for providing professional learning and ongoing support for teachers to sustain effective math instruction.
Going back to the adoption of the Common Core, the state has not funded statewide teacher training in math standards. In the past five years, the state has spent $500 million to train literacy coaches in the state’s poorest schools, but nothing of that magnitude for math coaches.
The Legislature approved $20 million for the California Mathematics Project for training in the new math framework, which was passed in 2023, and $50 million in 2022-23 for instruction in grades fourth to 12th in science, math and computer science training to train coaches and teacher leaders — amounts that would be impressive for smaller states, but not to fund training most math teachers in California. (You can find a listing of organizations offering training and resources on the math framework here.)
In keeping with local control, Gov. Gavin Newsom has appropriated more than $10 billion in education block grants, including the Student Support and Professional Development Discretionary Block Grant,and the Learning Recovery Emergency Block Grant, but those are discretionary; districts have wide latitude to spend money however they want on any subject.
Tucked into a section on Literacy Instruction in Newsom’s May budget revision (see Page 19) is the mention that a $545 million grant for materials instruction will include a new opportunity to support math coaches, too. The release of the final state budget for 2025-26 later this month will reveal whether that money survives.
Brown calls for hiring more math specialists for schools and for three-week summer intensive math leadership institutes like the one he attended in 1994. It hasn’t been held since the money ran dry in the early 2000s.
EdSource reporter Diana Lambert contributed to this article.
Despite statewide efforts, California is still struggling to support the personal and educational needs of its students, according to the 2024 California Children’s Report Card conducted by the organization Children Now, which “grades the State on its ability to support better outcomes for kids” and evaluates progress made on California policies and investments.
“California has failed to significantly improve outcomes for kids, allowing unacceptable and economic disparities to stagnate and in many cases grow,” Ted Lempert, Children Now’s president, wrote in a letter included in the report.
“What’s particularly disturbing is that California continues to trail far behind other states on a number of important indicators of child well-being. Despite our relatively high tax burden, our progressive leanings, and our enviable 5th largest economy in the world, California is far from a leader when it comes to kids. That’s not only a threat to our state’s collective future, but to the entire country as well since California is so often a bellwether for the nation.”
Children’s health
Among the health categories assessed, “health insurance” received the highest grade, A-minus. Meanwhile, “birthing health,” “preventative screenings,” “supporting mental health,” “preventing substance abuse” and “health care access and accountability, all received grades in the D range.
The rest of the health categories — including “environmental health and justice,” “oral health care” and “relationships and sexual health” — all received grades in the C range.
Additionally, the report noted that “while many states and municipalities across the country have declared racism as a public health crisis, California has yet to do so.”
According to the report, “children’s poor health outcomes are largely driven by racism at the intersection of poverty, sexual orientation, gender, and geography.”
Children’s education
Of the 12 topics under education, none earned a grade in the A range. Here’s how the report assessed the state on its education:
C-minus for child care.
B-plus for preschool and transitional kindergarten.
B-minus for early care and education workforce.
D for early intervention and special education.
C-minus for education for dual language and English learners.
C-plus for funding.
B for expanded learning programs
D for science, technology, engineering and math education.
C for educator pipeline, retention and diversity.
D for school climate: connections with adults on campus.
C for “school climate: discipline and attendance.
B-minus for higher education.
“California is investing record amounts in public education, yet struggles to effectively support students, especially those who need the most help,” the report reads.
It added that the state’s education system “ranks 43rd of 50 states of outcome gaps by race and ethnicity.”
Support from family
In terms of family support, “voluntary evidence-based home visiting” earned a C-minus, while in “paid family leave,” the state received a B-minus. “Income assistance for low-income families” was given a B.
“Children’s well-being is fueled by good health, enriching learning opportunities, and positive and nurturing relationships with adults. Both adult and child well-being can be undermined by unmet basic needs, economic hardship, social isolation, and stress,” according to the report.
“Throughout the pandemic, California made positive policy changes to bolster families with key supports, even as federal funding withered away,” the report read. “However, too often, families with young children are an afterthought in California policy.”
Child welfare in California
None of the child welfare categories garnered an A or B.
Instead, the state earned a C for “home stability and enduring relationships” and a C-plus in “health care for kids in foster care.”
Meanwhile, the state earned a D in both education supports for students in foster care and transitions to adulthood.
“For children and youth who cannot remain safely at home and must enter foster care, the State must ensure access to stable and nurturing foster homes, trauma-informed services, and targeted, high-quality educational supports to help them heal and thrive,” the report states.
Cross-sector issues facing California children
In terms of “cross-sector” issues, both “food security” and “cradle-to-career data systems” received a B-minus, while support for LGBTQ+ youth received a C-plus, “decriminalization of youth” received a D-plus and support for unaccompanied homeless youth landed a D-minus.
“While all of the issues in the “Report Card” are interrelated, the topics in this section have especially strong implications across multiple sectors and systems,” the report read.
“A whole-child approach to supporting kids incorporates services that meet young people where they’re at and address the many factors that are needed to help them thrive.”
Teacher apprentice Ja’net Williams helps with a math lesson in a first grade class at Delta Elementary Charter School in Clarksburg, near Sacramento.
Credit: Diana Lambert / EdSource
Top Takeaways
California leaders dismiss the criticism and methodology of the rankings.
And yet, graduate credentialing programs cram a lot in a year.
Many teachers may struggle with the demands of California’s new math framework.
In its “State of the States” report on math instruction published last week, the National Council on Teacher Quality sharply criticized California and many of its teacher certification programs for ineffectively preparing new elementary teachers to teach math and for failing to support and guide them once they reach the classroom.
“Far too many elementary teacher prep programs fail to dedicate enough instructional time to building aspiring teachers’ math knowledge — leaving teachers unprepared and students underserved,” the council said in its evaluation of California’s 87 programs that prepare elementary school teachers. “The analysis shows California programs perform among the lowest in the country.”
The report’s call for more teacher math training and ongoing support coincides with the state’s adoption this summer of materials and textbooks for a new math framework that math professionals universally agree will be a heavy lift for incoming and veteran teachers to master. It will challenge elementary teachers with a poor grasp of the underpinnings behind the math they’ll be teaching.
Kyndall Brown, executive director of the California Mathematics Project based at UCLA, agrees. “It’s not just about knowing the content, it’s about helping students learn the content, which are two completely different things,” he said.
And that raises a question: Does a one-year-plus-summer graduate program, which most prospective teachers take, cram too much in a short time to realistically meet the needs to teach elementary school math?
California joined two dozen states whose math preparation programs were rated as “weak.” Only one state got a “strong” rating.Source: National Council on Teacher Quality, 2025 State of the States report
Failing grades
The council graded every teacher prep program nationwide from A to F, based on how many instructional hours they required prospective teachers to take in major content areas of math and in instructional methods and strategies.
Three out of four California programs got an F, with some programs — California State University, Sacramento, and California State University, Monterey Bay — requiring no instructional hours for algebraic thinking, geometry, and probability, and many offering one-quarter of the 135 instructional hours needed for an A.
But there was a dichotomy: All the Fs were given to one-year graduate school programs offering a multi-subject credential to teach elementary school, historically the way most new teachers in California get their teaching credential.
On the other hand, many of the colleges and universities offering a teaching credential and a bachelor’s degree through an Integrated Undergraduate Teacher Credentialing Program got an A, because they included enough time to go into math instruction and content in more depth. For example, California State University, Long Beach’s 226 instructional hours, apportioned through all of the content areas and methods courses, earned an A-plus.
The California State University rejects the recent grading from the National Council on Teacher Quality about our high-quality teacher training programs
California State University
Most of the universities that offer both undergraduate and graduate programs — California State University, Bakersfield; San Jose State University; California State University, Chico; California State University, Northridge, to name a few — had the same split: A for their undergraduate programs, F for their graduate credentialing programs.
Most California teacher preparation programs have received bad grades in the dozen years that the council has issued evaluations. The state’s higher education institutions, in turn, have defended their programs and denounced the council for basing the quality of a program on analyses of program websites and syllabi.
California State University, whose campuses train the majority of teachers, and the California Commission on Teacher Credentialing, which accredits and oversees teacher prep programs, issued similar denunciations last week.
“The California State University rejects the recent grading from the National Council on Teacher Quality about our high-quality teacher training programs,” the CSU wrote in a statement. The council “relies on a narrow and flawed methodology, heavily dependent on document reviews, rather than on dialogue with program faculty, students and employers or a systematic review of meaningful program outcomes.”
The credentialing commission, in a more diplomatic response, agreed. The report “reflects a methodology that differs from California’s approach to educator preparation,” it said. “While informative, it does not fully capture the structure of California’s clinically rich, performance-based system.”
Heather Peske, president of the National Council on Teacher Quality for the past three years, dismissed the criticism as “a really weak critique.”
“You can look at a syllabus and see what’s being taught in that class much in the same way that if you go to a restaurant and look at the menu to see what’s being served,” she said. “Our reviews are certainly a very solid starting place to know to what extent teacher preparation programs are well preparing future teachers to be effective in teaching.”
It’s not just a problem in California.
“When we compare the mathematics instructional hours between the undergrad and the graduate programs, often on the same campus, we saw on average that undergrads get 133 hours compared to just 52 hours at the graduate level. In both cases, it is not meeting the recommended and research-based 150 hours,” Peske said.
Part of the problem is that graduate programs usually don’t have enough time to instill future teachers with the content knowledge that they need.
Heather Peske
Whether or not examining website data is a good methodology, the disparities in hours devoted to math preparation between undergraduate and graduate programs raise an important issue.
True jacks of all trades, elementary teachers must become proficient in many content areas — social studies, English language arts, English language development for English learners, and science, as well as math. Add to that proficiency in emerging technologies, classroom management, skills for teaching students with disabilities, and student mental health: How can they adequately cover math, especially?
“Part of the problem is that graduate programs usually don’t have enough time to instill future teachers with the content knowledge that they need,” Peske said. “California programs have to reckon with this idea that they’re sending a bunch of teachers into classrooms who have not demonstrated that they are ready to teach kids math.”
Brown said, “There’s no way that in a one-year credential program that they’re going to get the math that they need to be able to teach the content that they’re responsible for teaching.”
That was Anthony Caston’s experience. Before starting his career as a sixth-grade teacher at Foulks Ranch Elementary School in Elk Grove three years ago, Caston took courses for his credential in graduate programs at Sacramento State and the University of the Pacific. There wasn’t enough time to learn all he needed to teach the subject, he said. A few classes were useful, but didn’t get much beyond the third- or fourth-grade curriculum, he said.
“I had to take myself back to school, reteach myself everything, and then come up with some teaching strategies,” Caston said.
Fortunately for him, veteran teachers at his school helped him learn more about Common Core math and how to teach it.
The math content Brown refers togoes beyond knowing how to invert fractions or calculate the area of a triangle; it involves a conceptual understanding of essential math topics, Peske said. Only a deeper conceptual grasp will enable teachers to diagnose and explain students’ errors and misunderstandings, Peske said, and to overcome the math phobia that surveys show many teachers have.
Ma Bernadette Salgarino, the president of the California Mathematics Council and a math trainer in the Santa Clara County Office of Education, acknowledges that many math teachers have not been taught the concepts behind the progression of the state’s math standards. “It is not clear to them,” she said. “They’re still teaching to a regurgitation of procedures, copy and paste. These are the steps, and this is what you will do.”
Although a longtime critic of the council, Linda Darling-Hammond, who chaired California’s credentialing commission before becoming the current president of the State Board of Education, acknowledges that the report raises a legitimate issue.
“Time is an important question,” she said. “It is true that having more time well spent — the ‘well spent’ matters — could make a difference for lots of people in learning lots of subjects, including math.”
Darling-Hammond faults the study, however, for not factoring in California’s broader approach to teacher preparation, including requiring that teaching candidates pass a performance assessment in math and underwriting teacher residency programs, in which teachers work side by side with an effective teacher for a full year while taking courses in a graduate program.
“You could end up becoming a pretty spectacular math teacher in a shorter amount of time than if you’re just studying things in an undergraduate program disconnected from student teaching,” she said.
Weak state policies
The report also grades every state’s policies on math instruction, from preparing teachers to coaching them after they’re in the classroom. California and two dozen states are rated “weak,” ahead of seven “unacceptable” states (Montana, Arizona, Nebraska, Missouri, Alaska, Vermont and Maine) while behind 17 “moderate” states, including Texas and Florida, and a sole “strong” state, Alabama.
The council bases the rating on the implementation of five policy “levers” to ensure “rigorous standards-aligned math instruction.” However, California’s actions are more nuanced than perhaps its “unacceptable” ratings on three and “strong” ratings on two would indicate.
For example, the council dinged the state for not requiring that all teachers in a prep program pass a math licensure test. California does require elementary credential candidates to pass the California Subject Examinations for Teachers, or CSET, a basic skills test, before they can teach students. But the math portion is combined with science, and students can avoid the test by supplying proof they have taken undergraduate math courses.
At the same time, many superintendents and math teachers may be doing a double-take for a “strong” rating for providing professional learning and ongoing support for teachers to sustain effective math instruction.
Going back to the adoption of the Common Core, the state has not funded statewide teacher training in math standards. In the past five years, the state has spent $500 million to train literacy coaches in the state’s poorest schools, but nothing of that magnitude for math coaches.
The Legislature approved $20 million for the California Mathematics Project for training in the new math framework, which was passed in 2023, and $50 million in 2022-23 for instruction in grades fourth to 12th in science, math and computer science training to train coaches and teacher leaders — amounts that would be impressive for smaller states, but not to fund training most math teachers in California. (You can find a listing of organizations offering training and resources on the math framework here.)
In keeping with local control, Gov. Gavin Newsom has appropriated more than $10 billion in education block grants, including the Student Support and Professional Development Discretionary Block Grant,and the Learning Recovery Emergency Block Grant, but those are discretionary; districts have wide latitude to spend money however they want on any subject.
Tucked into a section on Literacy Instruction in Newsom’s May budget revision (see Page 19) is the mention that a $545 million grant for materials instruction will include a new opportunity to support math coaches, too. The release of the final state budget for 2025-26 later this month will reveal whether that money survives.
Brown calls for hiring more math specialists for schools and for three-week summer intensive math leadership institutes like the one he attended in 1994. It hasn’t been held since the money ran dry in the early 2000s.
EdSource reporter Diana Lambert contributed to this article.