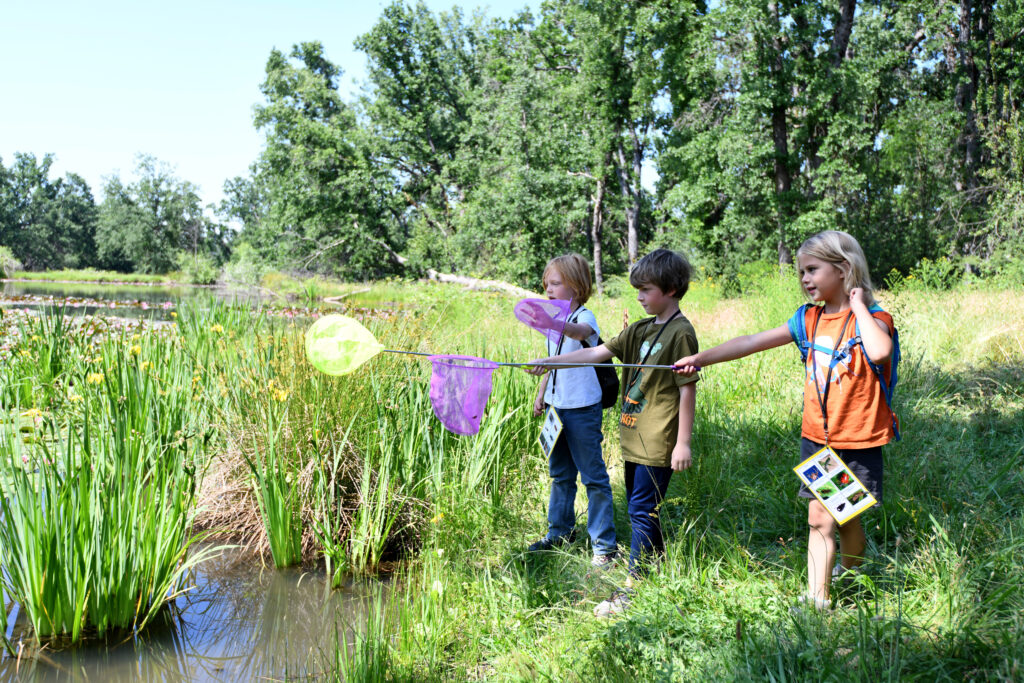

Students from Sierra Foothill Charter School use butterfly nets to gently catch, observe and release riparian species on Stookey Preserve.
Credit: Courtesy of Mariposa Arts Council
Clay Muwin River doesn’t need a studio to make art. A teaching artist for the Mariposa County Unified School District, River creates pieces of art amid the butterflies and woodpeckers on the banks of Mariposa Creek, sharing the magic of art in nature with TK-6 students. It’s a practice deeply rooted in the Indigenous culture that courses through the foothills of the Sierra Nevada in the heart of Gold Country, not far from Yosemite.
“Our cultural arts are deeply tied to our natural environment,” said River, a member of the Northeastern Passamaquoddy and Mi’kmaq nations but also an artist and storyteller grounded in the traditions of the Southern Sierra Miwuk. “We can’t actually practice our cultural arts without the environment being healthy.”
From weaving and quilting to pottery and mural painting, River taps into a native tradition in which art and nature have always been inextricably linked. The impulse to create is fueled by the beauty of the environment, the golden rolling foothills and green pastures.
“It’s one and the same,” said River. “I live and breathe this work. I didn’t choose it. It chose me.”
The mission of this art and environmental education camp, a collaboration between Mariposa County Unified School District (MCUSD), the Mariposa Arts Council and the Sierra Foothill Conservancy, is to give children a sense of connection to the natural landscape, how their lives are entwined with the health of the watershed, through a deeper understanding of art and ecology. This is arts education in the great outdoors, a limitless space where children’s imaginations can take flight.

“We are really focused on place-based education, being that we do have such a rich natural context around us and we want to make sure that our students are able to tap into that,” said Cara Goger, executive director of the Mariposa County Arts Council. “There are so many arts education opportunities that draw from the natural ecosystems and the cultural significance of Mariposa Creek.”
Cultural enrichment is woven together with scientific practice in an immersive art project. The students learn to harvest native plants, like elderberries, for food and medicine, while they are steeped in the richness of indigenous culture and the majesty of wildlife.
“I tell them to listen to their first teacher, the earth is the first teacher,” River said. “What is the ground telling you? What are the trees telling you? What are the animals telling you?”
A seamless integration of art, science and Indigenous culture, these day camps teach kids on many different levels at once, evoking all of their senses to engage their minds. That’s one reason River says challenging classroom behavior, which has spiked in the aftermath of the pandemic, seems to vanish in the open air.
“Being outside changes the children drastically for the better,” River said. “Behavior changes. It’s really different to sit in a chair inside a building for eight hours than to be outside looking at nature, rolling around in the grass, being able to take your shoes off and put your feet in the dirt. Children need that.”

A sense of place is the key here. Mariposa Creek is the unifying theme, providing the plants that are blended together to make dyes for watercolor painting, the willow stems for basket-weaving, and the clay for pottery-making. The creek is the star of the show, the source of both the art and the science that unfolds.
While some may associate the arts with densely populated, urban hubs, this art education program celebrates the universality of the artistic impulse. You don’t need a bustling downtown to find a thriving arts scene.
“So often we think of art in the built environment, the “house” art found in theaters and galleries,” said Letty Kraus, director of the California County Superintendents’ statewide arts initiative. “I appreciate the way this project nurtures civic engagement and acknowledges and connects the assets in the county that include the natural environment and the knowledge and culture of the Southern Sierra Miwuk Nation.”
The ongoing restoration of the creek, as a way to preserve the splendors of the foothills, is also at the heart of the project. The children learn about eliminating invasive species as part of fire mitigation efforts and studying the water to measure the health of the ecosystem.
“It’s a simple idea,” said River. “I’m showing them that water is life. If you look in the water and you see no life, if you don’t see any sort of microorganisms in there, no little tadpoles or fish, then the water is not well.”
All of these ecological lessons build off the connection the children already have with their environment. The creek emerges as an art studio and a laboratory rolled into one. The students also sometimes go on field trips to nearby Stookey Preserve and Yosemite’s Wahhoga Village.
“The kids are already out here playing in the creek, exploring their landscape,” said Goger. “When we build a curriculum that focuses on something they’re already familiar with, they bring their own knowledge and understanding to that. Hopefully, afterwards, their investment in that landscape is even deeper. One of the things we really try to drill down on with the restoration of the parkway is instilling the idea of stewardship of the land.”
Families have responded enthusiastically to the program, which launched in 2022 and has thus far been paid for with Expanded Learning Opportunities Program (ELOP) money, but may be expanded through Proposition 28 funding in the future. Administrators hope to build ways to connect the camp with in-classroom study and create an after-school program going forward.
“All my time in education, I have never seen such overwhelmingly positive parent surveys. It’s been fantastic,” said Lydia Lower, assistant superintendent for educational services for MCUSD. “Parents are seeing that their kids are engaged in really healthy, productive activities. And they’re learning not only from an academic standpoint but from a living standpoint. What does it feel like to express yourself? What does it feel like to be part of a collective? What does it feel like to be working for the betterment of your community?”
Ambitious goals are part of what elevates this arts camp into an experience that may fundamentally shift how children see the world. Certainly, the marriage of sustainability and survival, the way humans and the environment perish or flourish together, runs through all the art lessons River teaches.
“Place is all we have,” said River. “Not to keep going back to an indigenous view, but home has never been a building. That’s why tribes stay. Not just because that was the reserved parcel that was given. It’s the land that is home. We’re teaching children that if you take care of this space, it’ll be here forever for you. This can be forever home.”