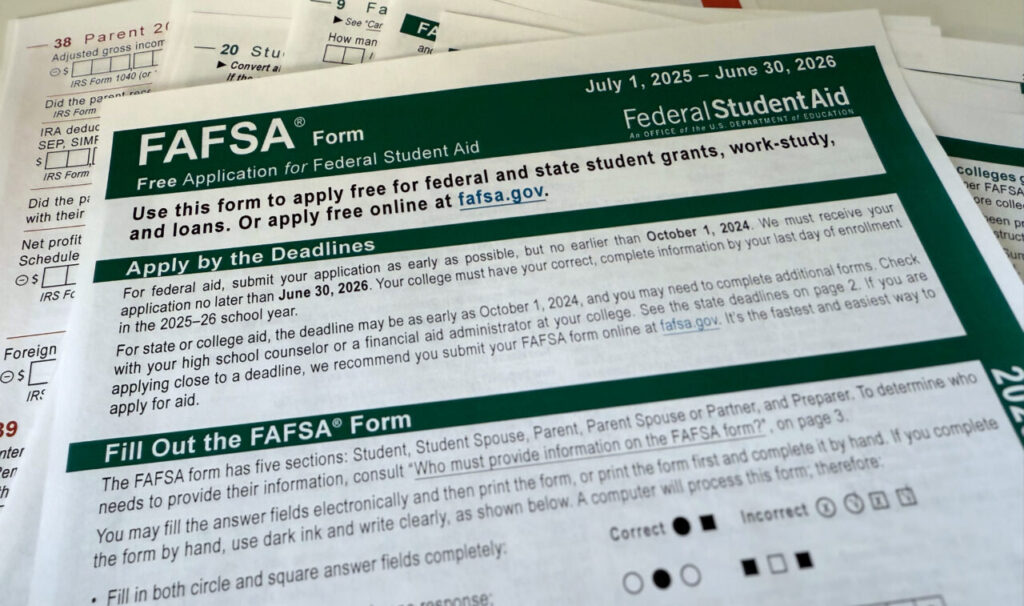
California’s community colleges have dispersed $14 million and likely much more in financial aid to fraudsters.
The U.S. Department of Education says colleges must verify the identities of more students this summer. In the fall, it plans to launch permanent screening.
Colleges worry that the new measures could burden students too much and prevent some from enrolling.
California colleges are worried that new federal measures seeking to crack down on financial aid fraud, which has stolen millions in grants, could result in the unintended consequence of fewer legitimate students enrolling.
At California’s community colleges, where the fraud has been most pronounced in the state, financial aid officials hope the new steps will strike a balance between deterring bad actors while also minimizing the burden on real students. Some students may find taking extra steps to prove their identity to be an extra barrier to enrolling, possibly scaring them off, administrators say.
“How do we do fraud mitigation, but also still have students apply? The more barriers, the harder we make it to get in our systems, the less people will come,” said Tina Vasconcellos, associate vice chancellor of educational services at the Peralta Community College District. “It’s great the federal government wants to help us and cut down on fraud, but at the same time, is it going to create another hoop for our students to jump through to get to us in the first place?”
The U.S. Department of Education announced last month it will roll out new ways to verify the identities of students who apply for aid. Most of the fraud has tapped federal aid, in the form of Pell Grants intended for low-income students, but some state and local aid has also been stolen in California and elsewhere.
The federal department said it would require colleges this summer to verify the identities of additional first-time applicants. That will apply to about 125,000 students in total nationwide, but the department didn’t say how that will be split among the colleges. To get verified, students will have to show government-issued identification such as a passport or driver’s license. If the college determines that a student is unable to show the identification in person, the student can be given the option to do so on a video call.
“Although we recognize that these verification selections could be challenging for some institutions and students, it is a critically important and targeted step toward preventing fraud,” the department wrote in an announcement.
The additional verification for the summer term is only a temporary solution before the department implements a permanent screening process for every financial aid applicant for the upcoming fall term.
Officials have not said what that process will entail in the fall. Among the possibilities, college officials speculate that requiring more students to come in person to prove they are real, which could be potentially challenging for students who live far away and take entire course loads online.
Community colleges have been plagued by financial aid scammers who target those institutions because they are open-access and offer many classes fully online. That makes it much easier to enroll in classes online and be eligible for aid. At least $14 million in aid, and likely much more, has been dispersed to fraudsters at California community colleges since 2021.
It’s also easier to defraud community colleges than more expensive universities because tuition is so low or otherwise covered, and much of the grants go directly to students for living costs, rather than to the colleges for tuition.
“We don’t know what the plan is for the fall,” said Jill Desjean, the director of policy analysis at the National Association of Student Financial Aid Administrators. Ideally, Desjean said, the process would be automated so that additional steps aren’t required of students or staff. “There’s just a limit to what the schools can do.”
Pretending to be legitimate students, fraudsters start by applying for admission online. Some of them are caught there, but others successfully get admitted and enroll in classes. At that point, they can request financial aid, which, if they’re successful, gets distributed to personal bank accounts via direct deposit.
Beyond stealing aid, the scams have additional consequences for real students. Since each course has a finite number of seats, genuine students are sometimes left on waiting lists and can’t enroll because fraudsters are taking up the available seats.
In a statement when the new measures were announced, U.S. Secretary of Education Linda McMahon said the department “has a responsibility to act” because fraud is “taking aid away from eligible students, disrupting the operations of colleges, and ripping off taxpayers.”
Jasmine Ruys, vice president of student services at College of the Canyons in Santa Clarita, acknowledged that “it’s our job to make sure that fraud is not happening and that we’re good stewards of taxpayer money.”
She added, though, that the college strives to balance that responsibility with not asking too much of students.
“Some students work during the day, so they might have to take time off work to be able to come over to us to verify,” Ruys added. “So we try really hard not to put any kind of barriers up for a student.”
Even being asked to upload additional documents online could be difficult for some students, said Vasconcellos of the Peralta district, which serves Oakland and the rest of northern Alameda County.
“We still have a digital divide. There are students within our community who have less access to all aspects of technology,” she said. “A lot of our students are actually still using their phones to take their classes. So what I’d be concerned about is if the technology on the receiving end isn’t working and if it’s not easy to upload your ID, or whatever it is that they’re asking for, it’s going to potentially be a barrier.”
Vasconcellos and Ruys both said they’re hopeful that whatever the department implements this fall will be something that doesn’t require much extra from students.
One possible solution, Ruys said, would be to add something at the beginning of the Free Application for Federal Student Aid (FAFSA), so the verification happens quickly rather than when students are getting ready to start their classes. That could be something similar to ID.me, an online identity verification platform already being used by many community colleges.
It’s not clear, however, whether the department is considering that option.
“Whatever it is, we’re going to abide by all laws,” Ruys said. “We just hope that it doesn’t limit our students from being able to enroll and attend college.”
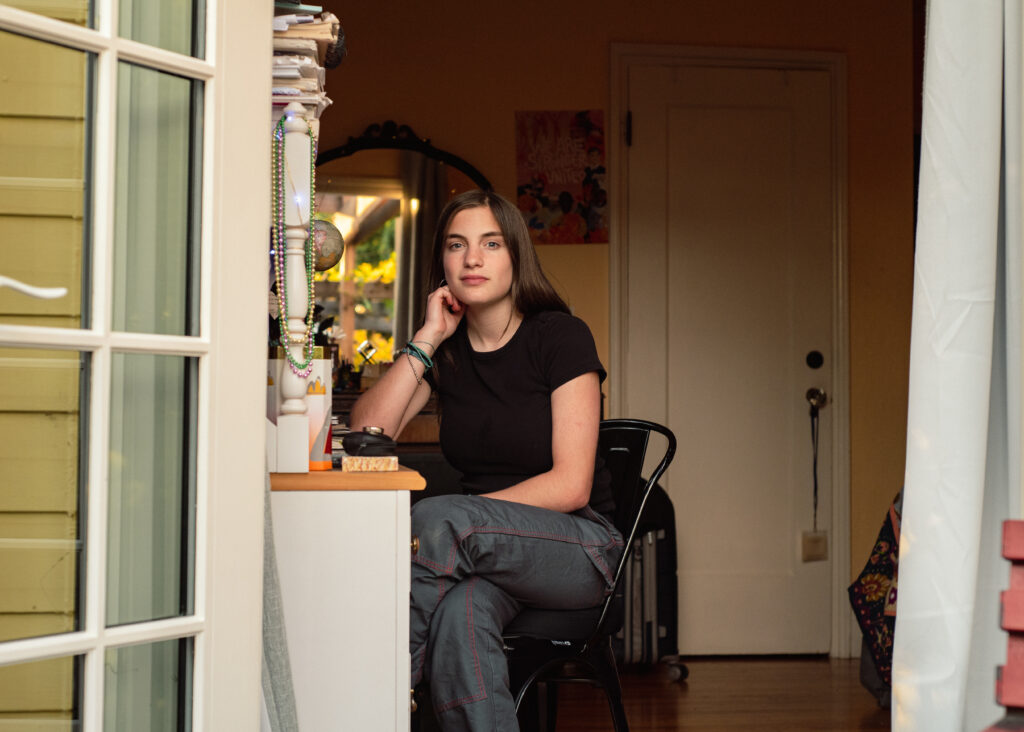
Eva Levenson, now a sophomore at Berkeley High School, has struggled with dyslexia since childhood but private phonics-based intervention made a difference. “I don’t understand what’s in the way of making a shift when, both in other states and locally, districts are able to help kids now,” she recently told the school board. “How is it possible we aren’t doing it in Berkeley right now?”
Credit: Ximena Natera / Berkeleyside / CatchLight
This story is a collaboration between EdSource and Berkeleyside, a nonprofit online newsroom covering the city of Berkeley. EdSource Reporter John Fensterwald contributed to this report.
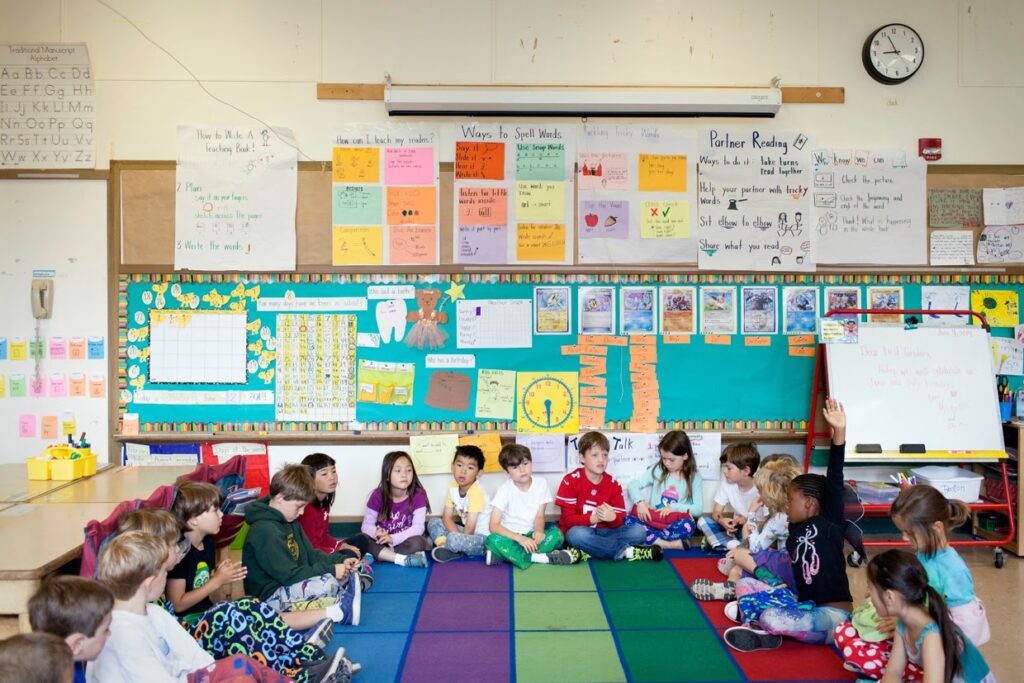
How kids are taught to read in Berkeley is slowly starting to shift.
Teachers are studying the science of reading. More students are learning phonics, sounding out words by letters and syllables. And the school district is screening every student to flag those who may have dyslexia, a learning disorder that causes difficulty with reading, writing and spelling.
But these changes didn’t come easily. They are the result of a federal class-action lawsuit, filed in 2017, by four families of Berkeley students with dyslexia who claimed the district failed to teach them how to read.
And though the suit settled in 2021, the district’s method of teaching reading, a balanced literacy curriculum developed by Columbia University Teachers College professor Lucy Calkins called Units of Study, remains in place.
Rather than teaching students to sound out letters, the curriculum relies on a method called three-cueing — where students use context clues like pictures to figure out words — that has now been discredited and banned in several states. Some Berkeley teachers still use cueing, while others have dropped the practice.
Now, the wheels are just beginning to turn in a district long devoted to Calkins. Advocates hope that aligning with the science of reading will help close one of the largest achievement gaps in the country — last year, 26% of Black students in Berkeley schools met state standards in reading, compared with 83% of white students.
“Historically, Berkeley has been — and is — widely known for being a balanced literacy district,” Superintendent Enikia Ford Morthel said during a November panel discussion referring to the Calkins teaching method.
Enikia Ford Morthel, Berkeley schools superintendent, right.Credit: Kelly Sullivan / Berkeleyside
“What we want to be known for is being a district that is disrupting the narrative, disrupting persistent trends and data and really responding to our students,” she said. “This is not just another initiative. This truly is an imperative.”
Some students and parents aren’t yet convinced. Without a firm commitment to adopt a curriculum rooted in the science of reading, they are skeptical that they will see all the changes they believe are long overdue.
“At some point, you have to take responsibility,” said Rebecca Levenson, a parent of two children with dyslexia. Levenson wasn’t part of the lawsuit against the district, but she believes “it’s important for parents who see their children suffer to use their voice and power to make a difference for other families that are in that same situation.”
The Berkeley lawsuit was the second filed in California in 2017 over literacy instruction. In the other suit, the public-interest law firm Public Counsel charged on behalf of students in the lowest-performing schools that California had failed to meet their constitutional right to read. Under a $50 million settlement in 2020, 75 schools received funding and assistance to improve reading instruction. They were encouraged, but not mandated, to select instruction based on the science of reading.
While a district review of its elementary school literacy curriculum found that Units of Study failed to teach foundational literacy skills like phonics and vocabulary, Ford Morthel has stopped short of calling on the district to drop Lucy Calkins. The district is now beginning the process of adopting a new curriculum for the fall of 2025.
At a recent school board meeting, George Ellis, the court-appointed monitor, hammered home the importance of changing the Calkins curriculum. Without a “sound, comprehensive” core curriculum, he said, “it doesn’t matter what interventions we’re really providing, because we’re just filling up holes all over the place, and we’re never going to get caught up here.”
Attorneys and advocates hope the Berkeley lawsuit will spur other school districts to act faster to avoid legal action, accelerating the adoption of the science of reading in California and across the country. But Berkeley’s experience also demonstrates just how many barriers stand in the way of changing reading instruction.
Berkeley’s reading guru
When Lucy Calkins developed her approach in the 1990s, the balanced literacy teaching method was heralded as a new philosophy of education. Rather than teaching from rigid phonics textbooks, teachers introduced students to an entire library of independent books with the goal of teaching kids to love reading.
Calkins was the “guru of reading for people in Berkeley,” said Maggie Riddle, a former teacher and principal at Berkeley’s Jefferson Elementary, now called Ruth Acty. Once Calkins’ approach came to Berkeley, phonics came to be seen as a rote, old-school way of teaching, “dumbing down” instruction. “Berkeley was anti-phonics. One hundred percent,” Riddle said.
Berkeley wasn’t alone in this. Balanced literacy once enjoyed nearly universal popularity. “It was being used in every single Bay Area district,” said Deborah Jacobson, a special education attorney who brought the suit, a federal class action, against the Berkeley district seven years ago.
Special education attorney Deborah Jacobson, photographed at home on this month, brought up the federal class action lawsuit against the Berkeley school district in 2017. Credit: Ximena Natera / Berkeleyside / CatchLight
But the approach has fallen under fire amid a national reckoning over reading instruction, with a consensus growing that balanced literacy goes against what we know about how the brain works when learning to read.
This understanding anchors the science of reading, an approach backed by decades of exhaustive scientific research that suggests most children need systematic lessons in phonics, or how to sound out words, as well as other fundamentals, such as building knowledge and vocabulary, to learn to read. Teaching foundational reading skills especially benefits English learners. Advocates say reading is a civil right and phonics helps bring social justice to Black students.
More than half of states have passed laws requiring schools to align with research-based methods or favoring phonics. In September, Columbia University cut ties with the Reading and Writing Project that Calkins led for decades, citing the need to seek out new perspectives. Calkins herself has revised her curriculum to incorporate more explicit instruction in phonics and phonemic awareness.
A decade ago, California adopted a framework for K-12 literacy that encouraged districts to use evidence-based reading instruction, now commonly called the science of reading. But it wasn’t required, and the state didn’t push districts to adopt it.
Still, advocates say these changes don’t go far enough. The California Early Literacy Coalition plans to sponsor legislation that would create a comprehensive state literacy plan, mandating training in the science of reading for all teachers, not just new ones, and requiring the use of textbooks rooted in the approach.
In Berkeley, lawsuit cast a light
When Berkeley Unified was sued in 2017, Riddle said she saw it as an opportunity. She had moved up through the ranks to become head of K-8 schools and led legal negotiations for the district for two years. “Nobody ever wants the district to be sued, but it cast a light on the needs of kids in reading, especially kids with dyslexia,” Riddle said.
Not everyone saw it that way. It took five years to reach a settlement agreement, and the district’s core curriculum was a sticking point in negotiations. “The resistance was serious, but the lawsuit was serious, too,” recalled Riddle. During negotiations, the district implemented Fast Track Phonics to get phonics instruction into classrooms, but advocates criticized the decision as putting a Band-Aid on a broken system, leaving the core Calkins curriculum intact.
Berkeley signed the settlement agreement in 2021, but due to the pandemic, didn’t start working on implementation until the following year, extending the three-year plan until 2025. Initially, Ellis, the court monitor, criticized the school district and its board for failing to embrace the settlement. And in February, Jacobson said the district had breached the settlement agreement by moving too slowly, but decided not to file a notice in court after district leaders promised action.
In the last year and a half, the district has started taking steps toward the science of reading.
Elementary teachers did a book study of “Shifting the Balance,” an introduction to science of reading practices. The district implemented a universal screening system to flag students who might have dyslexia and started training literacy coaches to implement phonics-based intervention programs like Orton-Gillingham and Heggerty. The district also established a new department of curriculum and instruction, hired a districtwide literacy specialist, and began developing a multi-tiered system of support for struggling readers.
The district’s new focus has made a huge difference for some teachers, even those with decades of experience.
Angélica Pérez, a reading specialist at Thousand Oaks Elementary, said though she has known about phonics for years and even taught it, only recently has she received the systematic training she needed to implement it well with struggling readers.
In my 26 years in education and 15 years in the classroom, I wasn’t so aware of the importance of phonemic awareness.
Angélica Pérez, a reading specialist at Thousand Oaks Elementary in Berkeley.
The changes have won over some of the district’s critics, including Jacobson. “There is a new sense of urgency with the new administration and a new level of commitment,” Jacobson said. “Every year the light bulb seems to go on, more and more.”
Angélica Pérez’s reading room at Thousand Oaks Elementary School allows children to explore leisure reading. A longtime reading specialist, Pérez uses a phonics and phonemics curriculum to help struggling students. Credit: Ximena Natera / Berkeleyside / CatchLight
They have also earned the praise of the teachers union president. “There is a systematic plan to make sure our teachers are getting what they need so they can do their jobs best,” said Matt Meyer, president of the Berkeley Federation of Teachers.
Cost to students of the lengthy legal fight
For families whose children struggle with reading, Berkeley’s decades-long commitment to balanced literacy came at a price. Many students with dyslexia have either missed out on learning, or their parents have paid thousands of dollars in private tutoring to catch them up.
“After a certain point, the research shows that it becomes unrecoverable,” said Eliza Noh, a Berkeley parent who has a child with dyslexia. “The early years for teaching people how to read are critical.”
Levenson’s two children, Eva Levenson and Wen Dolphin, both have dyslexia and attended Berkeley schools 18 years apart. But Eva received private reading intervention, while Wen did not. The family says their experience shows the difference phonics-based intervention can make.
Rebecca Levenson and her youngest daughter,Eva, talk in their West Berkeley home. Levenson’s two children, Eva and Wen, who is in his late 20s and lives in Colorado, have struggled with dyslexia throughout their academic careers. Credit: Ximena Natera / Berkeleyside / CatchLight
Dolphin dropped out of school at 15, while Eva, now a sophomore at Berkeley High, is taking the same challenging classes as her peers. She began writing for The Jacket, Berkeley High’s student newspaper, and in October, penned an article about the Calkins curriculum.
“I know that my life trajectory could have been very different if I would have had the support that I needed in those really formative years,” Dolphin told a crowd at a Berkeley school board meeting last year.
When Lindsay Nofelt’s son was diagnosed with dyslexia, she shelled out thousands of dollars on a phonics-based intensive reading intervention program. Her son’s reading ability improved quickly, but what took Nofelt longer to piece together was Berkeley’s role in her son’s story.
Even after listening to Emily Hanford’s podcast “Sold a Story,” which thrust Calkins’ curriculum into the spotlight, she didn’t connect the literacy debate to Berkeley schools.
“I thought, if Emily Hanford is writing about this and sounds like it’s not serving the needs of the students, then there’s no way that Berkeley Unified school system would use such a discredited curriculum,” Nofelt said.
Students relax at lunchtime at Willard Middle School in Berkeley in August 2022. Credit: Ximena Natera / Berkeleyside/ CatchLight
But over time, Nofelt realized her son wasn’t the only one in Berkeley struggling with reading. As she learned more about the science of reading and the class-action lawsuit, she realized that the kind of reading instruction Hanford was describing in her podcast was happening in Berkeley. “When I found out they were one and the same, all of the pieces fell into place,” she said.
Two years ago, Nofelt formed Reading for Berkeley to educate parents about early literacy and give them resources to advocate for their children. It’s now a resource that Nofelt wishes she had when she was trying to help her son — digestible content designed to help families ask questions about their children’s literacy education and support their reading abilities.
Today, students with dyslexia and their parents are watching Berkeley closely, their hope resting on the district’s commitment to the science of reading.
At a recent school board meeting in January, Eva Levenson told the Berkeley school board directors and superintendent that she is still waiting to see a plan that addresses the failure of the district’s core curriculum.
“I don’t understand what’s in the way of making a shift when, both in other states and locally, districts are able to help kids now. How is it possible we aren’t doing it in Berkeley right now?”
Some of the most cited reasons for exiting the profession include polarizing politics, division over the effects of the pandemic-related school closures, and stress.
“No matter what we may have thought, superintendents became the public face of the pandemic and, in most instances, they were merely following public health dictates,” said panelist Carl Cohn, former superintendent of the Long Beach and San Diego school systems.
Four out of the five panelists on the roundtable left their superintendent positions within the last four years. At least one cited the Covid-19 pandemic as his reason for leaving sooner than he planned.
They are far from alone: Superintendent turnover in California grew by nearly 10 percentage points between the 2019-20 and 2020-21 school year, according to research by Rachel S. White of the University of Tennessee, Knoxville. After the 2021-22 school year, over 18% of superintendents across the state stepped down.
“In many cases, it’s not just the divide, but it’s how people are treating each other,” said Chris Evans, who stepped down as superintendent of Sacramento’s Natomas Unified after 11 years. Evans left the position in 2023 after years of personal, hateful threats, some of which led the school board to agree to pay for security at his home.
It’s evident that much of the political divide seen at a national level is mirrored in California, some panelists said.
“Anybody who thinks that California is this special place that somehow isn’t part of this national partisan divide… it is really front and center,” said Cohn, now a professor emeritus and senior research fellow at Claremont Graduate University. “So I think we need to spend more time on these issues of who are the good people who can facilitate dialogue across interest groups.”
Agreeing with Cohn, Gregory Franklin, who served as superintendent of Tustin Unified School District in Orange County for 10 years, added that many superintendents have good relationships with their school board. But he noted that it’s often new school board members who aren’t always well-versed in the importance of a good relationship between the two.
“How do you bring on board these new board members so that they understand the roles that they’re stepping into, what the role of individual board members is, as well as the superintendent, so that they can try and work in service of children?” he asked, citing the Association of California School Administrators and the California School Boards Association as two potential resources for this issue.
Public division between superintendents and school board members, panelists said, has become a significant part of why school districts statewide are finding it difficult to attract new superintendents for the positions left vacant by those stepping down.
Particularly worrying to many of the former superintendents was the issue of potential state budget cuts.
Some pointed out that the high turnover rate of superintendents in just the last four years has resulted in lower overall experience in the role, just as school districts might begin facing years of financial instability. Their expertise, especially from those who served as superintendents during and after the 2008 recession, could be crucial at this time, they added.
To increase retention of current superintendents, the panelists suggested greater support for them in the form of mentorships.
Cathy Nichols-Washer, for example, said that “from Year 1 to Year 20” of her time as superintendent of the Central Valley’s Lodi Unified, “there were times when I needed someone to be a sounding board or even to give advice as a mentor.”
While she suggested “a veteran superintendent” or “someone in a like position that they can call on,” panelist Vivian Ekchian proposed looking beyond those in the same field.
That might look like “building cross-sector solutions with communities and community members to solve not just academic but resource, equity, enrollment challenges,” said Ekchian, who recently retired as superintendent of the Glendale Unified School District.
In addition to a support system, perhaps either the California School Boards Association or the state could offer “annual opportunities for members of the public who might consider running for a school board to come in and understand what the job’s really about,” said Evans of Natomas Unified.
Given that many superintendents have a background in education, panelists agreed they are often well-versed and trained in building trust and compromising.
“We know how to work with people, we know how to listen, we solve and come to compromises about differences in our interests, and we’re used to that,” said Franklin, the former Tustin Unified superintendent of Tustin Unified. “This new idea, though, where people are coming in with a set agenda and not interested in a conversation and not interested in reaching an understanding — it’s much more political science than it is social science.”
In his current role as professor of education at the University of Southern California, he said they have “retooled” many courses “in preparing superintendents to talk about politics and political strategy.”
Panelists also agreed that public support for superintendents by their school board is paramount in order to attract new talent. As Ekchian stated, public support is important both “in the best of times and also in the most politically charged elements that we see sometimes.”
That support leads to a strong team between the superintendent and the school board, added Nichols-Washer.
“It’s all about building a strong governance team; so, a board that is supportive, very clear with expectations, very focused on students and student outcome and student achievement as their priority, strong vision and mission, and ready to support the superintendent as they carry out the goals and directions of the board,” she said.
The shared expertise among the former superintendents on the panel also led to considering themselves as potential mentors for those currently on the job.
“I think it’s a great opportunity for retirees like us to get back in and help superintendents and chief business officers and cabinets and boards who haven’t gone through the budget reduction and the times they’re going to face … to be those coaches and mentors and help them manage what we all have done multiple times — and probably is why we all retired and some of us retired early, right?” said Evans.
And complex as the job of superintendent may be, the discussion ended with panelists offering advice for current and future superintendents. The insight ranged from having a coach built into their contract and relying on county offices for building relationships to forming affinity groups specific to superintendents’ diverse identities and focusing on listening.
“We’ve talked a lot about the challenges … but being a superintendent is the best job I’ve ever had, and I wouldn’t have traded it for anything,” said Nichols-Washer. “The most important thing, I think, in being successful in this job is the relationship with the school board. If you have a strong, trusting relationship with your school board members, they will stand by you and they will back you and they will make it a joyful job.”
We often talk about the “core curriculum” as the center of our education system, the most essential content for students to master in order to be prepared for their futures. For most, it includes English, math, science and social science. Many support the inclusion of multilingualism, the arts and career-technical education.
With the advances of the past century, isn’t it time to re-evaluate what is “core”? What competencies do young people need to face future challenges? How can they be the drivers of their own learning? Why is it so difficult to change legacy thinking?
Our education system is separated into, and organized around, these discreet “core” subject areas. They are the basis for students’ class schedules, schools’ departmental structures, teachers’ credentials, and universities’ admissions requirements. They are the focus of student report cards, state standards, standardized tests, tutoring programs and accountability measures.
Yet, over the past decade, when more than 75 school districts across California have engaged their communities to develop a “graduate profile” or “portrait of a graduate” by asking their community members what skills, competencies and mindsets are most essential for young people to be successful, the core subject areas are not ranked at the top. Rather, respondents (or community members) say that students should be creative and critical thinkers, effective communicators and collaborators, self-directed lifelong learners, culturally competent and globally aware citizens, technically and financially literate, adaptable and resilient, and kind and curious. This represents a more holistic and integrated approach to teaching and learning. In fact, a recent WestEd report verified that these competencies are most frequently cited in districts’ graduate profiles; the academic content areas fell further down the list.
For decades, employers have identified a similar set of competencies as critical for success in the workplace. While colleges and universities tend to default to core content requirements, when pressed they agree that the same competencies are critical for a young person’s success in postsecondary education. And, wouldn’t we all want informed and productive citizens to embrace these skills? Are they not core?
These ideas are not new. Nearly 20 years ago, the Partnership for 21st Century Skills created the P21 Framework, often simplified by practitioners to “the 4Cs” — collaboration, communication, creativity and critical thinking.
My goal is not to establish an either/or argument, but rather to suggest a rebalancing for current and future generations. Granted, much of our society still stands behind “the three R’s” — reading, (w)riting, and (a)rithmatic — and will argue until blue in the face that these skills are most essential. They are! Yet, in this day and age, when information is available at our fingertips 24/7 and artificial intelligence can organize that information in coherent ways, what should we consider as core?
Content will always be central to our schools. If we were to formally elevate the importance of the 4Cs, and even organize around them, students still would have to think critically about something, collaborate around something, and communicate something. That “something” is the content, and teachers can be creative about how to integrate key standards. But, what would it look like if we were to rebalance the priorities?
We wouldn’t have to look far to find examples of small but significant shifts. Several school districts (such as Davis and Novato) have modified their elementary report cards to reflect their graduate profile outcomes. Anaheim Union High School District employs “5Cs coaches” at each of their 20 school sites to help teachers integrate the 5C skills into everyday lessons and projects (5Cs = 4Cs + compassion). In order to graduate, some districts (including Pasadena and Anaheim) require students to demonstrate their graduate profile outcomes through senior projects, portfolio defenses or capstone interviews.
District efforts to rebalance the priorities of our education system — by creating a graduate profile and working to operationalize it — have been underway for well over a decade, but progress has been slow because the state (the Department of Education, State Board of Education, Legislature, and Governor’s Office) has been slow to incentivize, encourage, and/or support local efforts through funding and policy. Many other states have done so.
What might it look like if formal structures existed to intentionally prioritize a new core set of competencies? For example, what if students could earn digital badges for their demonstration of the 4Cs, to be used as portable credentials for college admission and employment? What if teachers could earn micro credentials for the effective teaching of the 4Cs? What if the state’s data and accountability systems captured student progress on the 4Cs? In more creative and less formalized applications, what if field trips, after-school and summer programs centered on 4C skill development? What if administrators selected the teacher-of-the-month based on impressive 4C instruction? What if foundations awarded scholarships and/or (like in Petaluma) students voted on the homecoming court based on student demonstration of the 4Cs?
Recently, I facilitated a team of educators and community members working to implement their graduate profile. When I asked the father of a Latina 12th grader whether he thought the traditional transcript or the graduate profile most reflected what his daughter needed for her future success, he pointed to the graduate profile.
●●●
Roman Stearns is the executive director of Scaling Student Success, a California partnership dedicated to educating the whole child, leveraging the power and potential of a community-developed “graduate profile” or “learner portrait” as a driver for transformational change.
The opinions in this commentary are those of the author. If you would like to submit a commentary, please review our guidelines and contact us.
An early arriving audience member sits amidst empty seats with campaign signs for former President Donald Trump at Fiserv Forum in Milwaukee, Wis. during the first day of the Republican National Convention on Monday.
Credit: Francis Chung/POLITICO via AP Images
While the assassination attempt on Donald Trump overshadowed discussion of policy issues at the Republican convention in Milwaukee on Monday, the GOP’s platform committee nonetheless adopted a 20-page party platform on Monday in which education features prominently.
The platform is a reminder that a slew of controversial issues, from how the racial history of the United States is interpreted to complex issues around gender identity, are still very much alive on the political stage.
The last time the GOP had a platform was in 2016, when Trump first ran for president, and it was a hefty 60 pages long. The current one is stripped down to a third the length reflecting what are core priority issues for the former president. Trump himself was key in shaping it — and his imprint is evident throughout, down to the use of capital letters in odd places.
As Sen. Marsha Blackburn, R-TN, the chair of the platform committee, said yesterday, Trump had “personally reviewed, edited, and approved” the platform.
Most of the platform consists of issues drawn from the culture wars that have roiled many school districts around the nation in recent years. In a typical pledge, the platform argues that children should be taught “fundamentals like Reading, History, Science and Math, not Leftwing propaganda.” The focus, it says, should be on “knowledge and skills,” not “CRT and gender indoctrination.”
Other party positions include:
“Defunding” schools that engage in what the platform calls “inappropriate political indoctrination of our children using federal taxpayer dollars.”
Supporting schools that “teach America’s Founding Principles and Western Civilization” while promoting “Fair and Patriotic Civics Education.”
Championing the “First Amendment Right to Pray and Read the Bible in schools.”
“Hardening” schools to protect against gun violence or other physical threats. “Hardening” typically refers to arming teachers, and erecting a range of physical barriers, from door locking systems to surveillance cameras, in lieu of gun regulation measures.
Keeping on the front burner the GOP push for “Universal School Choice in every State in America,” the central goal of the first Trump administration and Betsy DeVos, his secretary of education.
The GOP platform draws ideas from, but does not specifically endorse Project 2025, the Heritage Foundation’s detailed blueprint for a second Trump term.
Trump has tried put some distance between himself and Project 2025, but that was mostly because of its extreme positions on abortion — including banning the abortion drug mifepristone — and not because of any major objections to its 44-page education blueprint.
Some key education items in the platform are recycled from earlier ones, and reiterate promises Trump has made on the campaign trail. That includes vowing to close the U.S. Department of Education and “send it back to the states where it belongs.” This is an idea that Ronald Reagan first proposed in 1985 — and which Republicans have yet to deliver on.
The platform also endorses ending teacher tenure, and giving educators merit pay increases — in contrast to union-negotiated contracts in which salaries are based principally on years worked, and the number of college course credits and degrees earned.
But even as the GOP pushes for federal education policies to devolve to state and local levels, the platform makes no reference to the fact that the federal government has relatively little say over what happens in schools. That is much more a function of state and local school board policies.
What’s more, only about a tenth of state and local education funding comes from Washington, D.C. For that reason alone, it is unclear how much of the GOP platform could actually be implemented.
Contrary to expectations raised when Florida Gov. Ron DeSantis made attacks on alleged “woke” education policies related to gender and racial identity a centerpiece of his presidential campaign, education issues have played a relatively small part in the presidential race so far.
That’s likely because other issues like inflation, immigration and abortion are now more salient among voters’ concerns. Another factor was that DeSantis’ focus on hot-button education issues proved to be useless in promoting his ultimately unsuccessful campaign.
So, while education is unlikely to be a major item of discussion at the GOP convention, or even in the remaining months of the presidential race, it’s clear from not only the party platform, but also from Project 2025’s detailed agenda, and Trump’s own recent statements, that numerous education issues that have sparked controversy and conflict are still very much on the GOP agenda.
And many if not all of them have the potential to be revived in a second Trump term.
This is the first of two commentaries on the education platforms of the GOP and the Democratic Party. This week the Democratic Party is expected to release its full education platform that delegates will vote on at its convention in Chicago in August.
•••
Louis Freedberg, a veteran journalist who has written about education in California and nationally for more than three decades, is interim CEO of EdSource.
The opinions expressed in this commentary represent those of the author. EdSource welcomes commentaries representing diverse points of view. If you would like to submit a commentary, please review our guidelines and contact us.
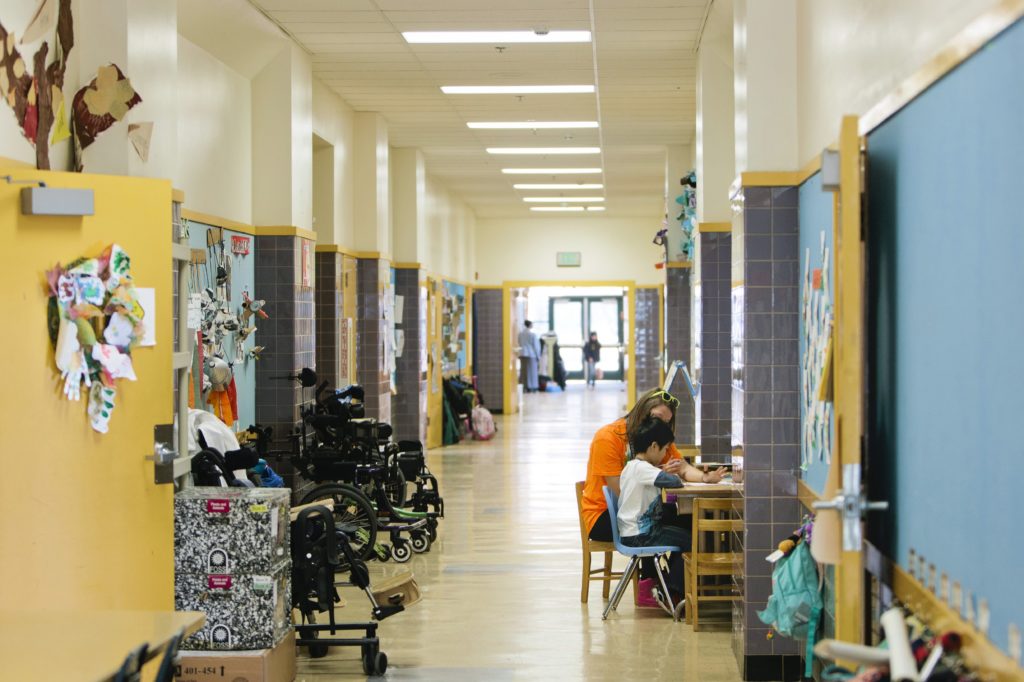
Special education has been inconsistent in California schools since the coronavirus pandemic.
Alison Yin/EdSource
When the Covid-19 pandemic led to school shutdowns in 2020, and students began plugging into their classes online, Naomi Burn saw her 17-year-old son’s grades soar.
Her son seemed more engaged, completed his assignments and was in better spirits. The virtual classes seemed to serve him better. So, when face-to-face instruction returned, Burn decided to enroll him in one of the district’s virtual academies, where he would also be able to receive the counseling outlined in his individualized education program (IEP).
But in October 2023, Burn received an unexpected message from her son’s psychiatric social worker, who had previously provided him with the support he needed.
“He was removed from my caseload at the start of the year, and due to staffing issues, none of the virtual students are receiving their IEP services,” the email read. “I hope they are able to find a solution soon, so that he may begin to access this support.”
Several months later, Burn received an email from the district offering a solution: a chance to make up for lost services whenever the district has adequate staffing. Karla V. Estrada, LAUSD’s deputy superintendent of instruction, told EdSource in January that any problems with unfulfilled IEPs at Burn’s son’s school had been fixed.
On Jan. 9, the next day after Estrada’s statement, Burn said nothing had changed. No one had reached out to her. Her son’s educational plan and needs were still not addressed, and the family was still waiting.
“I understand it’s a societal issue,” Burn said. “But, at the same time, today’s counseling minutes don’t help the child with yesterday’s emotional social barriers.”
Burn is one of many parents in the Los Angeles Unified School District who say they have struggled to get their children adequate disability accommodations and support this past academic year. They say the district has been largely unresponsive and are concerned about possible repercussions for their children.
Experts warn that not providing accommodations in a timely manner could worsen students’ disability symptoms, while adding additional hurdles, including social and emotional challenges.
Meanwhile, the number of district students with disabilities continues to grow, and teachers have sounded alarms that as their workloads skyrocket, more student needs could go unaddressed.
“There’s no time like the present. Right, time only moves in one direction,” said Rebecca Gotlieb, a human developmental psychologist and educational neuroscientist at the University of California Los Angeles. “And I want every student to have all the supports they need.”
When students were attending school online, LAUSD allegedly decreased services provided to students with disabilities and failed to properly track them, according to the U.S. Department of Education investigation.
The agency also found the district informed its staff that LAUSD was not responsible for school closures and was therefore “not responsible for providing compensatory education to students with disabilities,” according to the report.
Meanwhile, the investigation determined that the district “failed to develop and implement a plan adequate to remedy the instances” when students with disabilities were not provided access to a fair public education during remote learning.
Soon after the investigations, the district entered an agreement with the agency, promising to address the Department of Education’s concerns.
“Today’s resolution will ensure that the more than 66,000 Los Angeles Unified students with disabilities will receive the equal access to education to which federal civil rights law entitles them,” Assistant Secretary for Civil Rights Catherine E. Lhamon said in a 2022 media release.
“I am deeply grateful for the district’s commitment now to meet the needs of its students with disabilities.”
Estrada told EdSource that the district conducts a report at the beginning of each academic year to find out how many students aren’t receiving the services they are entitled to and need. The process also helps the district come up with solutions, including providing services retroactively once they are available, she said.
“There are certain students that aren’t receiving special education services or as outlined in their IEPs,” Estrada said. “Sometimes, it’s not that they’re not receiving services, but not to what has been prescribed in the IEP.”
Less than a year after the investigation, parents and advocates sounded alarms that the district was not following through on their promises and that children were still going without necessary supports.
Lourdes Lopez is one of many LAUSD parents who have had to work tirelessly to get the necessary support for their children. She has two children with disabilities who rely on speech and occupational therapy.
“As a parent, we’re begging for the services the child needs,” Lopez said in Spanish. “But always, they say she doesn’t need it.”
Her son, Dylan, was eventually able to get an IEP at his elementary school. But Lopez said she’s worried that the services Dylan is receiving are not enough to tackle the challenges his disability poses.
“They give him 10 minutes, and he’s in a group. They ask questions to one; they ask questions to another. It’s really sad how very little they are giving him,” Lopez said in Spanish. “Then, they return him to the classroom.”
A growing need
Lopez said that LAUSD students with disabilities are only able to graduate and stay confident into adulthood if “they’ve really had everything, all the services, all the support.”
Going Deeper
From language barriers to jargon-filled legal language in the IEP application process, families often struggle to get accommodations for their child in the first place, according to Paul Morgan, a social and health equity endowed professor at the University at Albany, SUNY.
Sometimes, Morgan said, schools are not proactive about informing parents about services because they can be costly to offer. And there can be instances where students don’t get an IEP because the findings of a school evaluation don’t match the conclusions of outside providers.
To increase the odds of getting an IEP, Morgan stressed the importance of having objective measurements that can answer these questions:
What kinds of challenges is your child having?
Have these challenges been going on for a period of time?
How are they performing in relationship to their peers?
“I know families that are coming from two parent, two income households [where]both parents are highly educated … and they have great difficulty getting the services,” Morgan said. “I’ve had parents say they have to fight like hell to receive those services from schools.”
Adrian Tamayo, a special education teacher at Lorena Street Elementary School, is one of the LAUSD educators who work day in and day out to support students with special needs.
Tamayo arrives at school at 7:30 a.m. to begin a day packed with regular teaching duties like working with students and planning lessons — as well as unique responsibilities that come with a job in special education, including district and statewide assessments that track students’ progress.
As a special education teacher, he also helps students secure IEPs; he administers standardized tests and carries out observations that are central to that process. This past year alone, he has conducted about 34 IEP assessments, with each taking three to four hours.
“It’s amazing how much time out of our own time we put in outside of the typical school day for the average educator,” Tamayo said.
Tamayo says he and his colleagues feel overworked and understaffed partly because the number of special education hires across the district has fallen — alongside retention, which dropped from 90% to 77% among credentialed teachers in the past three years, according to a district committee presentation.
Meanwhile, special educators who remain are having to support an increasing population of students with disabilities — which has grown from 13.4% to 15.9%, despite LAUSD’s overall enrollment dropping by about 20% in the past decade.
Estrada, the district’s deputy superintendent of instruction, added that since the pandemic, providing speech and language services has been especially difficult due to staffing constraints — but that the district has been able to contract with an outside provider to help fill the void.
“You have so many service providers, and IEPs are happening constantly,” Estrada said. “So, (a) new IEP requires potentially new services, and so we’re constantly adapting and making changes to caseloads.”
Soaring caseloads
This year, Tamayo’s caseload began at 19 students — and increased to 27 by the end of the year. A load higher than 28, he said, would violate California’s education code.
He said having the support of a paraprofessional in the classroom is invaluable — as it allows him to break his class into smaller groups based on grade level. But paraprofessionals aren’t always available.
“I have got to mentally prepare for any unforeseen (circumstances),” Tamayo said, adding that he is “always adjusting as we go.”
Tamayo said he is one of the lucky ones at Lorena Street Elementary; some of the programs have far surpassed their cap of 12 students, with a single professional working with up to 20 students.
He also said the number of psychiatric social workers at his school — supporting students with needs, like Burn’s son — has dropped. A year ago, there was one on campus every school day, he said.
This year, one was available to students three days a week, he said. Next year, he anticipates, they will be available only one day each week.
“That doesn’t mean that children that need that support also decrease,” he said. “You’re basically being asked to do the same job with one day of service.”
Melinda Gonzalez, 14, poses at Fresno High School where she’ll be a freshman in Fresno on Aug. 14, 2024.
Credit: Gary Kazanjian / AP Photo
MEDFORD, Mass. (AP) – Flerentin “Flex” Jean-Baptiste missed so much school he had to repeat his freshman year at Medford High outside Boston. At school, “you do the same thing every day,” said Jean-Baptiste, who was absent 30 days his first year. “That gets very frustrating.”
Then his principal did something nearly unheard of: She let students play organized sports during lunch — if they attended all their classes. In other words, she offered high schoolers recess.
“It gave me something to look forward to,” said Jean-Baptiste, 16. The following year, he cut his absences in half. Schoolwide, the share of students who were chronically absent declined from 35% in March 2023 to 23% in March 2024 — one of the steepest declines among Massachusetts high schools.
Fleretin “Flex” Jean-Baptiste, 16, of Medford, Mass., poses for a photo at Medford High School on Aug. 2, 2024, in Medford, Mass. Jean-Baptiste’s attendance has improved since the school made the gym available to attending students during the school day, in one example of how schools in the state have succeeded in reducing chronic absenteeism. Credit: Josh Reynolds / AP Photo
Years after Covid-19 upended American schooling, nearly every state is still struggling with attendance, according to data collected by The Associated Press and Stanford University economist Thomas Dee.
Roughly 1 in 4 students in the 2022-23 school year remained chronically absent, meaning they missed at least 10% of the school year. That represents about 12 million children in the 42 states and Washington, D.C., where data is available.
Before the pandemic, only 15% of students missed that much school.
Society may have largely moved on from Covid, but schools say they are still battling the effects of pandemic school closures. After as much as a year at home, school for many kids has felt overwhelming, boring or socially stressful. More than ever, kids and parents are deciding it’s OK to stay home, which makes catching up even harder.
In all but one state, Arkansas, absence rates remain higher than they were pre-pandemic. Still, the problem appears to have passed its peak; almost every state saw absenteeism improve at least slightly from 2021-22 to 2022-23.
Schools are working to identify students with slipping attendance, then providing help. They’re working to close communication gaps with parents, who often aren’t aware their child is missing so much school or why it’s problematic.
So far, the solutions that appear to be helping are simple — like postcards to parents that compare a child’s attendance with peers. But to make more progress, experts say, schools must get creative to address their students’ needs.
$50 per week
In California, Oakland Unified’s chronic absenteeism has been skyrocketing from 34.4% pre-pandemic to 61.4% in the 2022-23 school year, excluding charter schools — one of the few districts in the state where rates increased even as schools reopened for in-person instruction. For the last school year, Oakland reported a drop to 31.9%,
editors note
This in-depth report on chronic absenteeism is part of an EdSource partnership with the Associated Press and Stanford Professor Thomas Dee.
One solution has been for the district to ask students what would convince them to come to class.
Money, the students replied, and a mentor.
A grant-funded program launched in spring 2023 paid 45 students $50 weekly for perfect attendance. Students also checked in daily with an assigned adult and completed weekly mental health assessments.
Paying students isn’t a permanent or sustainable fix, said Zaia Vera, Oakland’s head of social-emotional learning.
But many absent students lacked stable housing or were helping to support their families. “The money is the hook that got them in the door,” Vera said.
More than 60% improved their attendance after taking part, Vera said. The program is expected to continue, along with districtwide efforts aimed at creating a sense of belonging.
A caring teacher made a difference for Golden Tachiquin, 18, who graduated from Oakland’s Skyline High School this spring. When she started 10th grade after a remote freshman year, she felt lost and anxious. She realized only later these feelings caused the nausea and dizziness that kept her home sick. She was absent at least 25 days that year.
But she bonded with an Afro-Latina teacher who understood her culturally and made Tachiquin, a straight-A student, feel her poor attendance didn’t define her.
“I didn’t dread going to her class,” Tachiquin said.
Another teacher had the opposite effect. “She would say, ‘Wow, guess who decided to come today?’ ” Tachiquin recalled. “I started skipping her class even more.”
In Massachusetts, Medford High School requires administrators to greet and talk with students each morning, especially those with a history of missing school.
But the lunchtime gym sessions have been the biggest driver of improved attendance, Principal Marta Cabral said. High schoolers need freedom and an opportunity to move their bodies, she said. “They’re here for seven hours a day. They should have a little fun.”
Stubborn circumstances
Chronically absent students are at higher risk of illiteracy and eventually dropping out. They also miss the meals, counseling and socialization provided at school.
At Fresno’s Fort Miller Middle School, where half the students were chronically absent, two reasons kept coming up: dirty laundry and no transportation.
The Central Valley school bought a washer and dryer for students’ use, along with a Chevy Suburban to pick up students who missed the bus. Overall, Fresno’s chronic absenteeism improved to 35% in 2022-23.
Melinda Gonzalez, 14, missed the school bus about once a week and would call for rides in the Suburban.
“I don’t have a car; my parents couldn’t drive me to school,” Gonzalez said. “Getting that ride made a big difference.”
How sick is too sick?
When chronic absence surged to around 50% in Fresno, officials realized they had to remedy pandemic-era mindsets about keeping kids home sick.
“Unless your student has a fever or threw up in the last 24 hours, you are coming to school. That’s what we want,” said Abigail Arii, director of student support services.
Often, said Noreida Perez, who oversees attendance at Fresno Unifed, parents aren’t aware physical symptoms can point to mental health struggles — such as when a child doesn’t feel up to leaving their bedroom.
More than a dozen states now let students take mental health days as excused absences. But staying home can become a vicious cycle, said Hedy Chang, of Attendance Works, which works with schools on absenteeism.
“If you continue to stay home from school, you feel more disengaged,” she said. “You get farther behind.”
In Alaska, 45% of students missed significant school last year. In Amy Lloyd’s high school English classes in Juneau, some families now treat attendance as optional. Last term, several students missed school for extended vacations.
“I don’t really know how to reset the expectation that was crushed when we sat in front of the computer for that year,” Lloyd said.
EdSource contributed to this report.
Becky Bohrer in Juneau, Alaska, contributed to this report.
The Associated Press’ education coverage receives financial support from multiple private foundations. AP is solely responsible for all content. Find AP’s standards for working with philanthropies, a list of supporters and funded coverage areas at AP.org.
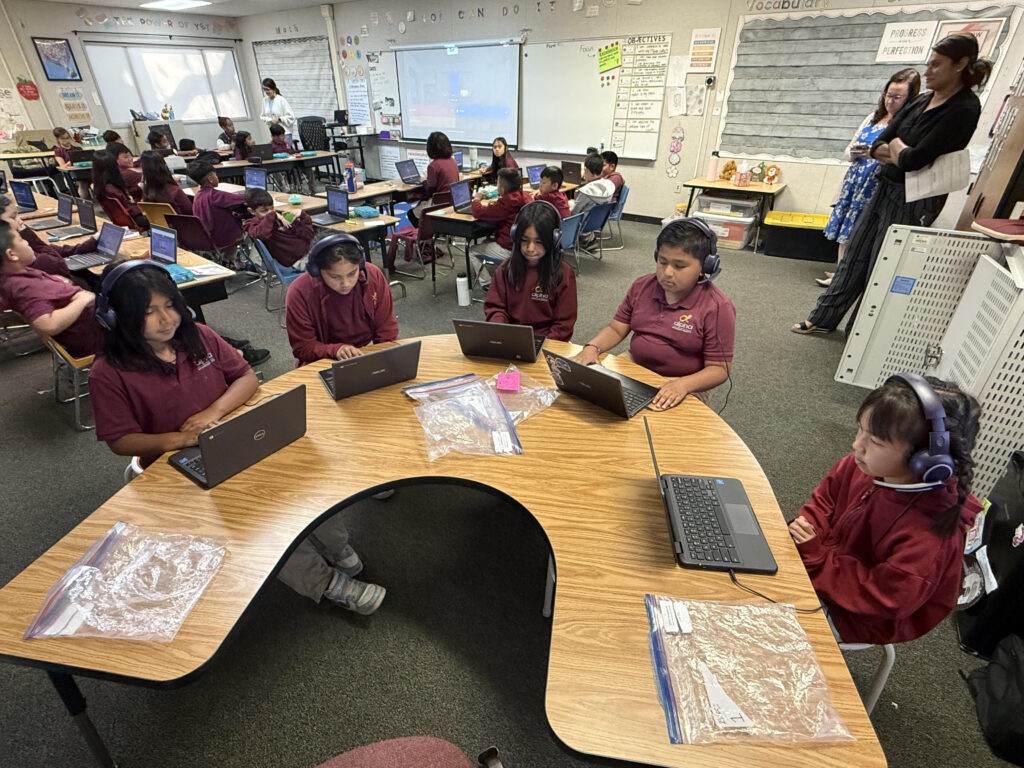
Third graders at Alpha Cornerstone Academy join their individual Ignite Reading tutors for their 15-minute daily session on phonics and other fundamental skills in reading,
John Fensterwald / EdSource
Top Takeaways
Up to 40 districts and charter schools can sign up to design their own high-impact tutoring.
Unless they’ve spent billions already, districts should have funding available.
Both online and in-person high-impact tutoring will work can show impressive results – if done right,
A recent visit to Alpha Cornerstone Academy, a TK-8 charter school in San Jose, offered a glimpse of high-impact tutoring. It was during the intervention period in third grade, a time when teacher specialists work in small groups.
In one corner, five students in their maroon Alpha school shirts sat around a horseshoe table, listening intently through earphones to their own tutor from Ignite Reading, a growing Oakland-based public benefit corporation operating in 20 states. Ignite specializes in tutoring foundational skills – phonics and phonemic awareness. Each lesson was different; some students were repeating words with similar letter sounds. One girl, Sophia, was reading paragraphs to her tutor.
At the start of the year, 103 students were reading from kindergarten and first grade levels, said Fallon Housman, the school’s principal; some were newcomers to the school; others were English learners, fluent in their home language but needing extra time, and others have been identified as having a learning disability.
Now, with the school year coming to a close, all but 20 are reading at third-grade level, Housman said. Sophia is now among them. “I feel like it’s earlier to read,” Sophia said quietly.
“We see a lot of our third graders actually do really well towards the end of third grade because of all of the interventions and supports. We’re excited to have Ignite because it’s an extra push, focusing on foundational skills,” Housman said.
What’s happening at Alpha Cornerstone Academy classroom could be in many California districts. Unlike districts in other states that are scrambling for money to continue tutoring funded with now-expired federal Covid aid, California districts potentially still have multi-billion-dollar state funding for accelerating learning over the next several years.
And having watched tutoring elsewhere from the sidelines for the past four years, the state can avoid other states’ missteps and build programs based on their successes – if California makes tutoring a priority.
“Tutoring isn’t just a tool for learning recovery,” said Jessica Sliwerski, co-founder and CEO of Ignite Reading. ”It’s serving as an essential classroom support that students need to build strong literacy skills.”
A second or “Western” wave of tutoring
“Lots of other states have helped push tutoring along more than California has. I’m really optimistic that in some ways, it [California] can be a leader, because we’ve learned so much that they could really do it more effectively immediately than we could right at the beginning,” said Susanna Loeb, a professor at the Graduate School of Education as well as the founder and executive director of the National Student Support Accelerator.
Loeb sees an opportunity for California to jumpstart the state’s laggard performance on state and national achievement assessments, especially in early literacy, by creating a second or “Western” wave of tutoring.
In four years, the National Student Support Accelerator has become the foremost source of information on and coordinator of research into online and in-person “intensive, relationship-based, individualized instruction” called by various names, high-dosage, high-impact, or high-intensity tutoring.
This week, three state agencies – the California Department of Education, the State Board, and the California Collaborative for Educational Excellence – will make the first joint effort in promoting it. They will join the nonprofit Results for America, and Loeb’s organization in sponsoring a webinar explaining high-impact tutoring.
The May 13 event serves as an invitation for up to 40 school districts to design their own high-impact tutoring programs that could serve as a model for other district cohorts.
It isn’t clear what happens after the event, but tutoring providers are hoping the state will get more involved.
“This is the first time that the state has recognized high-impact tutoring as desirable. We know what the research has found; we know the formula for making tutoring work,” said Chris Norwood, founder of Bay Area Tutoring Association, which works with school districts on creating effective programs. “Now we have to get the word out through channels of information that districts use, like county offices of education.”
An exciting prospect, hard to do
Many parents, teachers, policy makers and student equity advocates looked at tutoring as a recovery strategy coming out of Covid.
“What was not so clear was whether they could actually pull it off at any kind of scale,” said Loeb who acknowledges it’s easier for smaller states with a less complex system of governance to say, “Here’s the guidance on how to do high-impact tutoring; here are some funds to do it, and here are professional support.”
The federal Institute of Education Services identified “high-quality” tutoring as one of several effective strategies for schools. An analysis of 96 rigorous studies comparing results of students who had high-impact tutoring with those who hadn’t found significant improvement in 87% of the programs, equivalent to a half-year growth in many cases. The strongest gains were in early grades in literacy and when it was given during, rather than after, school.
Based on research, the National Student Support Accelerator says that effective, high-impact tutoring programs have these elements in common:
A high-dosage delivery of three or more sessions per week of required tutoring, each 15 to 30 minutes.
An explicit focus on cultivating tutor-student relationships, with tutors assigned with the same students throughout. Consistency is critical to building a solid relationship, and the tutor should be “someone who is engaging and motivating,” Loeb said.
Alignment with the school curriculum.
Formalized tutor training and support.
The use of formative assessments to monitor student learning.
There are different models for districts: training paraprofessionals as full-time tutors, hiring outside tutoring organizations for in-person tutoring, or turning to online nonprofits; the latter lack the face-to-face connection but can better scale up to serve more students, she said.
But many California districts found that creating a system with all of the elements was hard to pull off, and outside of urban areas and university towns, many had difficulty finding organizations and trained tutors for in-person instruction. Districts lacked experience evaluating tutoring outfits’ promises and measuring results. Communication over student results could be erratic; arranging schedules could be a challenge.
Given other, more familiar options, many overstretched California districts and schools made tutoring a low priority; they invested instead in hiring teacher aides and counselors.
An examination by Edunomics Lab, a Georgetown University-based education research nonprofit, found that 70% of California’s public school districts, charter schools and county offices of education didn’t report spending any money on tutoring from the last and biggest outlay of federal learning loss funding for California – ESSER III. Of the 30% of districts that did, spending on tutoring totaled 1.5% – $190 million out of $13.5 billion. (Go here for an interactive graphic on California districts’ tutoring spending.)
Meanwhile, other states became directly involved in high-impact tutoring. According to the National Student Support Accelerator’s 2024-25 summary of states’ activities, two dozen states allocated specific funds for high-impact tutoring, while others provided technical help to set up programs. One state, Tennessee, is funding tutoring through its annual school funding formula.
Nine states have ongoing partnerships between higher education institutions and tutoring organizations.
Norwood is partnering with San Jose State to hire students on an education track to serve as tutors in the schools while earning federal work-study money. If all teacher preparation programs credited time tutoring toward fulfilling time required in the classroom, California could add thousands of tutors to the ranks.
Money to spend
California had the advantage of surging state revenues from a post-pandemic economic boom to set aside more than $10 billion in one-time and ongoing money for schools in 2021-22 and 2022-23.
The state lists tutoring as one of the evidence-based options that districts can choose for their unspent share of the $6 billion Learning Recovery Emergency Block Grant; they have through 2027-28 to use it. It’s not clear how much remains; districts filed the first spending report in late 2024.
The advent of universal transitional kindergarten next fall and rollout of a new math framework are touchpoints for high-impact tutoring, Loeb said.
“If I had to think about where California could embed tutoring just as part of normal operations, it would be in early literacy,” she said. “It is a shame and a detriment to the state that so many students are not learning how to read before third grade. There’s lots of evidence that high-impact tutoring can help get us there.”
The selection of new materials aligned with the math framework will lead districts to rethink how math is taught.
“That’s a really good time to say, ‘OK, within this structure, how do we get students who aren’t making progress at the rate of the class or rate the state expects to get that individual attention so that they can accelerate their learning and excel in school?’ We’re not really doing that, so students are kind of falling off as we move quickly through the curriculum.”
This story was updated at 4:25 pm with more details on the assessment results.
California students made some progress toward regaining their pre-Covid levels of achievement with incremental increases in English language arts, math and science scores last school year, according to state data released Wednesday.
English language arts test scores overall increased slightly, from 46.7% of the state’s students meeting or exceeding proficiency standards in 2023 to 47% in 2024. Math and science scores also edged up incrementally, with 30.7% of students in both subjects meeting or exceeding proficiency standards compared with 30.2% the year before.
Smarter Balanced tests are given to students in third through eighth grades and in 11th grade. They are part of the California Assessment of Student Performance and Progress (CAASPP), which also includes the English Language Proficiency Assessment.
Last school year was the third year students returned to school since the Covid pandemic pushed schools into distance learning and caused dramatic declines in test scores after years of progress. In 2019, more than half of California students, 51.7%, met or exceeded state standards in English language arts, and 37.1% met or exceeded state standards in math.
Linda Darling-Hammond, president of the State Board of Education and an adviser to Gov. Gavin Newsom, said she found reason for encouragement in the scores. She said that the overall gains were consistent across grades and for Latino and Black students.
“California’s public schools are making encouraging gains in all of the key subject areas, and these gains are largest for our most vulnerable groups of students,” Darling-Hammond said in a statement. “Our governor and the Legislature have, in recent years, prioritized … accelerating learning and equity: community schools, expanded learning time, transitional kindergarten, and investments in literacy and math. Those efforts are paying dividends.”
Students from low-income households made larger gains in all three subjects on the tests than students overall — a change from initially after the pandemic. Low-income students’ scores in English language arts increased 1.5 percentage points over the previous year, with 36.8% meeting or exceeding proficiency standards in English. There was a similar increase in both math and science, with 20.7% meeting or exceeding standards — a 1.4 percentage point increase in each.
Darling-Hammond attributes the academic improvement to billions of dollars in federal and state assistance directed to students with the most needs. She acknowledged it’s not possible to tease out the impact of the state’s expanded after-school learning program relative to money spent on community schools or literacy coaches. But it’s apparent that the combined money is making a difference; for families experiencing evictions and illnesses in high-poverty neighborhoods, the pandemic isn’t over, she said.
“My heart goes out to those in the schools that deal daily with these issues,” Darling-Hammond said.
This narrowing of the performance gaps occurred even though the proportion of low-income students in California has grown significantly in the last seven years, from 58% to 65%, Darling-Hammond said. And the numbers of homeless and foster children are up too, she said.
After looking at the same state data, however, the nonprofit advocacy group Children Now expressed alarm. “California’s lack of progress in closing the education achievement gap over the past 10 years is completely unacceptable,” it said in a statement. “We have made almost no progress for our Black and Latino students, who make up more than 60% of California’s TK-12 student population, since the start of the Local Control Funding Formula and associated accountability system a decade ago.”
Additional protections are needed, Children Now stated, “to ensure the equity-focused funding that is the hallmark (of the funding formula) goes to the schools and students most in need to close our state’s unconscionable achievement gap.”
Racial/demographic breakdown of test scores from 2015 – 2024
English and math scores for students in all California schools and districts showing gaps in proficiency.
California school districts have received record levels of one-time and ongoing funding since the start of the Covid pandemic. But the last $12.5 billion in federal pandemic relief — 20% of which was required to be spent on learning recovery — had to be spent by last month.
California schools are getting creative to continue to fund positions and other support once funded by Covid dollars, said Alex Traverso, spokesperson for the California State Board of Education. Some schools in San Diego County, for example, are funding counselors and social worker positions, once paid for with federal Covid dollars, with the community schools dollars.
“So I think as much as we can, we are trying to find strategies and techniques that can keep these programs moving forward and keep student achievement on the rise,” Traverso said.
The gap in proficiency between disadvantaged and non-disadvantaged students remains daunting in 2023-24: 29.3 percentage points in English language arts and 30.2 percentage points in math — about 1 percentage point smaller than in 2022-23.
States’ scores flat after dropping
An analysis of third-grade reading by David Scarlett Wakelyn, a partner with Upswing Labs, a nonprofit that works with school districts to improve reading instruction, found that California’s scores were similar to 29 other states he has examined: flat after falling sharply after the pandemic.
Third grade is a benchmark year for achieving fluency. In 2018-19, the last year before the pandemic, 48.5% of California students were proficient or advanced; in 2023-24, 42.8% were, a drop of 5.7 percentage points. In the past three years, reading scores rose less than 1 percentage point.
Other states that take the Smarter Balanced assessments followed the same pattern, including Oregon, Nevada and Delaware, whose scores were below California before the pandemic and were again in 2023-24. Washington State, where 55% of students were proficient in 2018-19, fell to 47% and has stayed there the past three years.
None of the nation’s 10 largest states have bounced back to where they were before the pandemic, Wakelyn found. But in four “bright spot” states — Mississippi, West Virginia, Louisiana and South Carolina — reading scores increased by 3 to 5 percentage points each of the past three years and are now ahead of where they were before the pandemic. The state leadership in Louisiana, he said, has long focused on adopting high-quality instructional materials and giving teachers deep professional learning opportunities in the new curricula, he said.
Smarter Balanced test results divide student scores into four achievement levels, but this year the names of the levels have changed. Instead of “not meeting standards,” “standards nearly met,” “standards met” or “standards exceeded,” they are now “advanced,” “proficient,” “foundational” or “inconsistent.”
English learners have mixed results
Fewer English learners tested as proficient on the summative English Language Proficiency Assessment for California (ELPAC) than last year. The percentage of English learners who tested as proficient went down from 16.5% in 2023 to 14.6% in 2024, while the percentage of English learners who had the most basic level of English increased from 20.33% to 23.93%.
Students classified as English learners have to take the summative ELPAC every year until they achieve proficiency. There are four levels of proficiency — “beginning to develop,” “somewhat developed,” “moderately developed,” and “well developed.”
Shelly Spiegel-Coleman, strategic adviser to the Californians Together, a nonprofit organization that advocates for English learners, said it is difficult to know what these numbers mean, because they could be due to a change in the demographics of English learners. For example, the increase in the percentage of students with the most basic level of English could be due to an increase in students who recently arrived in the U.S., she said. In addition, there is no information about how many students are reclassified as proficient in English.
However, she said, “it would suggest that districts take a look at their English language development program and see if there is a need for intentional work to enhance it.”
Los Angeles, Compton see gains
The number of students in Los Angeles Unified (LAUSD) who met or exceeded state proficiency standards in both English language arts and math increased by about 2 points since 2023. Now, 43% of students meet or exceed standards in English language arts and 32.83% of students meet or exceed standards in math.
School board member Kelly Gonez said the district is committed to continuous improvement and equity.
“Every day, we’re showing up for our students, and it’s showing results,” Gonez said at a news conference in July, when the district announced preliminary scores. “I believe that we’re at the tipping point of really achieving the ambitious goals that we have for our students in our school district.”
Nearby Compton Unified also saw improved test scores last school year. Roughly 43% of students met or exceeded proficiency standards in English language arts this year, compared with about 40% the previous year. The number of students who met or exceeded math standards also rose, from just over 31% to nearly 35% this year.
“Compton Unified School District has shown steady and remarkable progress in both math and English language arts, with our CAASPP scores far exceeding the state average for school districts with an unduplicated pupil count exceeding 90%,” Compton Unified School District Superintendent Darin Brawley said in a statement to EdSource.
Benecia’s 8 point gain in math scores, to 53% proficiency, was led by two years of growth by Hispanic students. At 40.7% proficiency, they are the first student group in the district to exceed its pre-pandemic 2018-19 rate. Superintendent Damon Wright credited the funding of districtwide professional learning and instructional coaches as factors.
Fallbrook’s one-year 5.2 point gain in English language arts and 5.9 pont gain in math bring the district almost back to pre-pandemic levels. Superintendent Monika Hazel also credits additional district-level math teaching specialists, leadership coaches and school-level instructional coaches for contributing to the improvement. The state’s $6 billion Learning Recovery Emergency Block Grant, which will continue after federal Covid relief runs dry this fall, paid for some of the positions.
Bay Area schools’ results vary
In the Bay Area, some districts had big test score gains, while others stayed stagnant. Benicia Unified had a 4-point gain in its overall English test score, and an 8-point gain in math. San Francisco and Oakland test scores were mostly stagnant.
West Contra Costa Unified is laboring to bring its scores back to pre-pandemic levels. Since the 2021-22 school year, slightly more West Contra Costa students have tested proficient or higher in math — up 2 points to 23% this year. Students who meet or exceed state proficiency standards in English language arts have been flat since 2021 at 32%, compared with 34.9% pre-pandemic.
To help improve reading scores, the district created a 13-member literacy task force about a year ago to create a literacy plan and improve literacy instruction in the district. District officials did not respond to requests for an update on the task force’s progress.
Big gains for Central Valley migrant students
Tulare Joint Union High School District in the Central Valley region had data points worth celebrating and data pointing to areas that need improvement, said Kevin Covert, assistant superintendent for curriculum, technology and assessment of the test results.
Based on the 2024 tests, 53.5% of the 1,300 11th graders who took the exam met or exceeded English proficiency standards, a 2.2 point gain from the previous year. In math, 18.3% of students met or exceeded standards — an improvement of less than 1 point.
“Some people want to hang their hat on an overall test score,” Covert said. “We’re also looking at how our subgroups are doing.”
The percentage of Tulare Joint Union students with disabilities meeting or exceeding standards was 12.7% in English, a jump of more than 5 points, and 3.5% in math, an improvement of more than 2 points. Though scores have fluctuated for students with disabilities, the 5.5-point gain in English is the largest percentage growth the group has made within the last decade.
Though migrant students are a small population of the district’s students, 63.6% met or exceeded English standards, representing a double-digit gain. Only 18.2% met or exceeded math standards, although the increase of 1.5% was higher than the overall district increase.
“Our success on this test can only be as good, partly, as the instruction that’s going on in the classroom,” Covert said. But educators must also know where students are academically, which is harder to track in Tulare Joint Union.
Fresno Unified, the state’s third-largest district, is struggling to return to pre-pandemic levels of achievement of 38% proficiency and above in English language arts and 29% proficiency and advanced in math. Superintendent Misty Her expressed confidence in the districtwide strategy known as “data chats.” At Data Chats, principals and staff evaluate data and set goals, including the need for intervention, for students to progress.
But what about the teachers who are joining the profession? What motivates Gen Z students to go into teaching today, when it’s seemingly less lucrative and less attractive than ever?
One reason students like Katherine Osajima Pope — a recent University of California Santa Cruz graduate who is earning her master’s degree and teaching credential at Stanford University — decide to become teachers is to effect change. Osajima Pope wants to have a positive impact on her students, and, by extension, her community, “even if that’s one person at a time, or oneclassroom at a time.”
Chloe Decker, a rising senior at UC Berkeley, has noticed an increase in students who approach teaching from an advocacy perspective. As a peer adviser in UC Berkeley’s CalTeach program, through which undergraduates can gain teaching experience and even get their credentials, Decker regularly meets with students considering the teaching profession.
“I have seen so many inspired students excited for student advocacy. They want to change people’s lives, they want to be there for the kids, they want to be one person of influence that can change minds as to how they view education,” Decker said.
CalTeach and other undergraduate and graduate credential programs place a heavy emphasis on the role of teaching in equity and social justice. One of the required courses for CalTeach’s program focuses on equity in urban schools, and the program lists increasing “access, equity, and inclusion for STEM learning” as one of its core principles. Osajima Pope said she was “pleasantly surprised” by Stanford’s commitment to educating its students on anti-racism and equity.
Decker, who aims to become a teacher and then a school social worker, said she has seen a change in “what school actually means.” Beyond “just emphasizing academic requirements,” schools now see themselves as a support and social system for kids — and Decker and many of her peers are excited to engage in this aspect of the job.
“It’s just deeper than having them learn what one plus one is,” she said.
Excited by the idea that educators can do more than teach facts and figures, many future teachers plan to bring their own educational experiences into the classroom, while parting ways with some aspects of traditional pedagogy.
Osajima Pope has been working with children for years, volunteering at schools and libraries since she was a child. She called her educational experience growing up in Oakland “transformative,” and said she wants to go back as an ethnic studies teacher to “teach to the same person that (she) was.”
Susana Espinoza said her high school Spanish teacher exposed her to the world of Chicano/Latino studies, and she wants to similarly broaden students’ horizons. Espinoza, who is currently studying at UC Berkeley, remembers that Spanish class as the first time she saw herself reflected in the classroom, or in “any type of story that was told.”
Espinoza hopes to be “that one steppingstone” that allows students to achieve their dreams, as her teacher did for her.
While equity and access to education are powerful motivators, some future teachers are just as excited by the potential of a job that allows for creative expression and deep interpersonal connections. For Lindsay Gonor, a recent Cal Poly, San Luis Obispo graduate who is now earning a teaching credential there, it was working at a theater camp through her teen years that led her to education. Gonor said the experience contrasted with what she heard from her parents about their jobs, and specifically her father, who was a lawyer.
“I would ask (my dad) how work was, and he’d be like, ‘They don’t call it going to fun.’ And I was like, well, that’s not what I want to do. I work at the theater camp, and work is fun,” Gonor said.
These Gen Z-ers are not ignorant of the challenges that come with teaching. Decker said that each time CalTeach hosts a teacher panel, at least one speaker discourages the students from joining the profession — citing the common problems of low pay and long hours.
Gonor even acknowledged that her credential program is not a good “bang for your buck.” However, Gonor said, “The people that want to be teachers want to be teachers.”
Osajima Pope said she’s confronted with the realities of the job practically every time she tells someone her intended field, and she’s met with resistance. But for her, a part of the desire to teach is intrinsic, and possibly inexplicable.
“For me, my job isn’t about the money I make, it’s about what I feel passionate about,” Osajima Pope said. “It’s definitely hard to explain choosing happiness over money just because those two are equated so frequently, but I guess it was just (that) there’s literally nothing else I could see myself doing. Like, absolutely nothing else.”
Clara Brownstein is a third-year student studying English, Spanish and journalism at UC Berkeley, and a member of EdSource’s California Student Journalism Corps.