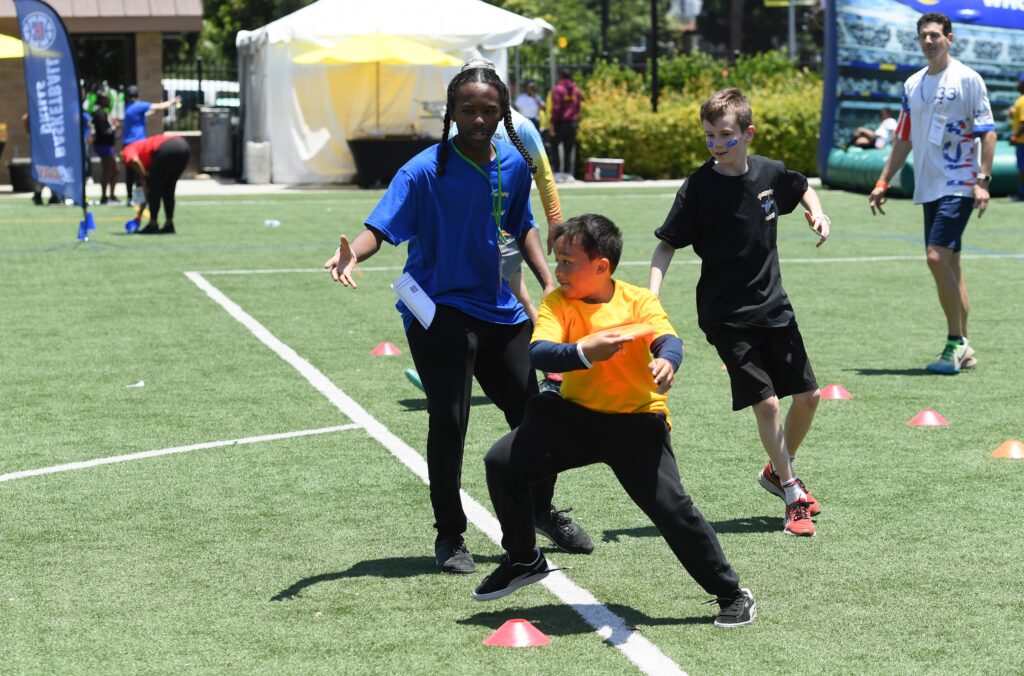

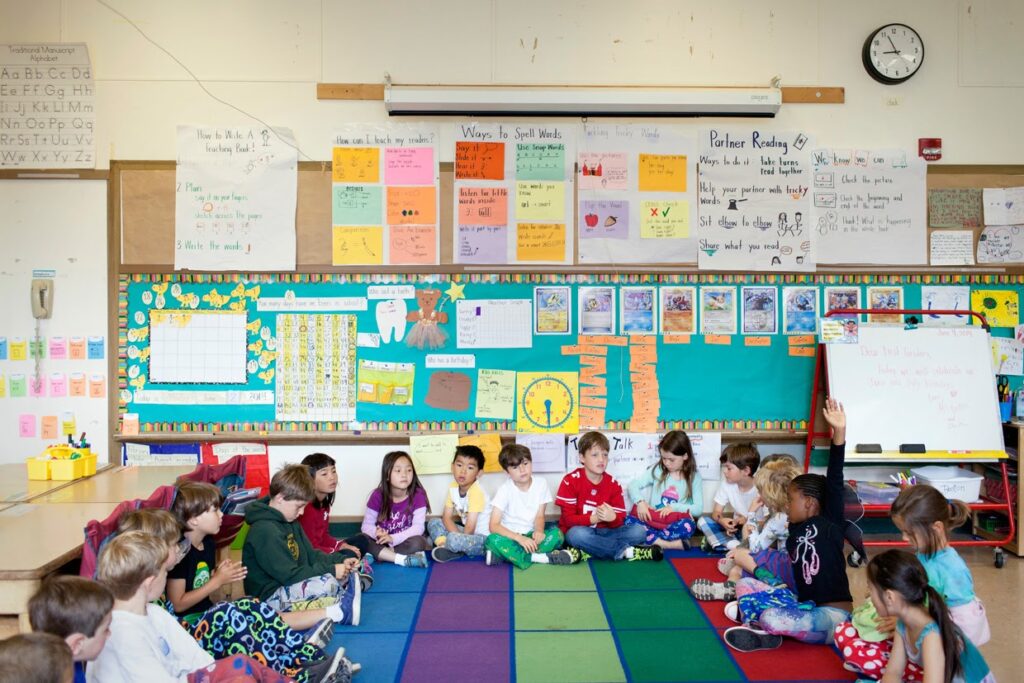
Kids get a chance to stretch their legs and skills during physical exercise in Los Angeles in 2023.
Courtesy LA84 Foundation
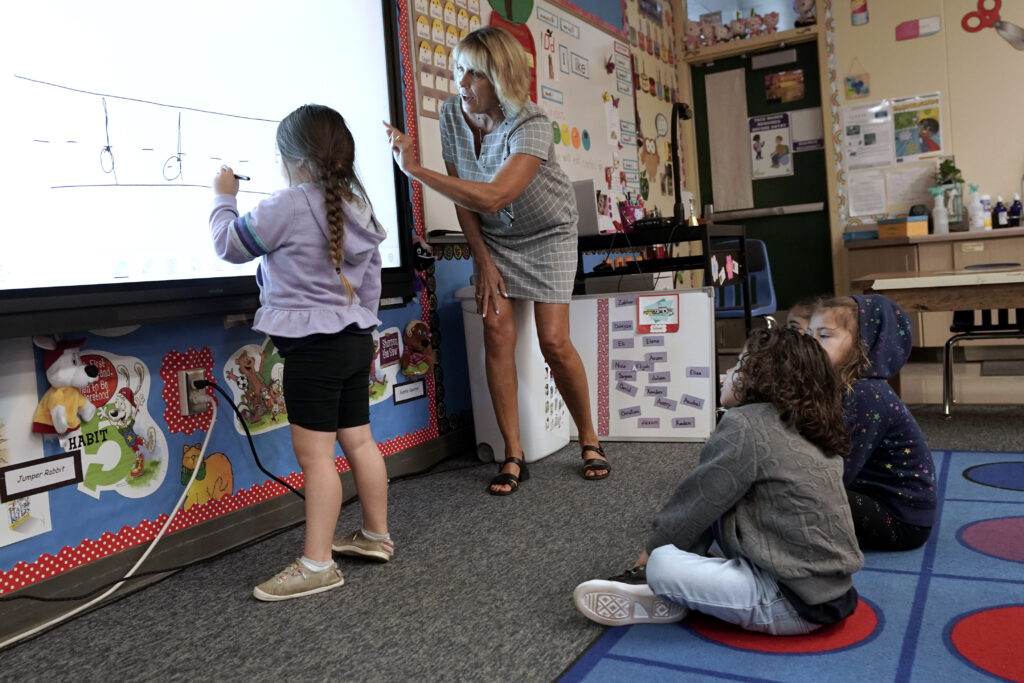
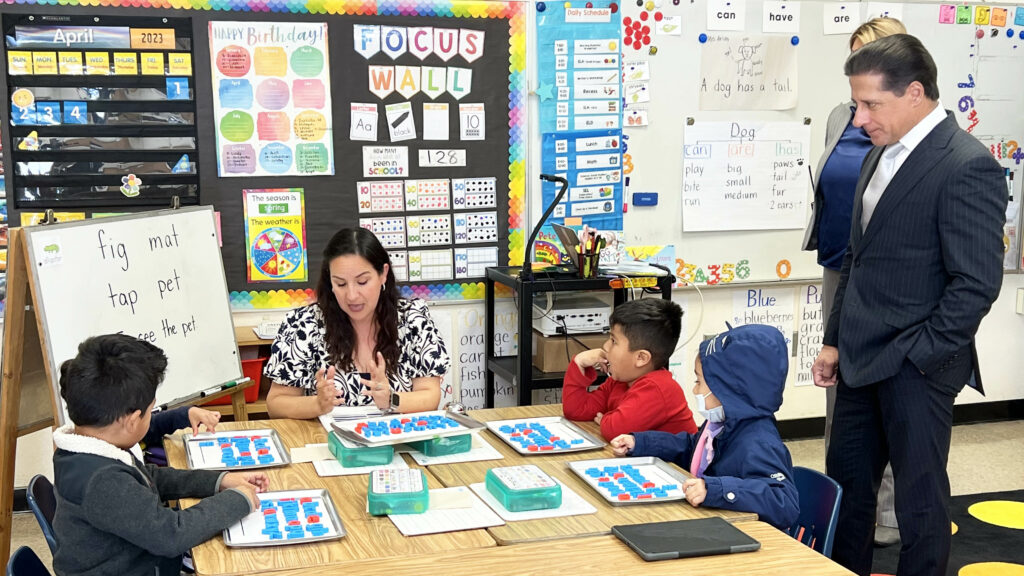
Millions of young people across the nation have returned to school, yet students are still struggling to navigate the return to normal. Research shows us that educators and policymakers can bring back joy in schools by prioritizing sport and play to build a supportive learning environment. One where we all win.
The role of sports and play extends far beyond physical fitness. It profoundly impacts student social and emotional health and school connectedness. By instilling valuable life skills, fostering social bonds and promoting emotional well-being, sport and play contribute to a holistic educational experience that nurtures well-rounded individuals capable of transcending life’s challenges and thriving in diverse circumstances.
With parents, educators and administrators now back in school, let’s not forget the Covid-19 pandemic ushered in a new set of challenges for youth, leading to a mental health crisis as declared by the U.S. Surgeon General in late 2021.
While issues concerning the mental health of our kids had arisen long before the pandemic, nearly three years of isolation and increased screen time, death and uncertainty only magnified students’ stress, anxiety and depression. We warned this was a mounting mental health emergency in schools last year, but today it is in clearer focus. Results released in February from the Centers for Disease Control and Prevention’s Youth Risk Behavior Survey indicated startling trends. Nearly 3 in 5 teen girls (57%) said they felt “persistently sad or hopeless.” More than 40% of boys and girls responded they had felt so sad or hopeless within the past year they were unable to perform regular activities.
According to a 2022 State of Youth Mental Health report which surveyed 2,000 parents, 68% have seen their children face significant mental and emotional challenges. Yet, recent studies have also found 60% of youth with major depression do not receive mental health treatment, many of them youth of color.
These findings require us to not rush into school with a singular focus on closing the learning loss. Let’s instead look to accelerate opportunities through sport and play to help our kids reconnect to themselves, to their friends and to their schoolwork.
Sport and play hold a profound significance in fostering social and emotional well-being and enhancing school connectedness for students. Beyond mere physical activity, engagement in sport and play cultivates essential life skills and nurtures interpersonal relationships.
Policymakers across the country have recognized the value of sport and play in schools and are advancing this framework. California state Sen. Josh Newman authored Daily Recess for All, Senate Bill 291, which ensures students have access to a 30-minute recess for unstructured play and that it cannot be withheld as a form of punishment.
The joy and spontaneity inherent in play promote emotional release and stress reduction. Engaging in recreational activities allows students to unwind, alleviate anxiety and recharge their mental faculties. This, in turn, equips them to navigate academic pressures and personal trials more effectively. One study found that 6-to-8-year-olds who exercised frequently had fewer symptoms of major depressive disorders two years later.
This same study found 73% of parents believe that sport benefits their child’s mental health. Participating in sports teaches invaluable lessons in teamwork, communication and perseverance. Through wins and losses, individuals learn to handle success and setbacks, building resilience and boosting self-esteem. These experiences translate into the ability to cope with challenges outside the sports arena, contributing to a balanced social and emotional state.
Sports and play serve as powerful catalysts for building social bonds. Students develop a sense of camaraderie and shared purpose in collaborative activities, breaking down barriers and forming connections that transcend differences. This inclusivity enhances the feeling of belonging, which is vital for a positive school environment.
In a world increasingly driven by digital interactions, the physicality of sports and play offers a refreshing counterbalance. Face-to-face interactions during games and playtime nurture emotional intelligence and empathy, enriching interpersonal skills that are essential for healthy relationships in school — and later in life.
Although it’s never been more needed in the educational environment, many public schools have defunded sports programs and offer physical education far less than they once did. That reinforces the pay-to-play model and leaves out the kids who have the least.
Our data shows that as household income increases in LA County, so does activity levels for the children in the home. Children from homes with income under $35,000 a year play far less than kids from affluent households, and they are unable to access the resources they need to be active.
These children are our future engineers, musicians, teachers, caregivers and leaders. Talent is universal, but opportunity is not. We can mend the kids’ lives who are suffering by providing access to the transformative power of sport and play, and help change a significant number of their destinies.
•••
Renata Simril is president & CEO of the LA84 Foundation, the legacy of the 1984 Summer Olympics in Los Angeles, and a national leader advocating for the role of sport and play in positive youth development.
The opinions expressed in this commentary represent those of the author. EdSource welcomes commentaries representing diverse points of view. If you would like to submit a commentary, please review our guidelines and contact us.


)
)