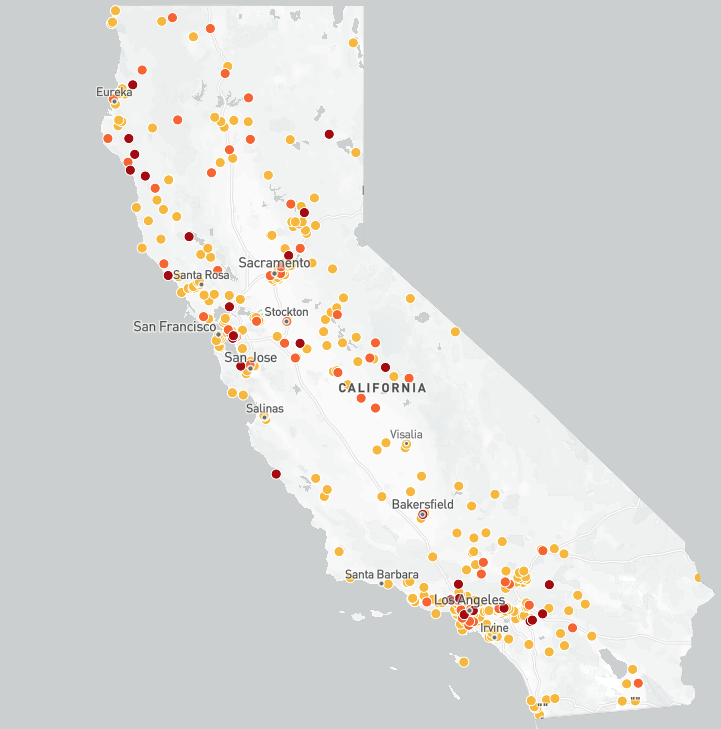
This map only includes schools that had 10% or more kindergartners not fully vaccinated.
Note: Unvaccinated includes students with overdue vaccinations and those in the process of getting vaccines. Numbers do not include special education students and those with medical exemptions.
NA: Accurate information was not immediately available from CDE.
More than 500 California public schools are being audited by the state because they reported that more than 10% of their kindergarten or seventh-grade students were not fully vaccinated last school year. Schools that allow students to attend school without all their vaccinations are in jeopardy of losing funding.
The audit list, released by the California Department of Public Health, includes 450 schools serving kindergarten students and 176 schools serving seventh graders with low vaccination rates. Fifty-six of the schools serve both grade levels. Another 39 schools failed to file a vaccination report with the state.
“Schools found to have improperly admitted students who have (not) met immunization requirements may be subject to loss of average daily attendance payments for those children,” the California Department of Public Health said in an email.
Students who are overdue for their vaccinations or who have been admitted to schools conditionally while they catch up on vaccines are not fully vaccinated, according to the state. Students who are in special education or have a medical exemption are not required to be vaccinated.
California law requires school staff to report vaccination rates to the state each fall and to check up on those catching up on vaccinations while attending school at least every 30 days. If the student who is catching up on their vaccines does not have a second dose of a vaccine within four months of the first dose, they must be excluded from school, according to a state audit guide.
“After the personal belief exemption was gone, we found a significant number of schools were behind on their reporting and were allowing a lot of conditional admissions and weren’t following up,” said Catherine Flores Martin, director of the California Immunization Coalition.
More than 30 Oakland Unified schools make audit list
More than half of Oakland Unified’s 48 elementary schools and eight of its schools serving seventh graders are on the audit list for 2022-23. This includes Markham Elementary where 65% of the 66 kindergarten students were not fully vaccinated last school year. The school had the highest percentage of kindergartners in California’s traditional public schools — with over 20 students — who were not fully vaccinated.
Of the 27 Oakland Unified elementary schools on the list, more than 20% of kindergarten students in a dozen schools did not have all the required vaccinations last school year.
Oakland Unified district spokesperson John Sasaki did not comment on the audit list for last school year by publication time. Previously he told EdSource that lower vaccination rates at some schools in 2021-22 were due, in part, to the difficulty families had getting medical appointments during the pandemic, and a district backlog logging vaccinations.
The Bay Area district isn’t the only large school district struggling to get students fully vaccinated, according to state data. Los Angeles Unified has 75 of its non-charter schools on the audit list, while Pomona Unified has 13, San Francisco Unified 14 and San Juan Unified in Sacramento County eight.
Pandemic still affecting school vaccination rates
The state’s vaccination rate, which had grown steadily since the state eliminated personal belief exemptions in 2015, plunged in the months after the Covid-19 pandemic closed schools. Thousands of California students were unable to start the school year in 2022 because they did not have their immunizations.
The state did not relax vaccination requirements during school closures, but not all school officials cooperated with the requirements, Martin said. She isn’t sure that has changed.
“Some schools may be out of practice and, in some areas, their leadership has changed and it isn’t a priority,” she said.
The state’s kindergarten vaccination rate was 92.8% in 2020, down from 95% in 2018. But districts sent information about vaccinations home and held vaccination clinics and made up some ground. In 2021 the vaccination rate rose to 94%.
A vaccination audit has been part of the state’s annual financial and compliance audit of public schools since the 2021-22 school year, according to the California Department of Public Health. That year the vaccination audit found that 45 school districts did not meet state vaccination requirements. Seventeen were further reviewed for potentially allowing students to attend school unvaccinated, said Scott Roark, spokesperson for the California Department of Education.
Schools in violation of the state law must submit corrected attendance reports that reflect the reduction in average daily attendance cited in the audit finding, which will likely reduce their funding, Roark said.
Parents opposed to vaccines are often drawn to charter schools
Parents against vaccinations found few options for their children as California laws became increasingly more restrictive. Some decided to home-school their children or sought independent study or virtual learning options, mostly provided by charter schools. Students who learn from home without any in-person instruction or school-related activities are not required to be vaccinated.
About 90% of the state’s 1,300 charter schools offer in-person instruction to students, according to the California Charter School Association; 67 of those are on the 2022-23 audit list.
Of all California schools, Agnes J. Johnson Charter School in Humboldt County had the highest percentage of kindergartners who were not fully vaccinated last school year. Ninety percent of the 11 kindergartners still needed at least one vaccine. Mountain Home Charter in Oakhurst had the second-highest percentage of kindergartners — 83% — who were not fully vaccinated, followed by Gorman Learning Center – 76% – serving 140 kindergarten students in the San Bernardino and Santa Clarita areas.
Gateway Community Charters has been trying to improve vaccination rates at Community Outreach Academy by working with a nearby health care provider to offer immunization clinics for the students, and to ensure there is a nurse on-site daily. Despite that, almost a third of the 219 kindergartners who attended Community Outreach were reported as being behind on their vaccinations last fall.
Vaccination rates at the school, which have been low for years, began improving before the pandemic but decreased after schools closed and have remained low, said Jason Sample, superintendent of Gateway Community Charters, which operates the school.
Community Outreach Academy offers in-person instruction in buildings on a former Air Force base in Sacramento County. The school primarily serves the Slavic community, whose members are often suspicious of the government and vaccines, Sample said. Its enrollment ballooned to 1,200 students in recent years as refugees from Ukraine, Russia and Afghanistan moved to the Sacramento area.
Community Outreach Academy isn’t the only school in the Gateway Community Charter system on the audit list. Community Collaborative School, which offers both in-person and online instruction, had 39% of its kindergartners and 14% of its 42 seventh-grade students not fully vaccinated last fall. Two other schools run by the charter system — Empowering Possibilities International Charter School and Gateway International School — each had more than 28% of their students without all their vaccinations last school year, according to the audit report.
Empowering Possibilities International Charter lost average daily attendance funding for two students for three months of last school year after its audit was completed, Sample said.
Students who do not have all the required vaccinations are given information about the state vaccination guidelines to take home, Sample said. A health services team then reaches out to the family to connect them with vaccination resources. Students who still don’t provide proof of vaccination are excluded from school, he said. The charter system has a non-classroom-based virtual academy as an alternative until students are up-to-date on their vaccinations.
Vaccine hesitancy has hurt vaccination rates
Vaccine hesitancy has helped to reduce vaccination rates across the country and sparked outbreaks of infectious diseases, including measles outbreaks in Disneyland in 2015 and another Ohio in 2018. Last year, 121 cases of measles were reported, up from 49 cases in 2021, according to the Centers for Disease Control and Prevention.
A UNICEF report released in April shows that 67 million of the world’s children missed out on one or more vaccinations between 2019 and 2021 because of strained health systems, scarce resources, conflict and decreased confidence in immunizations. The report says that while overall support for vaccines remains strong, vaccine hesitancy seems to be growing.
Vaccine hesitancy stems from growing access to misleading information, declining trust in expertise, uncertainty about the response to the Covid-19 pandemic and political polarization, according to the report.
Bernardo Lafuente said he isn’t worried his son, Gavril, will be infected by measles or other childhood diseases. He doesn’t trust reports about outbreaks.
“I don’t believe what they are saying. I don’t believe it,” he said. “We don’t see an epidemic. I haven’t seen anyone with measles or smallpox; they are virtually nonexistent in America.”
Lafuente and his family left California in 2018, in part, because of its vaccination requirements and moved to Nevada where vaccines are not required to attend school.
“The government in Nevada pushes vaccination of not just kids, but everybody, but in Nevada we have a choice,” Lafuente said.
Gavril, now in fifth-grade, had some vaccinations when he was younger. His father set up a schedule he devised, instead of the vaccine schedule endorsed by the CDC. But he doesn’t intend for his son to get any more.
“He’s vaccinated except for boosters,” Lafuente said. “I’m not against vaccines if someone else wants to get them. I’m personally against vaccines. I don’t think everybody should have to get a vaccine, unless there is an outbreak, but even then, it should be a choice.”
Pockets of unvaccinated students dot most districts
Even districts with high overall vaccination rates often have schools that have vaccination rates low enough to land on the audit list. In 2021, the last year overall student vaccination rates were available, 95% of Sacramento City Unified students were fully vaccinated. Yet last school year, it had eight schools on the audit list.
“We encourage everyone to get vaccinated,” said Susan Sivils, lead nurse for the Sacramento City Unified vaccination clinic. “If they are opposed for any reason, we follow up. The vast majority of people are not opposed to getting their vaccinations.”
The district is working to increase its vaccination rates with weekly free vaccination clinics throughout the year and two weeks of clinics before the beginning of the school year. In an effort to get more students vaccinated, the district increased the number of vaccination clinics last year and called parents directly to make them aware of the vaccination requirement and clinics.
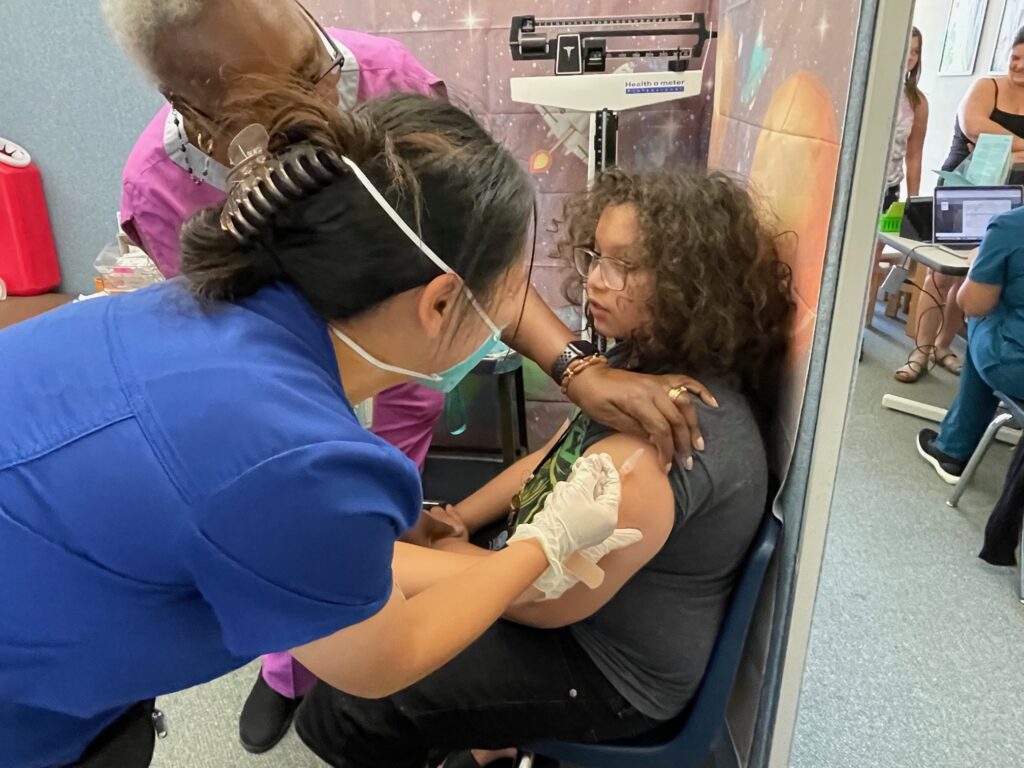
Cecilia Reyes and her older sister Chzaray, nervously waited for their turn at a vaccination clinic at the district headquarters on Aug. 22. Cecilia was preparing for her first day of kindergarten, but this would be the first time she got a vaccination. The Covid pandemic prevented the family from getting needed appointments, her mother said. Chzaray, who would be entering seventh grade, would need four shots to be up to date. The girls may need several appointments before they are fully vaccinated.
The Sacramento City Unified vaccination clinic immunized about 50 students that day in preparation for the first day of school. The number of students who visited a district vaccination clinic skyrocketed from 1,154 in 2021-22 to 1,739 visits last year, Sivils said. Students who are uninsured or are on Medi-Cal qualify for the clinic.
Damien Burkholder blinked back tears as a nurse gave him his Tdap booster last Tuesday. The shot is required for all seventh-grade students. His mother, Vanessa Martinez, had tried to get Damien an appointment for the shot with the family’s primary physician but would have had to wait a month.
“This is very convenient,” Martinez said of the clinic. “He would have had to miss a whole month of school if this weren’t here.”
California may have low public college tuition costs when compared to other colleges and universities nationally, but it is not enough to prevent students from taking high amounts of student loans.
A new study released exclusively to EdSource from The Century Foundation found Californians have higher average student debt balances, risky graduate school debt, a unique reliance on parent-held debt and significantly high student debt among Black families.
California’s high cost of living makes debt inevitable for many students, but the risk is greater for students from lower-income families and communities of color eager to use education as a ladder into the middle class. Open-ended loans aimed at parents and graduate students are particularly burdensome, including those used to attend for-profit colleges.
Despite having a smaller share of student loan borrowers when compared with other states, California’s borrowers are in the top third among states, with an average of $37,400 owed, according to national data from June 2022. That figure includes all borrowers, regardless of whether they attended college in California. The state ranks 16th out of 50 states and the District of Columbia for borrowers with high balances. This is despite having the fourth-lowest rate of student borrowers.
“One of California’s great successes is in college affordability and the fact that so many students go through college without debt,” said Peter Granville, a fellow at the foundation studying federal and state policy efforts to improve college affordability and author of the study. “Unfortunately, the Californians who do borrow take out some of the most risky debt around.” The foundation is a progressive, independent think tank that researches and promotes policy change to foster equity.
Besides the impact on individuals, student loan debt has become a larger problem for the American economy. Nationally, the current student loan debt totals $1.77 trillion.
“Student debt is something that is different from what it was 10 or 20 years ago,” U.S. Undersecretary of Education James Kvaal told higher education reporters earlier this month at UC Riverside. “People are borrowing more. They’re struggling more with those loans. It’s not just a problem for the 43 million Americans with student loan debt when they cannot afford to buy a house, start a new business or save for their own children or their retirement. It’s a problem for their families. It’s a problem for their communities. It’s a problem for our economy. It’s a fundamental crisis that we have to address in our country. We have to change how we’re financing higher education.”
Loan repayments restarting in October
With the Supreme Court rejecting President Joe Biden’s attempt to forgive $20,000 in loans for millions of borrowers, many are preparing to restart repayments in October. The situation underscores a larger student loan crisis in California and across the country. Millions of people, including those who never graduated from college and parents, are carrying student loan debt that they cannot afford and realistically may not ever pay back.
“Californians really struggle with repayment,” Granville said. “The state economy demands a college education, and I believe that demand drives up borrowing.”
And the situation is worse for graduates and families that borrow from the federal Parent PLUS and Grad PLUS loan programs that allow parents to borrow on behalf of their college students and graduate students to afford higher degrees, Granville said, adding that both programs offer high-interest, uncapped loans.
“These loans are probably the worst things to dangle in front of families with real genuine fears of being left behind economically,” he said. “But that leads to high balances that are difficult to manage.”
Graduate loan debt is larger in California than in the rest of the country, the study found. The state’s average annual Grad Plus loan is 25% higher than the rest of the country. In-state graduate students borrow on average $28,300 in loans each year compared with $22,400 nationally.
California places a premium on higher education in the state, Granville said. The average California worker with a graduate degree earns $108,500 – a 50% increase above the average income for bachelor’s degree holders.
The state also sees a disproportionate share of Black students borrowing student loans. In the 2015-16 academic year, 28% of Black in-state undergraduates borrowed loans compared with 21% of all undergraduates. At the graduate level, 81% of Black Californians took out student loans compared to 51% of all other graduate students.
“High borrowing among Black students in California locks in inequality that can last long into repayment,” Granville said. “Despite having a college degree and living in a higher income state, Black borrowers in California actually show worse financial security.”
Black women undergraduates borrow at the highest rates in any one year, with 31% taking loans in 2015-16 compared with 21% of all undergraduates, according to the study.
Granville said the data reflects the racial wealth gap.
“Black families have fewer financial resources than white families,” he said. “That leads to it being a lot harder to ask a Black family to self-finance education without debt. Homeownership also matters. You can take out a home equity loan for a much lower rate than a Parent Plus loan, for example.”
Latinos follow Black borrowers but with not as high graduate loan debt at 62%. But Latino families also have concerning trends. The majority of Latino borrowers in California don’t have a college degree, while only one-quarter of white borrowers don’t. The report explains that this could be due to a greater share of Latinos leaving college before they earn a degree or higher shares of parents borrowing on behalf of their children.
Granville said the state should examine whether all California families are “being potentially set up to fail.”
“Lawmakers should be looking at the colleges within California and asking, are colleges passing on high costs to students knowing that they can take out this uncapped loan debt?” he said. “I worry about how some loans are being sold to students by their colleges. Unless families are getting wise counsel, they may be unknowingly signing up for a pretty tough repayment experience.”
The racial wealth gap, along with California’s cost of living, makes it particularly challenging for Californians to pay their student debt, Granville said.
Repaying more than $200,000
In many ways, Richelle Brooks is a college success story. She’s also an outlier in the student debt crisis.
Credit: Courtesy of Richelle Brooks
Richelle Brooks
A first-generation college student, Brooks earned an associate degree from El Camino College, then went on to earn a bachelor’s and master’s degree from Cal State Dominguez Hills. She graduated with her doctorate in 2018 from Cal State Los Angeles.
Now, as a Los Angeles-area high school principal, she mentors and educates low-income students and students of color. She’s also facing more than $237,000 of student loan debt. The mom of three can’t fathom repaying it all, even with her $120,000 annual salary.
Enrolling in community colleges even after graduating with her doctorate, as well as the three-year pandemic pause, allowed her to put off making payments. But that could be coming to an end.
Brooks, who advocates for student loan forgiveness, participates in one of the federal government’s income-driven repayment plans, which slowly escalates her monthly payments based on her income as a high school principal. Her first payment, which restarts in October, is for $700. But by June 2024 it will increase to $2,600 a month.
“I ran the numbers,” Brooks, 36, said. “It’ll be cheaper to stay in school the rest of my life than to pay that $200,000.” (Federal loan repayments pause while a person is enrolled in school.)
About $33,000 of Brooks’ debt is just from interest that accumulated over the years. But because of the interest, Brooks said that her ability to pay off the debt “doesn’t exist.”
“On paper, it sounds like I make a lot of money,” she said. “But they’re not taking into consideration that I live in LA and I have three kids.”
Brook’s partner is a military veteran and teacher. He doesn’t have student loans because of his military service, but the couple found they’re unable to purchase a home for their family because of Brook’s debt-to-income ratio, a situation that affects many student borrowers. Brooks also supports her mother, who lives with the family after facing homelessness.
California’s high cost of living makes it difficult for young people coming out of college without significant family resources to accumulate assets like a home, especially if they have student loan debt. In California, 78% of Black households with student debt and 74% of Latino households with student debt have less than $50,000 in savings and investments, compared with 57% of white households with student loans, according to The Century Foundation.
In addition to her work as a principal, Brooks said she’s taken on other jobs to make ends meet, including driving Uber, and that’s before the loan repayments begin.
“Whatever it takes to make sure my kids have what they need and the bills are paid,” she said.
Brooks’ two oldest children are in high school and affording college is a common discussion in their home.
“I do not foresee a way for me to pay off my debt and figure out a way to pay my kids’ college, and I do not want them to go into debt,” she said. “I talked to my daughter about joining the military, but it’s kind of terrifying too because she’s a little Black girl. … So I’m trying to figure it out.”
As an educator, Brooks could apply for Public Service Loan Forgiveness, which she is considering once again. The program typically forgives the debt of people who work for a government or nonprofit employer, such as teachers, first responders and nurses. But forgiveness isn’t granted until after the borrower makes 120 or 10 years of payments.
Restarting repayments
Although Brooks’ debt amounts are larger than the average of most borrowers, her struggle to repay her college loans is common.
“In the popular imagination, there is this idea that student debt is a young people issue,” said Thomas Gokey, an organizer and co-founder of The Debt Collective, a union of advocates for publicly funded college, universal health care and guaranteed housing. “The truth is that the debt just doesn’t go away.”
People age, have children, grandchildren, and careers decades removed from graduation, and the “debt is still there,” Gokey said, adding that for many people, the monthly payments don’t cover the interest.
Some people have fully paid back their principle multiple times over, with the outstanding balance higher than the original balance. Other people may fall on hard times and can’t make payments, which leads to massive penalties, he said, referring to one case where a borrower defaulted on her student loan during the 2008 financial crisis and saw a $10,000 penalty added to her balance.
For undergraduates, even when their financial aid forms say they have $0 in expected family contributions, the cost of college attendance and tuition has increased to the point where aid doesn’t cover everything, he said. “The only option is Parent Plus loans to fill the gap. It’s just astonishing that a lot of parents will be paying off the loans for a longer period of time than they lived with or raised the children that they got the loan for.”
Granville said many, trying to get ahead, take on more loans after undergraduate loans.
“Students often turn to graduate education when they’re struggling with their undergraduate loans,” he said. “They may see the next degree as the thing that will give them the earning power to handle the debt that they have struggled with already.”
There is a misperception that a graduate degree means a person will be “really successful” and “make a lot of money,” Gokey said. “And that’s just not true if you’re a social worker,” he added, as an example of a lower salary job.
According to The Century Foundation’s data, a social worker with a bachelor’s degree earns on average $34,183 one year after completing their program, but has an average $15,599 in student loans. A social worker with a master’s degree earns an average of $54,223 one year after completing their program, but has on average nearly $80,000 in student loans. Licensed clinical social workers in California are required by the state to have a master’s degree in social work.
Gokey said that there’s no way to “financial literacy yourself” out of student loan debt.
Options and fixes
Although interest rates restarted in September and repayments resume in October, the federal government is giving borrowers a one-year grace period as it attempts to fix the loan system and offer solutions that significantly lower monthly payments.
“We really inherited a student loan system that was broken,” Kvaal said. “Before the student loan pause, we had a million students a year defaulting on their student loans.”
Kvaal said those defaults weren’t from people running from their responsibilities, but borrowers struggling with payments. Many of them were first-generation or students of color, he said.
Institution name
Type
Stafford (undergraduate)
Parent PLUS
Grad PLUS
Academy of Art University
For-profit
37%
30%
42%
Advanced Career Institute
For-profit
31%
n/a
n/a
Allan Hancock College
Public
42%
n/a
n/a
Alliant International University-San Diego
For-profit
n/a
n/a
n/a
American Academy of Dramatic Arts-Los Angeles
Non-profit
37%
n/a
n/a
American Career College-Los Angeles
For-profit
34%
21%
n/a
American Career College-Ontario
For-profit
37%
32%
n/a
American College of Healthcare and Technology
For-profit
51%
n/a
n/a
American River College
Public
44%
n/a
n/a
Angeles Institute
For-profit
32%
n/a
n/a
Antelope Valley College
Public
43%
n/a
n/a
Antioch University-Los Angeles
Non-profit
36%
n/a
n/a
Art Center College of Design
Non-profit
29%
n/a
n/a
Asher College
For-profit
31%
n/a
n/a
Ashford University
For-profit
46%
37%
44%
Associated Technical College-Los Angeles
For-profit
49%
n/a
n/a
Associated Technical College-San Diego
For-profit
n/a
n/a
n/a
Avalon School of Cosmetology-Alameda
For-profit
41%
n/a
n/a
Aveda Institute-Los Angeles
For-profit
37%
n/a
n/a
Azusa Pacific University
Non-profit
25%
16%
42%
Bakersfield College
Public
43%
n/a
n/a
Bard College – MAT Program CA
Non-profit
24%
17%
n/a
Bellus Academy-Chula Vista
For-profit
36%
n/a
n/a
Bellus Academy-El Cajon
For-profit
31%
n/a
n/a
Bellus Academy-Poway
For-profit
29%
n/a
n/a
Berkeley City College
Public
37%
n/a
n/a
Bethel Seminary-San Diego
Non-profit
18%
22%
36%
Biola University
Non-profit
20%
22%
32%
Blake Austin College
For-profit
27%
n/a
n/a
Brandman University
Non-profit
31%
n/a
39%
Brownson Technical School
For-profit
17%
n/a
n/a
Butte College
Public
42%
n/a
n/a
Cabrillo College
Public
42%
n/a
n/a
California Aeronautical University
For-profit
36%
n/a
n/a
California Baptist University
Non-profit
31%
30%
43%
California Career Institute
For-profit
32%
n/a
n/a
California College of the Arts
Non-profit
26%
32%
47%
California College San Diego
Non-profit
44%
n/a
n/a
California Hair Design Academy
For-profit
26%
n/a
n/a
California Healing Arts College
For-profit
37%
n/a
n/a
California Institute of Integral Studies
Non-profit
n/a
n/a
n/a
California Institute of the Arts
Non-profit
37%
n/a
n/a
California Lutheran University
Non-profit
22%
26%
n/a
California Nurses Educational Institute
For-profit
32%
n/a
n/a
California Polytechnic State University-San Luis Obispo
Public
12%
14%
24%
California State Polytechnic University-Pomona
Public
21%
22%
38%
California State University Maritime Academy
Public
17%
n/a
n/a
California State University-Bakersfield
Public
29%
n/a
n/a
California State University-Channel Islands
Public
22%
17%
n/a
California State University-Chico
Public
23%
22%
n/a
California State University-Dominguez Hills
Public
27%
n/a
32%
California State University-East Bay
Public
25%
22%
35%
California State University-Fresno
Public
24%
n/a
34%
California State University-Fullerton
Public
20%
27%
29%
California State University-Long Beach
Public
20%
22%
37%
California State University-Los Angeles
Public
23%
n/a
37%
California State University-Monterey Bay
Public
24%
17%
37%
California State University-Northridge
Public
22%
17%
37%
California State University-Sacramento
Public
24%
20%
36%
California State University-San Bernardino
Public
27%
22%
40%
California State University-San Marcos
Public
23%
n/a
n/a
California State University-Stanislaus
Public
23%
17%
36%
California Western School of Law
Non-profit
n/a
n/a
n/a
Cambridge Junior College-Yuba City
For-profit
31%
n/a
n/a
Career Academy of Beauty
For-profit
22%
n/a
n/a
Career Care Institute
For-profit
37%
n/a
n/a
Career Networks Institute
For-profit
33%
n/a
n/a
Carrington College-Sacramento
For-profit
37%
20%
n/a
Casa Loma College-Van Nuys
Non-profit
27%
n/a
n/a
CBD College
Non-profit
27%
n/a
n/a
Central Coast College
For-profit
22%
n/a
n/a
Cerritos College
Public
32%
n/a
n/a
CET-San Diego
Non-profit
40%
n/a
n/a
Chabot College
Public
37%
n/a
n/a
Chamberlain University-California
For-profit
26%
24%
30%
Chapman University
Non-profit
20%
18%
n/a
Charles R Drew University of Medicine and Science
Non-profit
n/a
n/a
37%
Cinta Aveda Institute
For-profit
36%
n/a
n/a
Citrus College
Public
33%
n/a
n/a
City College of San Francisco
Public
43%
n/a
n/a
Claremont Graduate University
Non-profit
n/a
n/a
n/a
Coastline Community College
Public
43%
n/a
n/a
Cogswell University of Silicon Valley
For-profit
32%
n/a
n/a
College of Marin
Public
51%
n/a
n/a
College of the Canyons
Public
37%
n/a
n/a
College of the Redwoods
Public
37%
n/a
n/a
College of the Sequoias
Public
32%
n/a
n/a
College of the Siskiyous
Public
45%
n/a
n/a
Columbia College – Los Alamitos
Non-profit
39%
n/a
38%
Columbia College Hollywood
Non-profit
39%
32%
n/a
Concorde Career College-Garden Grove
For-profit
27%
n/a
n/a
Concorde Career College-North Hollywood
For-profit
29%
n/a
n/a
Concorde Career College-San Bernardino
For-profit
35%
n/a
n/a
Concorde Career College-San Diego
For-profit
37%
n/a
n/a
Concordia University-Irvine
Non-profit
22%
27%
27%
Contra Costa College
Public
37%
n/a
n/a
Cosumnes River College
Public
45%
n/a
n/a
Cuesta College
Public
30%
n/a
n/a
Culinary Institute of America at Greystone
Non-profit
24%
33%
n/a
Cypress College
Public
30%
n/a
n/a
De Anza College
Public
34%
n/a
n/a
Design’s School of Cosmetology
For-profit
36%
n/a
n/a
DeVry University-California
For-profit
42%
29%
40%
Diablo Valley College
Public
27%
n/a
n/a
Diversified Vocational College
For-profit
51%
n/a
n/a
Dominican University of California
Non-profit
20%
n/a
37%
East Los Angeles College
Public
33%
n/a
n/a
Empire College
For-profit
27%
n/a
n/a
Feather River Community College District
Public
41%
n/a
n/a
Federico Beauty Institute
For-profit
27%
n/a
n/a
FIDM-Fashion Institute of Design & Merchandising-Los Angeles
For-profit
30%
32%
n/a
Fielding Graduate University
Non-profit
n/a
n/a
37%
Folsom Lake College
Public
42%
n/a
n/a
Foothill College
Public
35%
n/a
n/a
Fremont College
For-profit
43%
n/a
n/a
Fresno City College
Public
37%
n/a
n/a
Fresno Pacific University
Non-profit
28%
n/a
38%
Fuller Theological Seminary
Non-profit
n/a
n/a
n/a
Fullerton College
Public
36%
n/a
n/a
Glendale Career College
For-profit
22%
n/a
n/a
Glendale Community College
Public
27%
n/a
n/a
Golden Gate University-San Francisco
Non-profit
27%
n/a
n/a
Golden West College
Public
32%
n/a
n/a
Grossmont College
Public
30%
n/a
n/a
Gurnick Academy of Medical Arts
For-profit
25%
n/a
n/a
Harvey Mudd College
Non-profit
8%
n/a
n/a
High Desert Medical College
For-profit
31%
n/a
n/a
Holy Names University
Non-profit
31%
n/a
n/a
Homestead Schools
Non-profit
32%
n/a
n/a
Hope International University
Non-profit
30%
n/a
n/a
Humboldt State University
Public
29%
22%
37%
Humphreys University-Stockton and Modesto Campuses
Non-profit
41%
n/a
n/a
Hussian College-Los Angeles
For-profit
53%
n/a
n/a
Institute for Business and Technology
For-profit
36%
n/a
n/a
Institute of Culinary Education
For-profit
19%
n/a
n/a
Institute of Technology
For-profit
43%
n/a
n/a
InterCoast Colleges-Santa Ana
For-profit
40%
n/a
n/a
International School of Beauty Inc
For-profit
42%
n/a
n/a
International School of Cosmetology
For-profit
32%
n/a
n/a
Irvine Valley College
Public
37%
n/a
n/a
John F. Kennedy University
Non-profit
37%
n/a
n/a
La Sierra University
Non-profit
33%
27%
n/a
Laguna College of Art and Design
Non-profit
27%
n/a
n/a
Laney College
Public
47%
n/a
n/a
Laurus College
For-profit
53%
n/a
n/a
Life Chiropractic College West
Non-profit
n/a
n/a
47%
Life Pacific University
Non-profit
22%
n/a
n/a
Loma Linda University
Non-profit
22%
n/a
n/a
Long Beach City College
Public
36%
n/a
n/a
Los Angeles Center
Non-profit
29%
n/a
n/a
Los Angeles City College
Public
37%
n/a
n/a
Los Angeles Film School
For-profit
47%
37%
n/a
Los Angeles Mission College
Public
37%
n/a
n/a
Los Angeles Pierce College
Public
40%
n/a
n/a
Los Angeles Southwest College
Public
32%
n/a
n/a
Los Angeles Trade Technical College
Public
39%
n/a
n/a
Los Angeles Valley College
Public
37%
n/a
n/a
Loyola Marymount University
Non-profit
17%
24%
n/a
Lu Ross Academy
For-profit
26%
n/a
n/a
Make-up Designory
For-profit
19%
22%
n/a
Marshall B Ketchum University
Non-profit
n/a
n/a
32%
Marymount California University
Non-profit
35%
n/a
n/a
Mayfield College
For-profit
39%
n/a
n/a
Mendocino College
Public
42%
n/a
n/a
Menlo College
Non-profit
27%
n/a
n/a
Merritt College
Public
42%
n/a
n/a
Miami Ad School-San Francisco
For-profit
32%
n/a
n/a
Middlebury Institute of International Studies at Monterey
Non-profit
14%
n/a
n/a
Milan Institute of Cosmetology-Fairfield
For-profit
49%
n/a
n/a
Milan Institute-Fresno
For-profit
46%
n/a
n/a
Milan Institute-Palm Desert
For-profit
45%
n/a
n/a
Milan Institute-Visalia
For-profit
34%
n/a
n/a
Mills College
Non-profit
26%
n/a
n/a
MiraCosta College
Public
37%
n/a
n/a
Moler Barber College
For-profit
n/a
n/a
n/a
Monterey Peninsula College
Public
42%
n/a
n/a
Moorpark College
Public
32%
n/a
n/a
Moreno Valley College
Public
32%
n/a
n/a
Mount Saint Mary’s University
Non-profit
28%
17%
n/a
Mt San Antonio College
Public
32%
n/a
n/a
MTI College
For-profit
29%
n/a
n/a
Musicians Institute
For-profit
35%
32%
n/a
National Career College
For-profit
36%
n/a
n/a
National Holistic Institute
For-profit
28%
n/a
n/a
National University
Non-profit
32%
n/a
39%
New York Film Academy
For-profit
35%
n/a
n/a
North Adrian’s College of Beauty Inc
For-profit
46%
n/a
n/a
Northcentral University
Non-profit
n/a
n/a
37%
North-West College-Pomona
For-profit
24%
n/a
n/a
North-West College-Van Nuys
For-profit
22%
n/a
n/a
North-West College-West Covina
For-profit
22%
n/a
n/a
Notre Dame de Namur University
Non-profit
26%
32%
47%
NTMA Training Centers of Southern California
Non-profit
27%
n/a
n/a
Occidental College
Non-profit
14%
n/a
n/a
Orange Coast College
Public
29%
n/a
n/a
Otis College of Art and Design
Non-profit
27%
32%
n/a
Pacific College
For-profit
27%
n/a
n/a
Pacific College of Health and Science
For-profit
42%
n/a
47%
Pacific Oaks College
Non-profit
30%
n/a
n/a
Pacific Union College
Non-profit
29%
n/a
n/a
Pacifica Graduate Institute
For-profit
n/a
n/a
47%
Palo Alto University
Non-profit
n/a
n/a
47%
Palomar College
Public
32%
n/a
n/a
Palomar Institute of Cosmetology
For-profit
22%
n/a
n/a
Pasadena City College
Public
37%
n/a
n/a
Paul Mitchell the School-East Bay
For-profit
27%
n/a
n/a
Paul Mitchell the School-Fresno
For-profit
41%
n/a
n/a
Paul Mitchell the School-Modesto
For-profit
32%
n/a
n/a
Paul Mitchell the School-Pasadena
For-profit
32%
n/a
n/a
Paul Mitchell the School-Sacramento
For-profit
37%
n/a
n/a
Paul Mitchell the School-Sherman Oaks
For-profit
27%
n/a
n/a
Paul Mitchell the School-Temecula
For-profit
32%
n/a
n/a
Pepperdine University
Non-profit
20%
22%
39%
Pima Medical Institute-Chula Vista
For-profit
29%
20%
n/a
Pitzer College
Non-profit
17%
n/a
n/a
Platt College-Los Angeles
For-profit
34%
n/a
n/a
Point Loma Nazarene University
Non-profit
19%
27%
n/a
Premiere Career College
For-profit
29%
n/a
n/a
Reedley College
Public
42%
n/a
n/a
Relay Graduate School of Education – California
Non-profit
n/a
n/a
37%
Riverside City College
Public
34%
n/a
n/a
Sacramento City College
Public
42%
n/a
n/a
Saddleback College
Public
30%
n/a
n/a
SAE Expression College
For-profit
42%
n/a
n/a
Saint Mary’s College of California
Non-profit
19%
37%
32%
Salon Success Academy-Corona
For-profit
42%
n/a
n/a
Salon Success Academy-Upland
For-profit
36%
n/a
n/a
Samuel Merritt University
Non-profit
8%
n/a
36%
San Diego Christian College
Non-profit
32%
n/a
n/a
San Diego City College
Public
41%
n/a
n/a
San Diego Mesa College
Public
33%
n/a
n/a
San Diego Miramar College
Public
32%
n/a
n/a
San Diego State University
Public
21%
16%
38%
San Francisco Art Institute
Non-profit
32%
n/a
n/a
San Francisco Institute of Esthetics & Cosmetology Inc
For-profit
31%
n/a
n/a
San Francisco State University
Public
24%
22%
35%
San Joaquin Delta College
Public
46%
n/a
n/a
San Joaquin Valley College-Visalia
For-profit
42%
22%
n/a
San Jose City College
Public
42%
n/a
n/a
San Jose State University
Public
18%
14%
33%
Santa Ana College
Public
32%
n/a
n/a
Santa Barbara Business College-Bakersfield
For-profit
45%
n/a
n/a
Santa Barbara Business College-Santa Maria
For-profit
34%
n/a
n/a
Santa Barbara City College
Public
36%
n/a
n/a
Santa Clara University
Non-profit
9%
27%
n/a
Santa Monica College
Public
33%
n/a
n/a
Santa Rosa Junior College
Public
31%
n/a
n/a
Saybrook University
Non-profit
n/a
n/a
37%
Shasta College
Public
39%
n/a
n/a
Sierra College
Public
40%
n/a
n/a
Simpson University
Non-profit
20%
n/a
n/a
Solano Community College
Public
42%
n/a
n/a
Sonoma State University
Public
21%
14%
37%
South Baylo University
Non-profit
n/a
n/a
n/a
South Coast College
For-profit
42%
n/a
n/a
Southern California Health Institute
For-profit
39%
n/a
n/a
Southern California Institute of Technology
For-profit
23%
n/a
n/a
Southern California University of Health Sciences
Non-profit
n/a
n/a
47%
Southwestern College
Public
32%
n/a
n/a
Southwestern Law School
Non-profit
n/a
n/a
n/a
Spartan College of Aeronautics & Technology
For-profit
31%
n/a
n/a
Stanbridge University
For-profit
20%
n/a
n/a
Stanford University
Non-profit
12%
n/a
17%
SUM Bible College and Theological Seminary
Non-profit
47%
n/a
n/a
Summit College
For-profit
37%
n/a
n/a
The Chicago School of Professional Psychology at Anaheim
Non-profit
32%
n/a
n/a
The Master’s University and Seminary
Non-profit
12%
n/a
n/a
Thomas Jefferson School of Law
Non-profit
n/a
n/a
n/a
Touro University California
Non-profit
n/a
n/a
n/a
Touro University Worldwide
Non-profit
n/a
n/a
32%
Trident University International
For-profit
32%
n/a
33%
Trinity Law School
Non-profit
31%
n/a
38%
UEI College-Fresno
For-profit
50%
37%
n/a
UEI College-Gardena
For-profit
46%
22%
n/a
United Education Institute-Huntington Park Campus
For-profit
45%
37%
n/a
United States University
For-profit
42%
n/a
n/a
Unitek College
For-profit
21%
17%
n/a
Universal Technical Institute of California Inc
For-profit
37%
22%
n/a
Universal Technical Institute of Northern California Inc
For-profit
38%
22%
n/a
University of Antelope Valley
For-profit
31%
n/a
n/a
University of California-Berkeley
Public
13%
14%
30%
University of California-Davis
Public
12%
13%
37%
University of California-Hastings College of Law
Public
n/a
n/a
n/a
University of California-Irvine
Public
15%
14%
37%
University of California-Los Angeles
Public
15%
18%
33%
University of California-Merced
Public
20%
18%
n/a
University of California-Riverside
Public
22%
19%
n/a
University of California-San Diego
Public
13%
12%
31%
University of California-San Francisco
Public
n/a
n/a
32%
University of California-Santa Barbara
Public
16%
19%
28%
University of California-Santa Cruz
Public
20%
18%
32%
University of La Verne
Non-profit
30%
27%
41%
University of Phoenix-California
For-profit
43%
35%
42%
University of Redlands
Non-profit
27%
27%
38%
University of San Diego
Non-profit
16%
24%
n/a
University of San Francisco
Non-profit
19%
22%
41%
University of Southern California
Non-profit
16%
25%
n/a
University of St. Augustine for Health Sciences
For-profit
n/a
n/a
32%
University of the Pacific
Non-profit
19%
22%
n/a
Vanguard University of Southern California
Non-profit
26%
27%
n/a
Ventura College
Public
37%
n/a
n/a
Victor Valley College
Public
46%
n/a
n/a
West Coast Ultrasound Institute
For-profit
32%
n/a
n/a
West Coast University-Los Angeles
For-profit
25%
30%
32%
West Hills College-Coalinga
Public
47%
n/a
n/a
West Hills College-Lemoore
Public
42%
n/a
n/a
West Los Angeles College
Public
32%
n/a
n/a
Western University of Health Sciences
Non-profit
n/a
n/a
n/a
Westmont College
Non-profit
12%
n/a
n/a
Whittier College
Non-profit
29%
32%
n/a
William Jessup University
Non-profit
24%
n/a
n/a
Woodbury University
Non-profit
37%
27%
n/a
Source: College Scorecard
One fix the department has worked on is the loan forgiveness program for borrowers working in public service, which would help educators like Brooks. Prior to the pandemic, even people who were eligible for forgiveness were denied, Kvaal said, which is why fewer than 7,000 people saw forgiveness. Since the Biden Administration announced changes to the program, so far up to 660,000 people have had their loans forgiven through public service.
The Biden administration’s new repayment plan can also significantly cut loan payments or reduce them to $0, Kvaal said, adding that, so far, 4 million people have enrolled in the plan.
Kvaal said the administration is looking at other options.
“The president has asked us to offer loan forgiveness to as many people as possible and as quickly as possible,” Kvaal said. “We’re telling students it’s time for them to repay. At the same time, we’re doing everything we can to reform the student loan program to make sure that students have access to the loan forgiveness that they have earned … and that people are taking advantage of the most affordable payment plan that has ever been created.”
Kvaal said the Education Department is also looking into the amount of debt that comes out of for-profit programs, online graduate programs and the Parent Plus loan program.
Granville, from The Century Foundation, also has national recommendations. For example, Congress should lower the interest rate on student loans. According to The Debt Collective, Congress sets the interest rates for federal student loans. Those rates are tied to the 10-year Treasury note. Because the Federal Reserve has recently been increasing rates, the treasury bond rate has increased and so has the rate for new student loans.
The current fixed rates for new undergraduate loans are at 5.5%, for graduate, 7.05% for professional unsubsidized loans, and 8.05% for Parent Plus and Grad Plus loans.
At the state and local level, Granville said that loan counseling needs to significantly change. Much of the responsibility for understanding student loans is often put on 18- and 19-year-olds, who may be the first in their families to go to college, Granville said.
“The first answer is more grant aid for students so that we can reach a debt-free financing system, not just because it helps students as individuals, but because it helps the state,” he said. “We also haven’t done a great job setting up students for success despite all of their own personal investment in education. We can rectify that situation through more generous repayment plans, but we also need to make sure that we’re giving students high-quality options so they don’t need as much debt in the first place.”
For Brooks, the high school principal with student debt, the ultimate solution is free education.
“If you go to college, you’re stricken with debt,” Brooks said. “If you don’t go to college, then you don’t have a livable wage or enough money to survive. You have to do something.”
And college tuition in California, prior to the mid-1980’s was free, she said.
“I’m of the mindset that education is a public good and it serves everyone to have a highly educated populace,” Brooks said. “It should be free altogether.”
Teachers Preston Jackson, right, and Dave Carson confer during a P.E. class at California Middle School in Sacramento.
Credit: Randall Benton / EdSource
Petrina Miller remembers, as a young teacher in Los Angeles Unified, helping another teacher during district testing and noticing that the teacher was giving Black students and other students of color the answers. Miller asked her why she was doing that.
“Let them have a productive struggle,” Miller said. “Let them try, and whatever score they get is what they get. And that’s fine.”
The teacher said, “Poor little babies, they don’t know any better,” in a way that made Miller uncomfortable. On another day, the same teacher used a racist term to refer to Miller, who is Black.
This is the first part of a special series on the recruitment and retention of Black teachers in California. The recruitment and hiring of Black educators has lagged, even as a teacher shortage has given the task new urgency.
Our series looks at the obstacles that keep Black people from becoming teachers, and the bias and lack of support some face when they join the profession.
The second story in the series features the stories of five Black teachers, who will talk about their experiences in the classroom. The final story will look at what California and school districts are doing to recruit and retain Black teachers, and what still needs to be done.
The incidents were reported to the principal, but the teacher continued to work at the school. Miller isn’t sure if she was ever disciplined.
California and other states have been trying to recruit and retain Black teachers for years, but the numbers aren’t improving. Among the factors impeding this goal, along with the cost of teacher preparation, is a lack of support and respect for Black teachers once they are in the classroom, according to teachers.
“Black teachers leave the profession because they don’t feel supported for what they are able to bring to the table in terms of their unique experiences, and they leave because of the fact that they are not seen as equal to their colleagues,” said Brenda Walker, a Black teacher who is president of Associated Chino Teachers.
In the 2020-21 school year, the most recent data available, 3.8% of all teachers in California were Black, according to the National Center for Education Statistics. Black students made up 5.2% of the state’s student population that year, according to the California Department of Education.
Number of Black teachers declining nationwide
The state is doing better than the nation as a whole. Just over 6% of U.S. teachers were Black in the 2021-21 school year; 1.3% of U.S. teachers were Black men. Black students made up 15% of the students that year. The number of Black teachers in the U.S. has been declining for years.
A growing body of research shows that having a teacher of color in the classroom is important to students of color, resulting in higher test scores and a greater likelihood of graduating from college. Research also shows that having Black teachers in the classroom has a positive impact on all students, regardless of their race, said Travis Bristol, an associate professor of education at UC Berkeley, who has done extensive research on the topic.
“The framing, I think historically, has been that Black teachers are just good for Black students,” Bristol said. “And while that is true, it is also true that Black teachers are lowering the suspension rates of students who are not Black.”
Roadblocks to teaching begin early
The first hurdle for potential Black teachers comes early, while they are still students in K-12 schools, Bristol said.
“We suspend and expel a disproportionate number of Black children,” he said. “There is evidence, there’s research that if you are suspended and expelled, it decreases the likelihood that you then move on to pursue a higher education.”
The cost of teacher preparation is a major roadblock to a credential. Tuition, the cost of required tests and unpaid student teaching have kept many Black people out of the profession, according to teachers interviewed by EdSource.
Black teachers owe an average of $43,000 more in college debt than white graduates 12 years after graduation, according to the Learning Policy Institute, a nonprofit education research organization. The low salary of new teachers and the high amount of college debt associated with five years of college can dissuade Black people from becoming teachers. Many also aren’t financially able to quit their jobs to complete the 600 hours of unpaid student teaching required to complete a credential.
Brooke Sims, a first-grade teacher in Stockton, who also serves as a mentor teacher, says she’s still struggling to repay student loans after 16 years of teaching.
“I definitely believe free classes, free courses or free programs … would help recruit and retain more teachers,” she said.
Lack of funds pushes Black teachers into internships
To help pay the bills, many Black teachers take an internship instead of the traditional route to a credential, which includes student teaching with a mentor teacher. Interns work as full-time teachers while undergoing teacher preparation. They are paid, but they are put into classrooms with little preparation during the first few years of teaching.
“They hire you on Friday, you are in a classroom on Monday,” said Miller, who started her career with LA Unified as an intern 26 years ago. “You have maybe a week. It felt that quick. Along the way, you went to teach, went to training and learned on the job.”
A lack of mentors meant Miller met with the one appointed by the program about once every three months. Later, a traveling mentor was hired by the program and visited the school monthly, but primarily to drop off materials, she said.
“As a teacher of color, it was a struggle,” Miller said. “I had to try to find my own support from someone else.”
Turnover rates in K–12 schools for teachers of color are higher than their white counterparts. In 2022 the turnover rate for Black teachers was 22%. The turnover rate for white teachers is 15%, according to the National Center for Education Statistics. Black teachers interviewed for the 2023 State of the American Teacher Survey reported significantly higher rates of burnout than white teachers and were more likely to report low salaries as a source of stress.
Teachers sometimes feel undervalued, disrespected
Teachers interviewed by EdSource said their work has been scrutinized more closely than their peers, and they have felt disrespected or undervalued because they are Black.
“What we know is that, because Black teachers are positioned, in particular Black men teachers, are positioned as enforcers first and teacher second, that they’re not always viewed by their white colleagues as having expertise as it relates to teaching and learning,” Bristol said.
Krystle Goff, a targeted student population coordinator at 122nd Street Elementary in Los Angeles, says Black teachers are under pressure to be perfect. They feel they have to continually prove themselves to administrators and other teachers. Black teachers aren’t given the same grace as their counterparts, she said.
“It feels like we’re coming up short. It feels like we’re not meeting the criteria, and so, we exit the field altogether,” said Goff, who is responsible for the redesignation of English learners at the school.
The heightened scrutiny and lack of support of Black teachers comes from colleagues of all races, including fellow Black teachers and administrators, Goff said.
“I think that because we work for a system that sort of perpetuates that cycle of power and just white supremacy, we don’t know how to support (one another), Goff said. … “You don’t even realize that how you’re interacting with each other is just not productive.”
Black teachers say they sometimes feel dismissed by people who question whether they are teachers while they are carrying out their duties.
“I’ve shown up to field trips where I was the teacher that had arranged the field trip, and I’ve got my backpack on,” Sims said. “I’ve got a badge on with keys. I have a T-shirt that matches the children’s T-shirt that says I belong to this school. And I’m like, ‘Hi, I’m Ms. Sims. I called. We’re here for our field trip.’ ‘Well, (they ask). ‘Are youthe teacher’?”
“We’re automatically, a lot of times, dismissed, or it’s assumed that we’re not the teacher,” said Preston Jackson, a physical education teacher at California Middle School in Sacramento. “(They assume) we’re the campus monitor, or we’re the custodian. So right off the bat, you’re having to fight that type of bias that is still out there because there aren’t that many Black teachers.”
Being a teacher is hard, but being a Black teacher is harder, Jackson said.
“Ninety percent you probably are going to be on a site where you’re the only one there,” Jackson said. “And so, you’re not going to have someone there that has gone through a similar process, because being a Black teacher is a completely different situation.”
Inadequate support, feelings of isolation
A recent survey of 128 former and current Black teachers by the Black Educator Advocates Network titled “What Schools must Do to Retain Black Educators,” found that these teachers face challenges in expressing their cultural identity, ranging from discomfort with colleagues’ comments, to a lack of support in addressing racism within their schools. Some teachers mentioned feeling isolated or encountering resistance when discussing anti-Blackness or organizing cultural events.
“Just as all students benefit from the experience of having classroom teachers from diverse backgrounds, school districts benefit from educators who bring their expansive experiences of many cultures to their school communities,” Chino Valley’s Walker told EdSource. “But, showing up as our true and authentic selves is not always understood and appreciated. School districts should make implicit bias training mandatory for all employees, not just once, but on an annual basis.”
Sims agrees that implicit bias training is important, but she remembers attending a training session that left her feeling uncomfortable and angry. She remembers a discussion about students who couldn’t afford to buy clothes that complied with the school’s dress code. One teacher at the training said: “These kids” can’t come to school prepared, but they come to school with brand-new Jordans, Sims said.
“Well, I know what that coded language means when you’re talking about children wearing Jordans,” Sims said. “I know you’re talking about Black children. Obviously, everybody wears Jordans. But that was the time that I got really heated. And I said to myself, ‘Brooke, walk out the room, get some air because part of you wants to correct that person.’ And I probably should have.”
Since that incident, Sims has become part of her union’s executive board and has taken training from the California Teachers Association on how to deal with racist comments and microaggression.
“I’m just learning to be OK to do that at 41 years old,” she said.
Cultural brokering often expected
Black teachers say they are often saddled with extra responsibilities, including serving as liaisons to Black families and disciplining Black students because of their race.
More than half of the respondents to the Black Educator Advocates Network survey said that because of their race, they are expected to educate others about racism and are expected to lead professional development sessions, teach classes on Black identity and address racism in various ways at their schools.
Collectively, the experiences of Black educators, coupled with being tasked with working with Black families disproportionately impacted by the pandemic, have left Black teachers exhausted, Alicia Simba, a transitional kindergarten teacher in Oakland Unified, told EdSource.
“It’s difficult when kids are carrying so much and parents are carrying so much, and wanting to be there to help them can be physically exhausting, as well as emotionally exhausting,” Simba said. “I think a lot of conversation around (teacher) burnout comes from that.”
Black teachers may feel they have to leave the profession to preserve their emotional well-being, even if they love the kids and the community and love to teach, Simba said, adding that teachers who work in schools with a large population of Black students also put in extra work because those schools are usually under-resourced.
“I’m working longer hours because we don’t have the cleaning staff that other schools might have, or a regular custodian like other schools might have,” Simba said. “So, I’m spending extra time having to clean up, or maybe I’m spending extra money on getting books for the kids because our budget isn’t as big as other schools or, with other schools, they might fundraise.”
Clarity matters when explaining to parents how their children did on standardized tests. An imprecise characterization of a complicated score can mislead parents into assuming their kids performed better than they did.
That issue is at the heart of the opposition to draft revisions to descriptions of students’ scores on the Smarter Balanced assessments that are sent home to parents. While the degree of difficulty of the tests and their scoring wouldn’t change, the characterization of the results would, like replacing the term “standard not met” with “inconsistent” for the lowest scores.
Parent focus groups this week
The California Department of Education is scheduling three online focus groups to gather thoughts, questions and concerns on proposed changes to how scores on the Smarter Balanced statewide assessments will be reported publicly. The meetings are for parents, teachers and students.
Tuesday, Dec. 3, 6 to 7 p,m.: Session 1, in English
Wednesday, Dec. 4, 7 to 8 p.m. Session 2, in English for students only
Thursday, Dec. 5, 6 to 7 p.m. Session 3, in Spanish
The State Board of Education delayed its adoption at its November meeting because of criticism that the revised wording may compound, not solve, current unclear language.
Board members listened to children’s advocacy groups who chided state officials for not first consulting with teachers and parents before taking any action — which state officials acknowledged they hadn’t done.
In a letter to the state board about the proposed changes, particularly the labeling of low test scores, nine student advocacy groups — the Alliance for Students — argued that the revised language “will only serve to obfuscate the data and make it even more challenging for families and advocates to lift the needs of our most underserved students.” Signers of the letter include Teach Plus, Children Now, and Innovate Public Schools.
Getting the terms right is important for the assessment scores to be useful to parents and teachers, Sarah Lillis, executive director of Teach Plus California, told EdSource. “We want to make sure the signals sent by the descriptors foster dialogue” and encourage parents to ask the right questions.
“We echo the concerns of our colleagues,” testified Lindsay Tornatore, representing the California County Superintendents at the board’s Nov. 13 meeting. “Outreach to parents, families and the community should have been prioritized to engage in multiple opportunities prior to the changes being made.”
In response, the California Department of Education hastily scheduled online presentations this week for parents and teachers, with the expectation that they will consider any recommendations at their next meeting in January.
How scores are reported
A student’s scores on the Smarter Balanced tests in English language arts and math and on the California Science Test fall within one of four achievement levels that provide context on how the student performed. Level 4, with the highest attainable scores, is also labeled “Standard Exceeded.” Level 3 is labeled Standard Met; Level 2 is Standard Nearly Met, and Level 1 is Standard Not Met. Many of the dozen states and territories that give Smarter Balanced use the same definitions.
The target is to score at least Level 3, which indicates a student is working at grade level. In the 2023-24 results, fewer than half of students achieved Levels 3 or 4: 53% scored at levels 1 or 2 in English language arts, and 64.5% scored at Levels 1 or 2 in math. The tests are given to students in grades three through eight and grade 11.
Statewide scores were worse in science, which is given to students in grades five, eight, and once in high school, 69.3% failed to meet Level 3 — the grade-level standard — in 2023-24.
In response to criticism that the existing labels are vague, imprecise and confusing, Smarter Balanced representatives decided to create a new set of labels and brief descriptions, which states have the option to use. This is particularly so for Level 2 — the “Standard Nearly Met” label. Many parents don’t understand what nearly meeting grade-level standards in particular means.
Under the Smarter Balanced draft for the scoring bands, Level 4 would become “Advanced,” Level 3 would be “Proficient,” Level 2 would be “Foundational,” and Level 1 would be “Inconsistent.”
A draft description for Level 2 in language arts for third to fifth grade would read, “The student demonstrates foundational grade-level skills and shows a basic understanding of and ability to apply the knowledge and skills in English language arts/literacy needed for likely success in future coursework.”
In letters and in remarks at the board meeting, critics indicated they’re fine with “Advanced” and “Proficient” but are unhappy with the labels Foundational and Inconsistent for Levels 1 and 2.
“The language is confusing and not engaging for families with the first two levels,” said Joanna French, director of research and policy strategies for Innovate Public Schools. “If a student is not at grade level, be direct about that. You cannot address a problem you cannot see.”
Tonya Craft-Perry, a 15-year teacher who is active in the Black Parent Network of Innovate Public Schools, said that “’Foundational’ could lead parents to believe their children are doing better than they are. It makes the district and teachers look better, but if a low score requires intervention, a parent needs to know that,” she said.
Several board members indicated that one easy remedy would be to include language in the revision’s current descriptions. The wording makes clear that a student scoring in Level 2 “may require further development” to demonstrate the knowledge and skills to succeed in future grades or, for older students, in college courses after high school. Students scoring in Level 1 “needs substantial improvement” to succeed.
News media oversimplifies
In a two-page explanation, Smarter Balanced blamed the news media for much of the misunderstanding over the current wording of the labels.
“The media often incorrectly reports that students who aren’t proficient ‘can’t do math’ or ‘can’t read.’ This is not true. The Smarter Balanced assessments are aligned to grade-level content, and students who achieve Levels 2, 3, and 4 do, in fact, demonstrate a continuum of grade-level knowledge and skills,” it said.
Students at all three of those levels are showing that they “understand core content,” said Linda Darling-Hammond, president of the California State Board of Education, at the board meeting.
But as scores progress from one level to the next, students convey increasing accuracy and complexity in their knowledge and skills. Smarter Balanced said students demonstrate this in how they respond to more complex reading passages, concepts and advanced vocabulary, or in math, the number of elements in equations and difficult word problems.
Rob Manwaring, a senior adviser to the advocacy group Children Now, said that the new labels would feed the “reality gap in the perceptions of parents that their kids are doing better than they are” in school. In an often-cited 2023 parent survey in communities nationwide, survey firm Gallup and the nonprofit parent advocacy organization Learning Heroes found that, based on their kids’ report cards, parents’ perceptions were out of whack with how their children did on assessments. In Sacramento County, where 28% of students were proficient in math tests, 85% of parents believed their children were proficient.
“Now we are suggesting that students scoring below standard are foundational. Many parents will conclude, ‘My kid is doing fine,’” Manwaring said.
)