
Credit: Viviana Mendoza
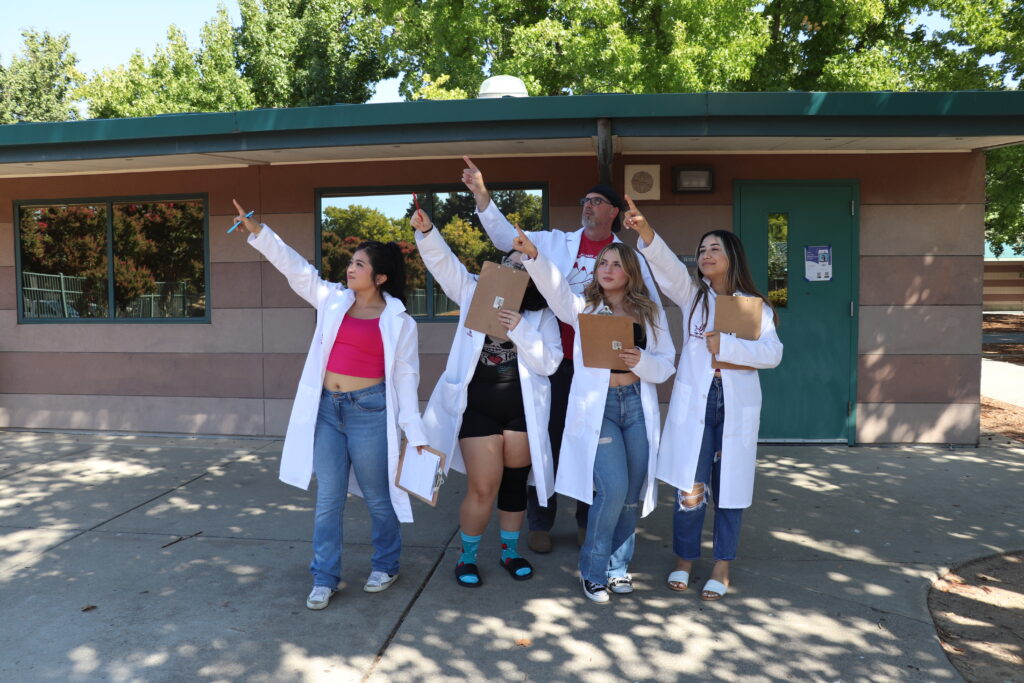
If you were to show up at Natomas High School in the middle of the school day, you would likely stumble upon my students walking around the campus in lab coats and examining their environment, looking for answers to questions that they themselves have posed.
That’s because, as an Advanced Placement (AP) seminar and research teacher, I teach my students to think outside the box to fan the flames of their intellectual curiosity. And to this day, I never cease to be amazed by the theories they pose and the conclusions they draw.
There’s nothing more gratifying for me than challenging students who for too long have been shackled by low expectations to take my AP classes. Many of them are surprised to learn that these are often the most creative classes they’ve ever participated in. I then get to watch them thrive as they develop and practice life skills in research, collaboration and communication. In fact, a few of my students have gone on to be research assistants in college, using the skills we developed in my class as their foundation. And the critical thinking abilities that they develop through these classes expand far beyond the classroom walls — they promote intellectual curiosity no matter what career or life path students end up choosing.
I also think it’s time to shatter stereotypes about what an AP student should look like. Other people might look at the socioeconomic metrics of our school and see only despair, but I see unlimited potential. At Natomas High School, our total minority enrollment is 91%, with 72% of students coming from “economically disadvantaged” backgrounds. My AP classes also reflect the school’s diversity.
As a teacher, it’s my job to challenge and guide all of my students. In my experience, real learning is about meeting students exactly where they are and elevating their interests through a problem-solving approach. The fact is, students ask interesting questions in my classes. And when we explore them together, we take learning to the next level.
For example, one student wanted to know how sleep correlated with success in taking advanced classes. From that, we applied research methods including surveying peers through in-class polling activities and data analysis. Other students have asked questions focused on mental health and isolation after experiencing the pandemic. For that, students shared their personal experiences and analyzed them with both qualitative and quantitative data. These projects were meaningful not only in their content, but in the processes we used to explore them. Most importantly, this approach keeps my students engaged and actively learning.
When given the flexibility and resources we need, teachers have the power to make young people feel better about themselves, and eventually to help them become more confident as they consider what kind of humans they really want to be. My students know in their hearts that I believe in them to my core, and though many of them come from challenging circumstances, I strive to show them how to use their “lived experience” as motivation to build a better life for themselves.
This isn’t an empty mantra for me, and my students wouldn’t buy it for a second if it were. They know it’s authentic because I lived it too. I grew up with a single mom and a dad who was in and out of jail, with addictions he just couldn’t kick. But even though my mom didn’t have a college education or anyone to support her, she gave me everything she could — and more importantly, she believed in me.
I want to give that same gift to my students: a fundamental belief in themselves and the tools to become exactly who they want to be. But teachers like me need more than just basic resources to reach all of our students — we need the freedom to teach a curriculum that we know will resonate with them — because that’s when the magic of learning really happens.
I hope more students are presented with this opportunity to succeed and think about the world through a different lens. Once they put on that lab coat in my classroom to search for their own truth, they will find one that is uniquely and powerfully their own.
•••
Leonard Finch teaches AP Research and AP Language and Composition at Natomas High School in Sacramento.
The opinions expressed in this commentary represent those of the author. EdSource welcomes commentaries representing diverse points of view. If you would like to submit a commentary, please review our guidelines and contact us.