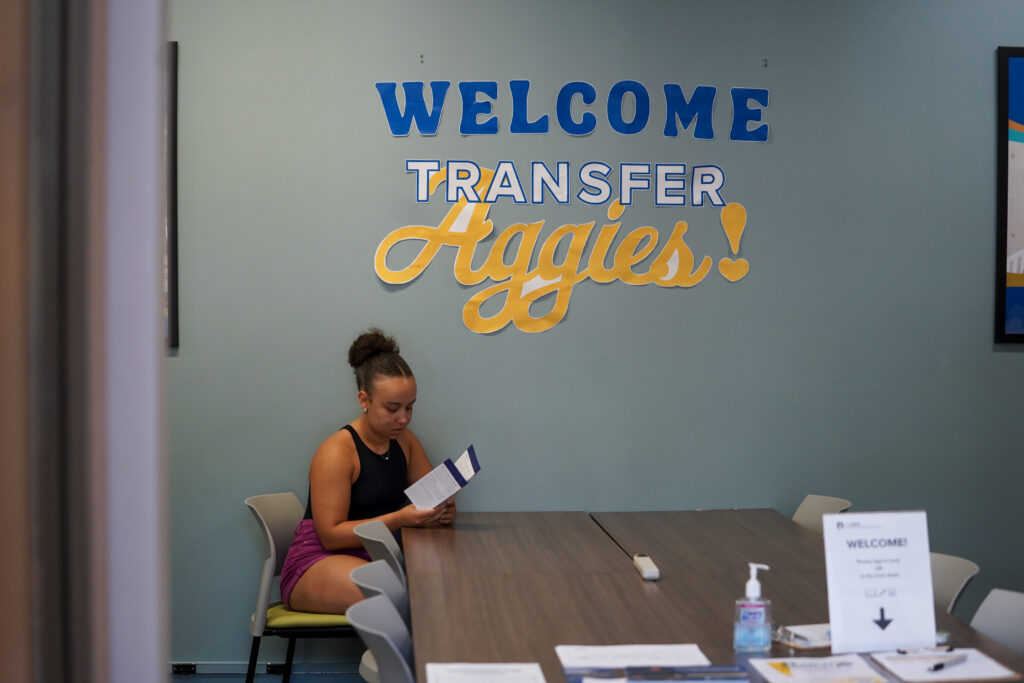
The Transfer and Reentry Center in Dutton Hall at UC Davis helps transfers get acclimated to their new environment.
Credit: Karin Higgins/UC Davis
In an attempt to make it easier for students seeking to transfer to the University of California, the Legislature and Gov. Gavin Newsom are in agreement on the framework for a new pilot transfer program between the community college system and UC, a top lawmaker told EdSource on Monday.
“This is monumental,” Assemblymember Kevin McCarty, D-Sacramento, said in an interview Monday. “This is the biggest transfer bill in over a decade and the first time we’re able to get pretty darn close to having a universal transfer process for all community college students.”
McCarty, the author of the bill, said the legislation was a negotiated compromise between the Senate, Assembly, Newsom’s office and UC. McCarty participated in the talks as chair of the Assembly’s budget subcommittee on education finance.
Rather than immediately creating a systemwide transfer guarantee, the newly proposed pathway would start as a pilot at UCLA in a limited number of majors and then expand to more campuses in limited majors. The bill states that UC must “prioritize admission” to students who complete an associate degree for transfer in the selected majors but does not state they need to guarantee admission to them at their chosen campus. If a student is not admitted to their chosen campus, the student would be redirected and admitted to another campus.
A UC spokesperson confirmed Monday that UC has been in negotiations with lawmakers and Newsom on “compromise legislation” but that UC has not yet taken an official position on the bill.
The bill is expected to get floor votes this week in both the Assembly and the Senate, according to McCarty.
Assembly Bill 1291 would first require that UCLA, beginning in 2026-27, prioritize admission for community college transfer applicants who complete an associate degree for transfer in certain majors. The specific majors have yet to be determined, but UCLA would need to designate at least eight of them. By 2028-29, it would expand to at least 12 majors, with at least four of them in a science, technology, engineering or math field.
By 2028-29, the new transfer pathway would also expand to four additional UC undergraduate campuses that have also yet to be determined. UC would choose those campuses and, like at UCLA, designate at least 12 majors at each campus and prioritize admission for students who complete an associate degree for transfer in those majors. The Legislature then intends to expand the program by 2031 to UC’s remaining four undergraduate campuses.
Earlier this year, McCarty introduced another bill, AB 1749, that would have required UC, beginning in 2025, to admit all eligible students who complete any associate degree for transfer, something the California State University system already does.
But UC opposed that bill, with officials for the system arguing that it would have disadvantaged students in certain majors — especially in STEM fields — because they would have entered UC underprepared for their coursework.
UC has yet to take a position on the latest bill because the university wants to be able to “review final legislative language” and evaluate “any potential last-minute amendments,” said Ryan King, a spokesperson for the system, in a statement to EdSource.
Currently, UC does not have a systemwide transfer guarantee for community college students. There are separate transfer admission guarantees at six of the system’s nine undergraduate campuses — all except UCLA, Berkeley and San Diego. But those separate guarantees each have different requirements for admission. And students who consider transferring to Cal State have to also deal with separate and different requirements for that system.
McCarty said he’s hopeful his bill will be “a game changer” for community college transfers.
“Too often you have to have a doctoral degree to understand how to transfer,” he said. “We don’t have to reinvent the wheel. We have this system that’s been working for the community colleges and CSU, and I’m excited that we’re going to be able to expand this to the UC.”
State lawmakers Wednesday demanded that the University of California system make more space for California residents — particularly at its most competitive campuses — even if it means charging higher tuition to those who come from out of state.
The number of non-resident students has declined at most UC campuses, ticking down from 17.7% to 16.3% systemwide over the past two years. Increasing pressure from the Legislature led the state to create a plan in the Budget Act of 2021 to increase the enrollment of Californians in the UC system over five years. The system has enrolled more in-state residents — but not enough to meet targets set by the state.
Assemblymember David Alvarez, D-San Diego, noted that most UC campuses reject more than half of their applicants, including many highly qualified California residents.
“This is frustrating for a lot of Californians,” Alvarez said during an Assembly budget hearing addressing college enrollment in the state.
Assemblymember Al Muratsuchi, D-Torrance, shared a story from a constituent who said she graduated with a 4.67 GPA, took 12 AP courses and was a varsity captain. She told him she applied as a political science major at four competitive UC campuses and was rejected from all, only to enroll at an out-of-state school.
“What would you tell this student about why she can’t attend the UC campus of her dreams?” Muratsuchi said.
A report from the Legislative Analyst’s Office (LAO) called it “frustrating” that during a time of “tremendous demand,” the UC system fell nearly 1,400 full-time equivalent students short of its target to enroll more in-state students this year, as set by the 2023-24 Budget Act.
Assembly members said they also have concerns about nonresidents increasingly edging out California residents at a few CSU campuses. Nonresidents made up 17% of enrollment at Cal Poly San Luis Obispo and 14.6% at San Diego State in 2022-23.
The LAO report notes that community college enrollment has begun to rebound after a precipitous decline during the pandemic. But its decline has created a domino effect by reducing the number of students transferring to CSU. Enrollment at the University of California has been growing, but it has not kept pace with student interest, as indicated by the rapidly rising number of applications. Unique applications to the UC system increased by 30% from 2013 to 2022.
Looking to the future, the systems — especially the community colleges and CSU — face continuing challenges attracting enough students. The report also noted that the numbers of traditional college age students are expected to decline in the coming years, just as they have in California’s K-12 school system.
Muratsuchi asked whether it might be time to rethink the way funds are allocated, not just between campuses but also between UC and CSU campuses. He pointed to the increased demand at UC campuses and declining interest at many CSU campuses.
The UC system does plan to address demand from California residents in the long term by adding between 23,000 and 33,000 full-time equivalent students by 2030. UC Merced and UC Riverside would account for 30% to 35% of that growth, while UC Berkeley, UCLA and UC San Diego would account for half or more of that growth. The UC system contends that this plan would rely on state funding to pay for an increase in California residents.
Seija Virtanen, associate director of state budget relations for the University of California Office of the President, said the UC system became more reliant on nonresident students to backfill massive budget cuts during the Great Recession of 2008. Each nonresident student pays nearly three times the tuition paid by resident students.
For 2024-25, Californians will pay $14,436 for undergraduate tuition, while nonresidents will pay $48,636.
“If we were to remove those funds, it would be catastrophic for our campuses,” Virtanen said.
Currently, the state is providing the UC system with an additional $31 million each year to support more California residents attending UC campuses, supplanting the funds that nonresidents bring in. Over the last two years, UC has enrolled over 2,600 fewer nonresidents. It has also enrolled nearly 5,900 additional in-state residents, but that is nearly 1,400 students short of the state target.
Alvarez proposed raising tuition for nonresidents to cover this $31 million in annual funds from the state. Using back-of-the-napkin math, Alvarez noted that passing along $31 million in tuition to 20,000 nonresident students would increase their tuition by about $1,500 each year. There are an estimated 36,630 nonresident students in the UC system. Alvarez suggested a follow-up hearing to discuss raising nonresident tuition.
During public comment, UC alumni-regent Keith Ellis agreed that it would be “worthy” to give the plan to raise nonresident tuition serious consideration.
CSU, where most campuses have seen enrollment drop, has room in its budget to add 24,000 full-time students, according to the LAO report. Only four of the 23 campuses — Fullerton, Long Beach, San Diego and San Luis Obispo — have increased their enrollment since fall 2019.
Seven campuses are enrolling at least 20% fewer students than four years ago, including campuses in Sonoma, the Channel Islands, the East Bay, Chico, Humboldt, Bakersfield and San Francisco.
Nathan Evans, deputy vice chancellor for academic and student affairs at CSU, said there is a plan to reallocate resources from campuses that have seen a sustained drop in enrollment to those where there is more demand. He said this reallocation needs to be done over several years.
“We’re not going to pull the rug out from any institution,” he said.
Evans noted that demographic changes in rural areas in Northern California and the Bay Area mean enrollment is not likely to rebound. The number of families with college-age students has been declining in these areas.
Evans said the CSU system is also working on increasing enrollment through partnerships with K-12 districts, marketing and attempting to reengage students who may have stopped out.
This story was updated to more accurately describe the data availability issues. Details.
Public data posted by the California Department of Education has been incomplete, often outdated and occasionally inaccurate, forcing legislators to pass laws based on old data, researchers to delay inquiries and journalists to grapple with inaccurate information.
Californians, living in a state known globally as a center of innovation and technology, have had to cope with a state education agency that has admittedly lacked the staffing and the policies to provide much-needed data, EdSource reporting has found.
As a result, there are gaps in the knowledge needed by lawmakers, researchers, journalists and others to evaluate state programs and policies, from teacher demographics, to how many English learners become fluent in English each year, to how districts have spent a $50 million court settlement to improve early literacy.
Obtaining data from the California Department of Education (CDE) has been difficult, said Christopher Nellum, executive director of The Education Trust-West, one of the state’s most prominent social justice and advocacy organizations. There have been delays in the public release of data and a lack of consistency when it comes to the annual publication of key data sets, he said.
“In an ideal world, we would have a legislature in a state that is making data-informed decisions about legislation, and then making data-informed decisions about assessing the efficacy or impact of investments, or the interventions, and this is difficult in the state of California right now,” Nellum said.
The CDE collects data about student achievement and demographics, enrollment, course information, discipline, graduation rates, staff assignments and other data, much of it mandated by legislation.
Some data have not been updated by the department for as long as five years. The most recent available data for teacher demographics, pupil-teacher ratios, course enrollment, and class size is from 2018-19.
“In an ideal world, we would have a legislature in a state that is making data-informed decisions about legislation, and then making data-informed decisions about assessing the efficacy or impact of investments, or the interventions, and this is difficult in the state of California right now.”
Christopher Nellum
The dashboard that tracks the annual progress of K-12 students on standardized tests, chronic absenteeism, suspensions and graduation was also suspended or only partially updated due to the pandemic-related school closures until Dec. 2023. The Legislature suspended the reporting of state and local indicators on the 2020 and 2021 dashboards and, because the state didn’t have prior-year data to measure growth in 2022, that year’s dashboard was published without the full-color display.
Cindy Kazanis, the director of the Analysis, Measurement and Accountability Reporting Division at CDE, said many of the delays in reporting data have resulted from “not having enough boots on the ground.” The department is in the process of recruiting and hiring 17 new staffers.
New state mandates and changes in the way data is collected also have impacted data collection, Kazanis said. The five-year delay in updating some data is because the department has a backlog of reports and data that must be reconfigured because the state changed course codes in 2018-19, she said.
Legislation based on old data
An EdSource examination of recent state education bills shows that legislative staff have sometimes had to rely on outdated CDE data to complete analysis meant to help legislators make decisions about whether to pass laws.
One example is an analysis of Assembly Bill 2097, which used department data from 2018-19, the most recent year it was available, to show computer science offerings in California high schools, and the number and gender of students enrolled in them. The bill, if passed, will require school districts to offer computer science courses to high school students, who will be required to complete a one-year course before graduating.
An analysis of Assembly Bill 2429 also relied on data from five years ago. The legislation mandates health education courses, required by some districts to graduate, including instruction on the dangers of fentanyl use. The legislation passed on June 13.
“The committee may wish to consider that course-taking data, which is important for policy analysis and evaluation, has not been updated by the CDE since the 2018-19 school year,” stated the analysis. “The CDE reports that this data will be updated in 2024.”
Since 2018, legislators also have required that several new datasets be added to the CDE website, including absenteeism by reason, a stability rate, restraint and seclusion, special education, college-going rates, teacher assignment monitoring outcomes, five-year graduation rates and homeless students by dwelling type, according to the CDE.
Assembly Bill 1340, signed by Gov. Gavin Newsom in October, mandates that the department post test scores, suspensions, rates of absenteeism, and graduate and college-going rates for students with disabilities, disaggregated by federal disability category, on its website.
The analysis of the bill for the Assembly Education Committee was terse. “When this committee is asked to evaluate the effect of a policy on a subset of students with disabilities — for example, students who are visually impaired — it requires data about this subgroup of students’ progress on academic and other measures. Under current CDE practice, a single number for all students with disabilities is shown, obscuring important information about students’ progress, which is needed for evidence-based policymaking and to provide transparent information for the public,” it read. Legislators could not be reached to comment.
Unreliable public information
EdSource journalists working on news stories have struggled in several cases to obtain accurate, up-to-date data from the California Department of Education. This year, EdSource had to twice remove data after publication because the analysis was based on incorrect data that the department had published on its website. In both cases, school district officials notified CDE that they had inadvertently submitted incorrect data to the department, but the agency did not correct the information online.
The timing of data releases has also been an issue. When CDE refused to publicly release state test scores after districts began releasing the information to parents, EdSource enlisted legal help to require CDE to comply with the California Public Records Act.
In September 2022, just months before the election that re-elected Tony Thurmond as state superintendent of public instruction, the CDE refused an EdSource request for Smarter Balanced test scores, saying they would not be released until sometime later in the year. EdSource wrote about the delay and enlisted an attorney to write a letter outlining why the data was public information. Within a week, the department announced the scores would be released in October, before the election. The Legislature subsequently required the department to release test scores annually by Oct. 15.
Nonprofits, schools share data
Because of the difficulty obtaining education data from the state, many nonprofits and collaboratives have started collecting their own data or creating online tools, so the public can more easily access CDE data.
The Education Trust-West, which has campaigned for clear and accessible data through its Data for the People initiative for over a decade, developed a data visualization tool that uses public data on California K-12 and higher education systems. Because much of the data comes from the CDE, information is limited to what the department has made available.
CORE Districts, a collaborative of nine California school districts serving more than a million students, collects data directly from districts for its Insights Dashboard. CORE collects data from its member districts, as well as 124 other school districts and charter schools, so that comparisons can be made. But the effort doesn’t come near reporting on all nearly 1,000 districts.
“We regularly get requests from researchers to look at our data,” said Rick Miller, CORE Districts’ chief executive officer. “Going through the CDE process is so cumbersome.”
Lack of data stymies researchers
Education data that is not being collected or made publicly available recently became the central topic of a gathering of California researchers discussing educator diversity, said Kai Mathews, project director for the California Educator Diversity Project at UCLA.
“What we realized is that some people had some information that’s not publicly available, and it largely depended on past relationships,” Mathews said. “So some data is actually probably collected, it’s just not publicly shared with all of us.”
Mathews and Nellum agree that a lack of updated teacher demographic data is particularly perplexing, given the teacher shortage and the number of workforce issues facing teachers. The Education Trust-West has had to delay some of its work because it hasn’t been able to obtain teacherdata, Nellum said.
“That is bad for students. It’s bad for schools. And, of course, it’s bad for any sort of hope we have of advancing equity,” Nellum said.
EdSource requested updated teacher demographic information from CDE earlier this year for a series of stories on recruiting and retaining Black teachers, an issue Superintendent of Public Instruction Thurmond had called a priority. The data was last updated in 2018-19, despite being submitted to the department annually by school districts. After sending five email requests over a month, the reporter never received the data from the CDE. Instead, the reporter used data from 2020-21, the most recent year available, from the National Center for Education Statistics.
Alix Gallagher, the director of strategic partnerships at Policy Analysis for California Education (PACE), says the lack of data on universal transitional kindergarten makes it unclear whether the state is optimizing the annual investment it is making in the grade. California will spend an estimated $3 billion a year by 2025-26, when universal transitional kindergarten (TK) will be offered to all 4-year-olds, Gallagher wrote in a commentary on the PACE website.
The state should collect data on the features of transitional kindergarten programs and on student outcomes from transitional kindergarten through second grade, to better understand the effectiveness of transitional kindergarten, she wrote.
“Right now there isn’t publicly available data for roughly the first third of a kid’s career in the public schools,” Gallagher told EdSource. “We now have universal access to TK, kindergarten, first, second and third grades. And, at the end of third grade, kids take the SBAC (Smarter Balanced Assessment). And that’s the first time, as a system, we know anything about kids’ learning.”
In fact, this year’s test scores show 57% of third-graders reading below grade level and 55% doing mathematics below grade level.
CDE data division staffing up
An annual $3 million investment from the state will allow CDE to add 17 new employees to improve data reporting to the public, Kazanis said. Twelve of the new employees have been hired. The Analysis, Measurement and Accountability Reporting Division currently has 66 employees.
Some of those resources are headed to CDE as part of the state’s launchof the first phase of its Cradle-to-Career Data System sometime this year. The longitudinal data system will provide tools to help students achieve their goals and deliver information on education and workforce outcomes, according to the website. It may also give researchers the data they are seeking.
“I’m hopeful though, because the Cradle-to-Career data system is working on a teacher dashboard, which I know will have a lot of the data that we have been waiting for,” said Nellum, who also is a member of the Cradle-to-Career (C2C) Advisory Board. Nellum spoke to EdSource for this story as a representative of The Education-Trust West and not as a member of the C2C board.
Eight of the employees will make up the new Data Visualization and Insights Office. It will collect data at the request of state policymakers and the California State Board of Education and work to make publicly available data more user-friendly, Kazanis said.
The state funding includes $300,000 to move the release date of the California School Dashboard data up incrementally each year until the annual release date is Oct. 15. This is expected to happen in 2026. Last year, data which includes test scores, graduation rates and student demographics was released on Dec. 15. Two data teams work on the dashboard full-time all year, Kazanis said.
The influx of new staff is expected to allow the department to revamp DataQuest to make it more user-friendly, Kazanis said. The new teacher reports, for example, will allow the user to make comparisons among districts, she said.
Seven new positions will focus entirely on generating teacher data, Kazanis said.
“We’ve wanted to get out from under this backlog, but part of it was recognizing that we did need more resources, and we need dedicated resources to be focused on teacher data.”
Friday: California launches the Cradle-to-Career data system, a long-awaited project to track student progress
This story has been changed to correct the spelling for Tony Thurmond, California superintendent of public instruction and to reflect that some data sets have not been updated for the past five years, not seven years as originally stated. The paragraph about the California School Dashboard has been updated to make clear that the dashboard was suspended by the Legislature during the Covid pandemic.
Five years ago, Californians thought schools were headed in the right direction; they no longer do.
Most adults say teaching basics should be the No. 1 goal of school; parents of students disagree.
Nearly all in the survey agree that teachers’ pay is too low.
Californians’ confidence in their public schools and approval of how Gov. Gavin Newsom and the Legislature are handling public education have fallen sharply since the Covid pandemic, according to an annual survey on K-12 education released Thursday by the Public Policy Institute of California (PPIC). Half believe that the public school system is headed in the wrong direction.
The PPIC survey of 1,591 adults in English and Spanish also found widespread disagreement and overall concern with President Donald Trump’s actions on schools.
Nearly three-quarters of Californians oppose Trump’s executive order to close the U.S. Department of Education.
Two-thirds of adults are very or somewhat concerned about increased federal immigration efforts against undocumented students, and majorities support their local districts’ self-designation as “safe zones” from immigration enforcement.
Democratic and Republican respondents were sharply divided on this and many issues in the survey, however.
An exception is voters’ agreement with Trump’s executive order to ban transgender participation in sports in schools and colleges. That resonates with 65% of adults and 71% of public school parents. They back requiring transgender athletes to compete on teams matching the sex assigned at birth, not the gender they identify with — a position in sync with Newsom’s, but not with many of the state’s Democratic leaders.
PPIC is a prominent nonpartisan research and public policy organization that explores issues of the environment, politics, economics and education, and regularly surveys Californians on their views. The latest education survey has a margin of error of 3.1 percentage points, meaning that 95 times out of 100, the results will be within 3.1 percentage points of what they would be if all adults in California were interviewed. The survey was administered between March 27 and April 4.
How the state is handling schools
In April 2020, weeks after Covid first emerged, 73% of survey respondents said they approved of how Newsom handled the K-12 system, and 26% disapproved.
Five years later, approval has fallen to 50% while disapproval has risen to 46%. Newsom registered majority support among Black and Asian Americans, and the least support among white people (43%). While 73% of Democrats approve of his performance, only 13% of Republicans and 44% of independents do.
Views of the Legislature’s handling of schools were similar: a high-water mark of 69% approval and 29% disapproval in April 2020, and an even 48%-48% split in April 2025, with 5% saying they didn’t have an opinion.
Mark Baldassare, director of PPIC’s statewide surveys, said the approval numbers of elected officials fluctuate based on “how people feel the system in general is working and if state officials in charge are meeting the moment.”
“I remember a lot of the polling numbers around the country at the beginning of the pandemic were showing there was a rallying around our leaders and maybe a little bit of wishful thinking that we’re going to get through this,” he said.
“It’s hard to blame Newsom and the Legislature. They’ve been very supportive of programs and funding for education,” said Carol Kocivar, past president of the California State PTA and a writer on education policy for ED 100, a parent education website.
“Schools have been through the wringer. Some districts are barely balancing budgets and are facing a teacher shortage and declining enrollment. All of these factors create perceptions of schools. Behavior problems and inability to pay attention from an addiction to social media don’t necessarily reflect what is happening in schools,” she said.
In past PPIC surveys, particularly after the Great Recession, when per-student funding in California was among the lowest in the nation, the public’s view was even lower. In 2015, only 35% of respondents approved of how the Legislature was handling education. When asked the same question in 2011, amid huge post-recession budget cuts, the approval rate was only 18%.
Similarly, in response to the question, “How much of a problem is the quality of education in K-12 schools today?” 35% of all respondents say it is a big problem in the latest survey. That’s down from 27% in April 2020, but lower than each of the previous 18 years. In both 2012 and 2016, for example, 58% of all respondents said that education quality was a problem, and in 2000, 53%.
Right or wrong direction?
In the latest survey, 45% of all adults say that the school system overall is generally going in the right direction, while 51% say it’s headed in the wrong direction. There is a partisan divide, with 65% of Democrats saying it’s in the right direction and only 16% of Republicans and 38% of independents agreeing.
That answer, too, is down from April 2020, when 62% of all respondents said the school system was going in the right direction and only 30% said it was headed in the wrong direction.
Asked to grade the quality of their local public schools from A to F, 12% of respondents assigned an A; 36% graded B; 33% graded C; 11% graded D, and 6% an F.
That’s down from the 20% who gave schools an A in 2018, the last time the question was asked.
Challenges facing schools
In the latest survey, respondents indicated that the challenges to schools — chronic absenteeism and declining enrollment, along with threats of wildfires and school shootings, a perennial worry — remain top of mind.
A majority of adults (55%) and almost half of public school parents (47%) are very concerned or somewhat concerned about chronic absenteeism (defined as a student’s absence on 10% or more of school days). More Black (32%) and Hispanic (24%) adults than whites and Asians (both 14%) say they are very concerned about the problem.
Since school funding is tied to attendance, more public school parents (68%) say they are very or somewhat concerned than all adults (61%) surveyed that declining enrollment would affect funding for their local public schools.
Source: PPIC Statewide Survey 2025
School financing
Asked about the current level of state funding in the latest survey, 48% say it is not enough, 34% say just enough, and 13% more than enough. Perhaps reflecting the huge one-time state and federal Covid relief aid, that number is down significantly since 2012 and in 2000, when 63% said funding was not enough.
At the same time, nearly all Californians say that the level of pay for teachers relative to living costs is either a big problem (38%) or somewhat of a problem (48%).
Vouchers: In 2002, California voters resoundingly rejected a ballot initiative to provide parents with state funding to send their children to a public or private school of their choice by a vote of 70% to 30%. The latest PPIC survey indicated 44% of likely voters favor a school voucher system, and 56% oppose it. However, 62% of public school parents, Black and Hispanic respondents, now say they too favor it.
Supporters of an alternative voucher plan to place an initiative for an education savings account on the statewide ballot in 2026.
School priorities: Asked what they think should be the most important goal of K-12 education, the top three priorities of all respondents are:
Teaching students the basics including math, reading, and writing, 40%’
Teaching students life skills (21%)
Preparing students for college (16%)
In contrast, Hispanic Californians (27%) and public school parents (32%) say preparing students for college should be the top goal.
LCFF: In 2012, the Legislature passed the Local Control Funding Formula, which provides additional money to school districts with more English learners and low-income students. Each year, read a short summary of the formula, large majorities surveyed say they favor it (this year 66% of all respondents).
And yet each year, between 68% and 80% of respondents say they knew nothing at all about the landmark law, including this year 75% of all respondents and 67% of public school parents.
School districts are required to reach out to parents for their ideas on how to spend the funding. This year, two-thirds of all parents of school-age children – those with a college degree and those without, those earning more than $80,000 per year and those earning less – said their districts had failed to do so.