برچسب: grade

  • The solution to California’s literacy problem needs to go beyond third grade

    The solution to California’s literacy problem needs to go beyond third grade


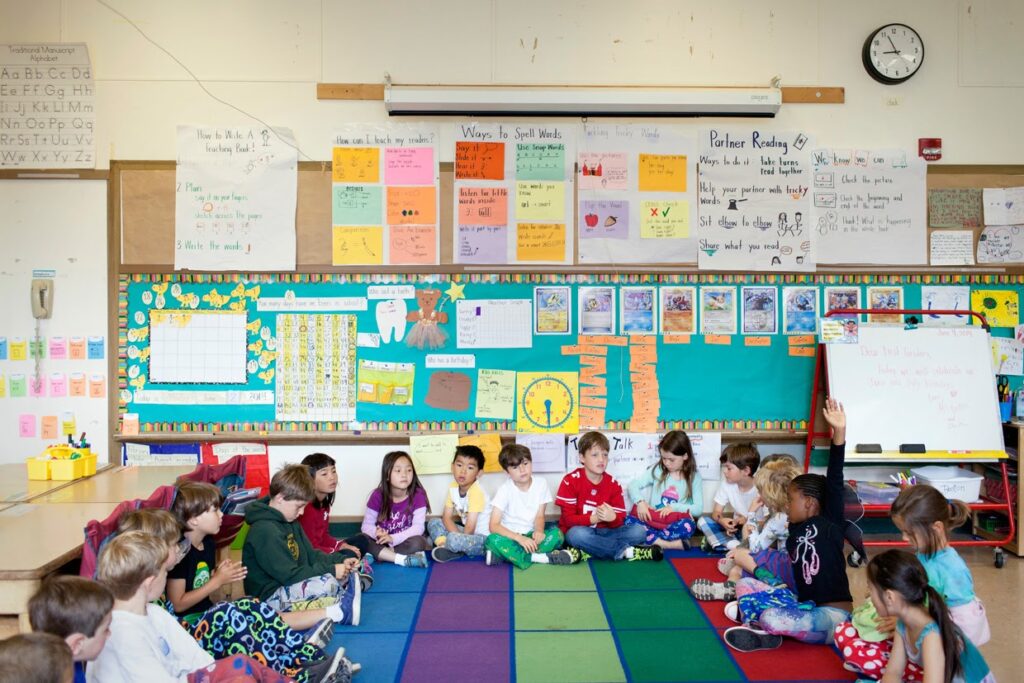
    Credit: Allison Shelley for American Education

    Third grade students in California’s lowest performing schools are doing better at reading, thanks to the Elementary Literacy Support Block Grant funding and a new focus on curriculum materials based on the science of reading.

    That funding focused on improving education for students primarily in the youngest classrooms (K-2), with a stated goal of having all students reading by third grade.

    While many California districts that received grants have been praised for providing student support such as tutoring or after-school programming, they are still focused on K-3. None of them have developed a comprehensive plan to address illiteracy among the older grades.

    The most recent National Assessment for Educational Progress (NAEP) stated that 68% of fourth graders lack key literacy skills. In California, the latest assessment of student performance shows fewer than half of eighth graders are proficient in English language arts. Many of these tweens and teens still have reading skills between a first and fourth grade level.

    With literacy instruction traditionally focused in elementary school, middle and high school teachers are unequipped to support more than half of the students in their class who don’t yet have the literacy skills to access grade level text. The core problem is twofold: Educators are not trained to teach structured literacy in secondary school, and they do not have the right content for their older students reading far below grade level.

    As one eighth grade teacher said, “I came here expecting to teach literature, but I soon realized I had to learn how to teach literacy first.”

    Today’s middle and high school curricula assume that students beyond the fourth grade no longer need to learn how to read — instead, they should be able to read to learn. The reality is that many cannot.

    Without the phonics and fluency skills, or background knowledge to make meaning from text, how can students analyze things like the author’s purpose and point of view, or use primary sources to write historical essays, or lab reports?

    Students who struggle with reading end up falling behind across all subjects — from social studies to science to math — contributing to increased dropout rates.

    The second problem is a deep lack of age-appropriate “learn-to-read” books for tweens and teens.

    We cannot support and empower adolescent readers when their only choices for practice are stories like Dr. Seuss’s “Hop on Pop.” While these books are on their reading level, they are misaligned entirely with their interests. The content is boring and juvenile, even embarrassing, to a sixth or 10th grader, and the characters are not representative of students’ range of diverse backgrounds and identities. As a result, these students become disengaged and often stop reading altogether. For effective literacy instruction, we need to provide students with engaging opportunities for meaningful practice.

    So how do we extend literacy instruction beyond the third grade, systematically? 

    1. Equip teachers in higher grades with the skills and knowledge to support literacy growth. With additional training on literacy instruction, and access to resources to empower student reading practice, we can equip today’s middle and high school ELA teachers with the tools they need to drive growth for students, beginning wherever they are.
    2. Rethink the choices students have for reading practice. Until just a few months ago, there were no suitable or effective “learn-to-read” books written for older students. As more age-appropriate content becomes available, we need to create a new shelf in the library filled with books that are culturally inclusive, intriguing and accessible for students at any intersection of age and reading level.

    We can transform literacy and access if we apply the science of reading in a relevant way to older students. They can catch up, but to help them do so, we must meet them where they are: reengaging reluctant readers with texts they can read and want to read — books that reflect their identities and experiences — and help them discover the joy of reading.

    Instead of holding students back in grade three, as some districts have proposed, let’s think about how to propel them forward, starting wherever they are.

    ●●●

    Louise Baigelman is a former literacy teacher and CEO of Storyshares, a literacy organization dedicated to inspiring a love of reading across the globe.

    The opinions in this commentary are those of the author. If you would like to submit a commentary, please review our guidelines and contact us.


    Source link

  • John Thompson: “Proficiency” Is NOT Grade Level, Not Even in Oklahoma

    John Thompson: “Proficiency” Is NOT Grade Level, Not Even in Oklahoma


    Oklahoma’s State Superintendent, Ryan Walters, changed last years’ testing cut scores, redefining the term “proficient” in the state’s accountability data. Fortunately, there has been a bipartisan backlash against Walters’ lack of transparency when making the change, which looked like an effort to trick Oklahomans into believing that he had improved student outcomes.

    But, this month, the Oklahoma Commission for Educational Quality and Accountability brought back a misleading, inappropriate, and destructive definition of the term proficiency for accountability purposes.

    In doing so, the Commission revitalized the use of one of the most effective weapons for privatizing public education. They perpetuated the lie that “proficiency” is “grade level,” thus making it sound like public schools are irrevocably broken. 

    We need to remember the history of this propaganda which took off during the Reagan Administration, which misused data in its “A Nation at Risk” to push high-stakes testing.

    The National Assessment of Educational Progress (NAEP) scores are the best estimate of students’ outcomes, but they should be used for diagnostic, not accountability purposes.   But, as the Tulsa World reported, in 2011, Jeb Bush’s Foundation for Excellence in Education (FEE) high-jacked NAEP’s terminology when writing and editing then State Superintendent Janice Barresi’s new accountability-driven A-F school report card. The World presented evidence that the FEE was engaged in a “pay-to-play” scheme to reap profits while influencing policy.

    As The Washington Post reported in 2013, FEE was at the nexus of rightwing political influence in K-12 education and corporate interests seeking to profit from the nation’s schools. It claimed that raising “expectations” for students would advance their learning. In fact, NAEP scores provide evidence that starting in 2012 , when corporate reforms were in place, the opposite happened, as NAEP scores declined, reversing decades of incremental growth.

    It did, however, advance the privatization of public education.

    At the 2024 Oklahoma conferenceBush’s new think tank, ExcelinEd used misleading and misconstrued data from the National Assessment of Educational Progress (NAEP), to conflate NAEP “proficiency” with “grade level.”

    In fact, as Oklahoma Watch’s Jennifer Palmer explained, Oklahoma’s 8th grade reading proficiency grade requires that “students demonstrate mastery over even the most challenging grade-level content and are ready for the next grade, course or level of education.” That definition of mastery of grade level skills included critical thinking, interpretation, evaluation, analysis, and synthesis when reading across multiple texts, and writing.

    But, Palmer noted, “8th graders who didn’t score proficient, but are in the ‘basic’ category, can still do all this.”

    Moreover, as Jan Resseger further explained, the nation’s NAEP proficiency grade “represents A level work, at worst an A-.” She asks, “Would you be upset to learn that “only” 40% of 8th graders are at an A level in math and “only” 1/3rd scored an A in reading?”

    Resseger also cited the huge body of research explaining why School Report Cards aren’t a reliable tool for measuring school effectiveness.

    We need a better understanding how and why the word “proficiency” has been weaponized against schools. To do so, we must master the huge body of research which explains why standardized tests aren’t fair, reliable, or valid measures of how well schools are performing.

    In 2013, after surveying national experts about “misnaepery,” Education Week explained that NAEP “is widely viewed as the most accurate and reliable yardstick of U.S. students’ academic knowledge … But when it comes to many of the ways the exam’s data are used, researchers have gotten used to gritting their teeth.”

    Also in 2013, James Heckman, a Nobel Prize laureate who lived in Oklahoma City as a child, warned of the dangers of misusing test data. In 2025, Heckman and his co-author, Alison Baulos, published “Instead of Panicking over Test Scores, Let’s Rethink How We Measure Learning and Student Success.” They urge us to “pause some tests and redirect resources toward more meaningful ways to promote and assess student learning.”

    They don’t oppose the use of tests as one measure when used for diagnostic purposes; those metrics “may be valuable for tracking large-scale trends — such as monitoring recovery from the COVID-19 pandemic.” However, “the current overreliance on tests is costly in many ways and is not an effective strategy for improving education as a whole.” And, “standardized tests often conceal more than they reveal.” 

    Getting back to recent headlines, I appreciate the press’ reporting on Ryan Walters’ lack of transparency. I’m even more impressed with their reporting on the lack of evidence to support his claims that his administration has improved outcomes. But they now need to report on the reasons why the Commission made a terrible mistake, apparently based on the alt facts generated by corporate reformers’ false public relations spin.


    Source link

  • There’s a more equitable way to grade; districts should invest in it

    There’s a more equitable way to grade; districts should invest in it


    Credit: Allison Shelley / EDUimage

    Grading in most classrooms remains tied to rubrics devised by individual teachers and rooted in century-old practices. Recently, amid a broader national trend, grading systems in schools have come under increased scrutiny as educators and policymakers debate the best ways to support students. This movement further gained traction during the Covid-19 pandemic as educators tried new grading approaches to help students.

    Traditional grading systems assess students through tests, homework and projects combined into a single class grade and other more subjective factors, such as behavior, attendance and classroom participation.

    Standards-based grading, however, measures academic achievement without considering these subjective metrics. Standards-based grading measures academic achievement against specific content standards, offering students multiple opportunities to demonstrate knowledge. It still involves assigning grades, but these grades are based on students’ mastery of the content, making the process more transparent and individualized.

    For example, when a friend of mine was in a math class that used standards-based grading, he was assessed on specific learning targets, like solving quadratic equations, without considering participation or behavior. In a traditional grading system, his final grade comprises quizzes, tests, homework, participation and behavior. As such, a poor test score early in the semester could significantly impact his final grade. On the other hand, in standards-based grading, he had multiple opportunities to retake tests and demonstrate improved understanding, so his final grade reflected his highest mastery level. Traditional grading boosted his grade with attendance and participation points, even if he didn’t fully understand the material. Standards-based grading showed his actual academic achievement.

    While there isn’t any national data, individual states across the U.S. have begun to adopt standards-based grading. A 2021 statewide survey in Wyoming revealed that over 63% of middle schools and 35% of high schools had either started or fully implemented standards-based grading. In Delaware and Mississippi, schools have actively worked to support the use of high-quality, standards-aligned instructional materials in K-12 classrooms​​.

    Districts in California, including Lindsay Unified District in Tulare County, moved towards standards-based grading systems. High schools in Oakland are also transitioning to a more objective assessment system, emphasizing a gradual and inclusive approach to grading reform. 

    In my district, Dublin Unified, individual teachers instituted standards-based grading on a trial basis, but nine months ago, the district discontinued its standards-based grading system, impacting almost 13,000 students.

    However, despite an overwhelming 85% of the student body voting in favor of standards-based grading practices, the school board discontinued the practice districtwide, preventing teachers from using any form of standards-based grading.

    The rationale behind the board’s decision was simple: Trustees believed that standards-based grading decreased academic rigor and harmed students’ chances of success beyond high school by introducing a new grading system. Their concerns, primarily driven by parental pressure, focused on how the grades of high-performing students could fluctuate because of the introduction of a new grading system. 

    I acknowledge that standards-based grading was a new concept and could pose a risk to the perception of the academic achievement of high school students. (I was sympathetic, too; I am all too familiar with the competitive nature of high school.)

    But I think the concerns about standards-based grading hindering academic progress are misguided. For traditionally high-performing students, this grading system allows these students, like all others, to focus on mastering concepts and skills. Instead of promoting memorization to pass tests, students are assessed on their ability to understand concepts, allowing the performance of these students to remain strong even under this new system. If anything, standards-based grading boosts academic performance, evidenced by a study that found that students in schools using standards-based grading were nearly twice as likely to score proficient on state assessments compared with those in traditional grading systems.

    Our district’s push to switch to a standards-based grading system ultimately collapsed through misinformation and a lack of teacher training. This perceived lack of support made teachers feel they had to choose between supporting individual student needs and maintaining academic rigor, even though that wasn’t necessary.

    Had our district provided more support for parents and teachers, we could have developed effective curriculums that help students and maintain rigor. Larkspur’s multi-year transparent process with teacher training and parent seminars allowed a smooth transition from traditional to standards-based grading. Similarly, in New York City, districts successfully shifted to the new system after training teachers and having town halls with parents.

    The transition to standards-based grading or similar systems requires a shift in grading practices and a cultural and perceptual shift in how we view education and student success. It demands robust teacher training, practical communication with parents and students, and a collective commitment to redefining academic achievement. We must provide teachers, students,and parents with the necessary resources to succeed in these new grading paradigms. If we truly want to make education more equitable, districts must put their money where their mouths are and fully support our educators in this significant shift.

    I hope the adults responsible for decisions regarding our schools and education can set aside partisanship and genuinely reassess grading practices. Because equity has never been, nor will it ever be, the enemy of achievement.

    •••

    Aakrisht Mehra just completed his junior year in the Dublin Unified School District.

    The opinions expressed in this commentary represent those of the author. EdSource welcomes commentaries representing diverse points of view. If you would like to submit a commentary, please review our guidelines and contact us.


    Source link

  • California School Dashboard lacks pandemic focus, earns a D grade in report

    California School Dashboard lacks pandemic focus, earns a D grade in report


    Credit: Alison Yin / EdSource

    National surveys have determined that parents significantly understate how far behind children are academically because of pandemic learning setbacks. The A’s and B’s  that their kids have been getting on their report cards don’t tell the full story, concluded a survey of 2,000 parents .

    “To hear parents tell it, the pandemic’s effects on education were transitory. Are they right to be so sanguine? The latest evidence suggests otherwise,” wrote education professors Sean Reardon of Stanford and Tom Kane of Harvard.

    States’ websites that annually report the scores on standardized tests and other valuable data, like chronic absenteeism, could provide a reality check by clearly and easily displaying performance results over time. However, the California School Dashboard, the public’s primary source for school and district performance data, has failed to do that. The Center on Reinventing Public Education concluded this in the report State Secrets: How Transparent Are State School Report Cards About the Effects of COVID? issued Thursday. California was one of eight states to receive a D grade on an A-F scale, behind the 29 states that did better, including 16 states with an A or B.  

    The report focused on how states handled longitudinal data — showing changes in results over multiple years — from pre-Covid 2018-19 or earlier to now. In most states, that multiyear look would show a sharp drop on the first testing after the pandemic, followed by a slow recovery that has not made up for lost ground. For California, the decline in 2021-22, following two years of suspended testing, wiped out gradual gains since the first dashboard in 2014-15.

    “The (California) dashboard makes it hard to identify longitudinal results,” said Morgan Polikoff, professor of education at the USC Rossier School of Education and the lead author of the report. “Because the dashboard never puts yearly data next to each other; you have to pull up multiple years, download the data, and put the data in Excel or something like that if you want to look at longitudinal trends.”

    By contrast, one of seven states to receive an A, Connecticut shows five years of results in bar charts and line graphs for 11 measures.

    Connecticut’s dashboard, praised in the report, shows changes over time for multiple performance measures.
    Source: Connecticut’s Next Generation Accountability Report

    “If we had rated states on something else (e.g., how clearly they presented data for the given year), we would have arrived at different ratings,” the report said.

    Researchers examined longitudinal data for seven metrics: achievement levels in English language arts, math, science and social studies, achievement growth in English language arts and math, chronic absenteeism, high school graduation rates and English learner proficiency and growth. Teams of evaluators from the center, which is based at Arizona State University, used a point system for each metric based on whether it was easy, somewhat difficult, much too difficult or impossible to find longitudinal data.

    “It’s not about having the data — it’s about presenting the data to the public in a way that’s usable,” Polikoff said of California’s dashboard.

    California collects the data for five of the seven metrics. It no longer administers a statewide social studies test. It also doesn’t compile achievement growth using students’ specific scores over time, although the state has been considering this approach for more than six years. Instead, it compares scores of this year’s students with different students’ scores in the same grade a year earlier.  

    Some other states also don’t give a social studies test; California could still have gotten an A grade without it, Polikoff said.

    The California Department of Education said that the dashboard undergoes an annual review for refinements to make sure it is “genuinely accessible and useful to our families.”

    “We always remain open to the feedback and needs of our families, and we look forward to understanding more about the approach taken by the Center for Reinventing Public Education,” Liz Sanders, director of communications for the department, said in a statement.

    She added that School Accountability Report Cards and DataQuest supplement the dashboard and can readily answer questions raised by the Center for Reinventing Public Education. “The dashboard serves a specific purpose to help California’s families understand year-over-year progress at their students’ schools, and the user interface is simplified based on feedback from diverse and representative focus groups of California families,” Sanders said.

    Not a priority

    At the direction of the State School Board, the California Department of Education chose to focus on disparities in achievement as its top priority for the dashboard. For every school and district, it has made it easy to see how 13 student groups, including low-income students, students with disabilities, English learners, and various racial and ethnic groups performed on multiple measures.  

    The state developed a rating system using five colors (blue marking the highest performance and red the lowest). Each color reflects the result for the current year combined with the growth or decline from the previous year. The colors send a signal of progress or concern. 

    However, without reporting longitudinal results for context, the color coding can prove problematic. The statewide chronic absence rate in 2022 was a record high of 30%. Declining 5.7 percentage points in 2023 to 24.3% earned a middle color, yellow signifying neither good nor bad. Yet the chronic absence rate was still at an alarmingly high level. Viewers would have to look closely at the numerical components behind the color to understand that.

    No ability to compare schools and districts

    Unlike some other states’ dashboards, the California School Dashboard also does not permit comparisons of schools and districts. That was by design. Reflecting the view of former Gov. Jerry Brown, the state board focused on districts’ self-improvement and discouraged facile comparisons that didn’t consider the data behind the colors. 

    However, both EdSource’s annual alternative dashboard and Ed-Data, a data partnership of the California Department of Education, EdSource, and the Fiscal Crisis and Management Assistance Team/California School Information Services, encourage multi-school and district comparisons.

    Ed-Data has a five-year comparison of test scores and other metrics. Although this year it no longer starts with 2018-19, the pre-Covid base year for comparisons, viewers can use the year slider above the charts to view data for earlier years.

    EdSource has created graphics showing longitudinal statewide results in math and English language arts, including breakouts for student groups, dating to the first year of the Smarter Balanced testing.

    “If California had reported all of the outcomes in a format like that, it would’ve gotten an A because that’s exactly the kind of comparison we are looking for,” Polikoff said.

    The report separately analyzed the usability of states’ dashboards to determine whether they are easy to use and well-organized. California is one of 16 states rated “fair,” with 23 states rated “great” or “good,” and 11 states, mainly small states like Vermont, but also Texas and New York, rated “poor.”

    “We were struck by how difficult it was to navigate some state report card websites,” the report said. “We found many common pitfalls, ranging from the relatively mundane to the massive and structural.”

    Kansas, for example, lacked a landing page with overall performance data, while Texas school report cards “offer a wealth of data broken down by every student group imaginable” in massive data tables but no visualizations.

    The five states with “great” usability are Illinois, Indiana, Oklahoma, Idaho and New Mexico, the last two of which got an F for longitudinal data.

    “California’s dashboard is far from the worst out there,” said Polikoff. “The reality is little tweaks are not going to cut it. That probably means a pretty substantial overhaul to be usable for longitudinal comparisons. Now, the state might say, ‘We don’t care about longitudinal trends’ and that’s their prerogative, but what purpose is the dashboard trying to serve, and who’s it trying to serve?”

    Answer those questions, he continued, “and then design the dashboard accordingly.”


    Source link