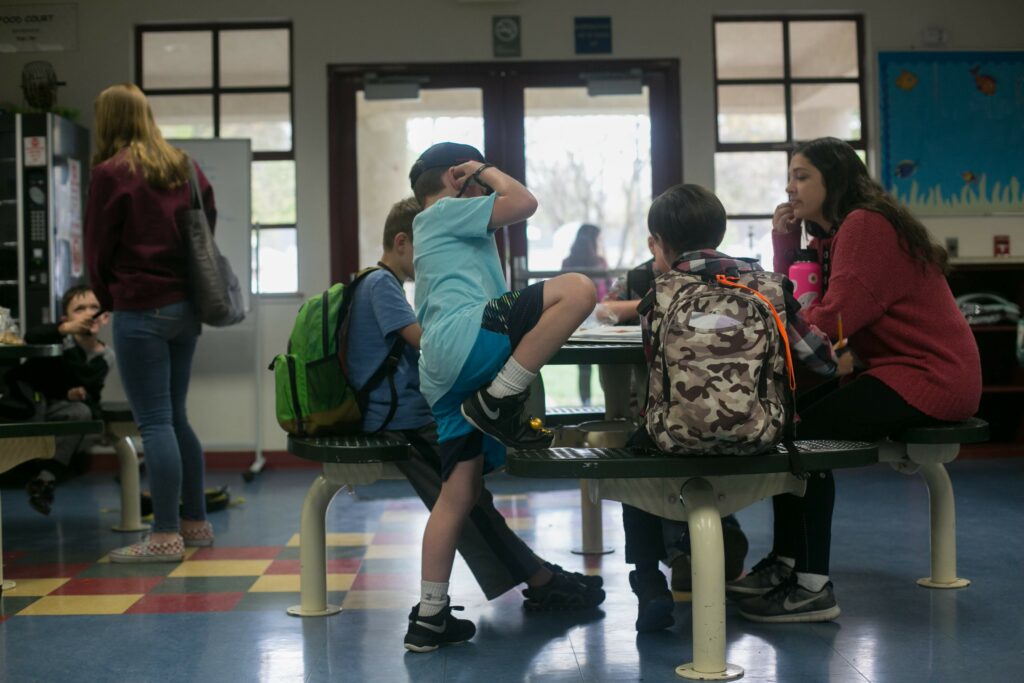
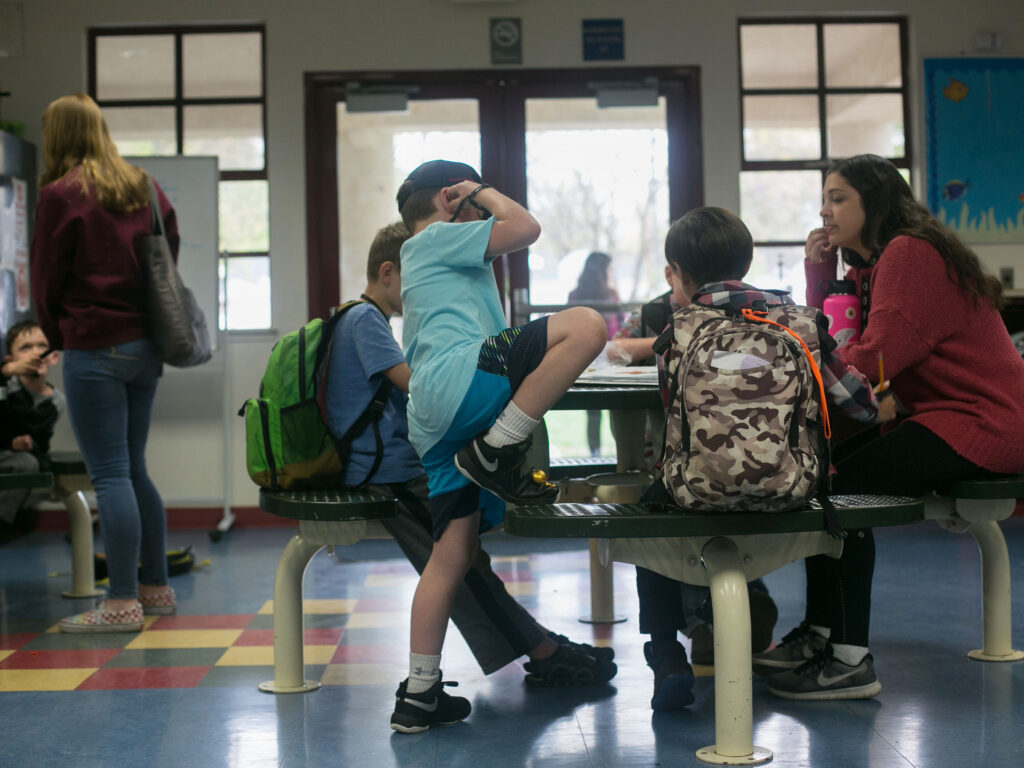
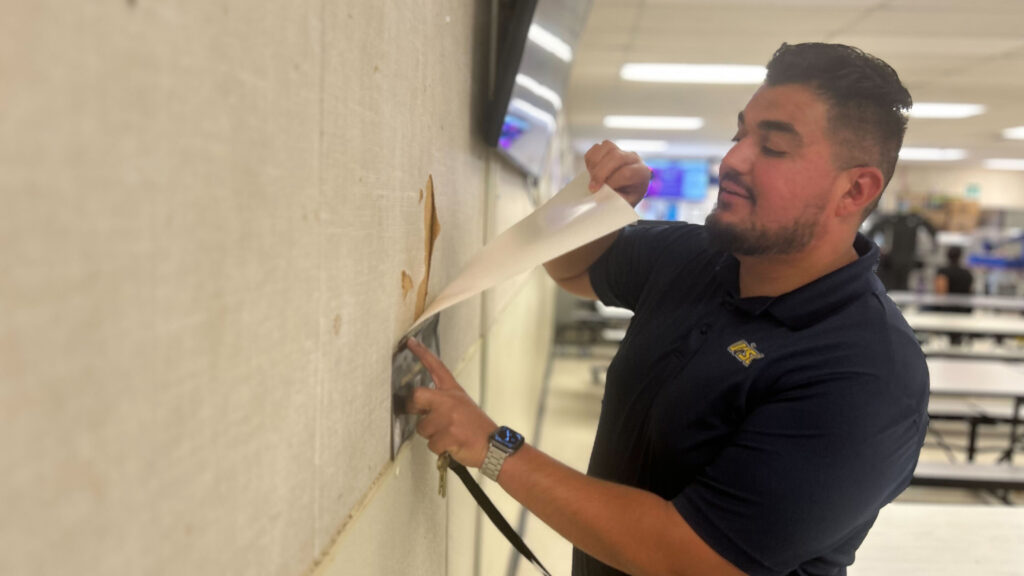
Marshall Elementary Principal Jorge Estrada Valencia purposely placed posters over areas of the cafeteria where the wall is beginning to tear. A multipurpose room that serves as the cafeteria and a meeting space will be one of the school’s and Modesto Elementary School District’s priorities if a $85 million local bond passes this November.
Credit: Lasherica Thornton / EdSource
The story has been updated with information on Central Unified School District.
In Fresno Unified, the state’s third-largest school district with 71,000 students, the watchword for repairing schools is “worst, first.”
Two-thirds of the 103 schools are more than 50 years old, and with age comes burst pipes, air conditioning on the fritz and other demands. Add a commitment to property owners in this largely low-income community to stabilize property taxes, and the result is tough decisions and compromises.
Its neighbor Central Unified faces similar challenges to address the needs of aging buildings with limited resources.
A small tax base per student limits the taxing capacity in many Central Valley communities. Modesto City Schools has been patiently addressing cramped quarters in its elementary schools one bond at a time. Eventually, every school will have a multipurpose room serving as a spacious cafeteria and auditorium so that every school can do assemblies. Measure X, if it passes, will mark another milestone toward that goal.
In California, the list of school buildings needing attention is long and growing. This year, a record 252 school districts are seeking $40 billion worth of renovation and new construction projects, including classrooms for the youngest students, transitional kindergartners, and space for “maker labs” and innovative career explorations for high schoolers.
Many of the districts are hoping to seek financial help from Proposition 2, a $10 billion state construction bond for TK-12 and community colleges that the Legislature also has put on the Nov. 5 statewide ballot. Passage would begin to replenish state assistance, which has run dry from the $9 billion bond passed in 2016, and create a new list of projects eligible for state help in the future.
Fresno and Central Unified worry that property-wealthy districts, which can raise more taxes and can qualify for more matching state funding, will leave them behind in the competition for Proposition 2 dollars.
This report is the last of a two-day look at a sampling of districts from different parts of the state that are asking their voters to pass local bonds. On Monday, we visited San Juan Unified and Wasco Union High School District. Now we learn about Modesto City Schools, Fresno Unified and Central Unified.
Fresno Unified is chasing a $2.5 billion need with $500 million
In the Central San Joaquin Valley, where dangerously high temperatures and scorching heat reign for much of the year, Fresno Unified schools lack proper infrastructure and ventilation systems to keep students cool.
Fresno Unified
- Fresno County
- 71,477 students
- 88% low-income, foster and English learner students
- $9,058 bonding capacity per student*
* Bonding capacity per student is the maximum amount of general obligation bonds a school district can issue at a given time; a district can never go over the ceiling. For unified school districts, it is 2.5% of total assessed valuation; the median in California is $25,569.
Fresno High School leaves open the doors of its oldest buildings, constructed in 1920, as well as the “newer” buildings, built in the ’50s, to increase air circulation and reduce the heat caused by inadequate or non-functioning air conditioning, students said during a tour of the campus.
More than 67% of the district’s 103 schools were built before 1970, making them 50 years old and older. Antiquated buildings mean outdated HVAC (heating, ventilation, air conditioning), water and sewer systems.
Some Edison High School buildings have modern AC units, but that doesn’t hide the fact that the buildings themselves need to be replaced, according to Alex Belanger, the district’s chief executive of operational services. No matter the condition of the AC, the children inside the old, poorly insulated buildings will feel the heat from outside.
“Things like that need to be replaced, and we have it all in the district,” Belanger said.
So far, the district has utilized $196 million in federal pandemic relief funding, plus other grants, to replace HVAC systems; still, the district is left with at least $470 million worth of replacements. And that’s just HVAC needs. Some heating and cooling systems operating in old buildings can’t be replaced unless the entire building is replaced.
-

In Fresno Unified’s decades-old schools are outdated locker rooms that lack adequate plumbing and often result in mold.Credit: Courtesy of Fresno Unified
-

Across the school district, leaking water lines are another issue that must be addressed as over 67% of the district’s schools were built before 1970.Credit: Courtesy of Fresno Unified
-

Even though Fresno Unified has replaced air conditioning in some schools, such as the cooler pictured, there are still hundreds of millions of dollars needed to address outdated AC systems.Credit: Courtesy of Fresno Unified
-

Many Fresno Unified schools have portables that need to be replaced due to their condition or their age.Credit: Courtesy of Fresno Unified
-

Fresno Unified operates around 1,100 portables across the district, many of which are outdated and/or in need of repairs or replacement. Within the last year, the district has used local, state or federal funding to address issues such as portables with rotted flooring.Credit: Courtesy of Fresno Unified
In all, across 8 million square feet of buildings, Fresno Unified has identified $2.5 billion in unmet facilities needs, a need that keeps growing, Belanger said.
“By the time you fix something, something else is breaking, and it’s an ongoing thing,” he said about the need to repair old schools and upgrade facilities over time.
Measure H, a $500 million bond on the Nov. 5 ballot for the state’s third-largest school district, would fix HVAC, water, sewer and fire/safety systems, remove lead paint and asbestos and replace leaky roofs in old buildings; replace outdated portables with new classrooms or facilities; and modernize classrooms and libraries, among other priorities.
School construction and repairs are paid for with bonds funded by property taxes. Aware that 88% of students are from low-income families, district officials say they will limit the size of the bond and spread out issuing them to minimize the increase in taxes. The $500 million bond, the largest the district has ever pursued, will increase taxes by $25 per $100,o00 of a home’s assessed value annually, upping the tax rate to $238.86.
“We are going after what we feel like is responsible to both the taxpayer as well as being able to address some of the highest need areas in the district,” said Paul Idsvoog, chief operations officer with operational services.
Contingent upon board approval, the district plans to address the “worse first” who are “relying on funding,” starting with eight schools identified as “unsatisfactory” in a districtwide facilities assessment. Schools with poor conditions would follow before they lapse into the unsatisfactory category.
But even $500 million couldn’t repair everything that each school needs.
“We have a $2.5 billion need, and we’re chasing it with only $500 million,” Idsvoog said.
If Fresno residents pass Measure H this November, the school system may qualify for matching funds from the state.
“We’ll try to do that to leverage and be able to maximize the dollars because of our need,” he said.
For example, $15.9 million could replace the worst, but not all, classroom buildings at Norseman Elementary, an unsatisfactory site.
Bullard Talent, a K-8 school, classified as having poor conditions, has, since 2010, been recommended for improvements in areas such as its fire alarm and safety systems, but because there have been other schools with even greater needs, the district has focused its funding elsewhere — something the district must do often.
The district, for instance, has had to choose between updating campuses that are so outdated they don’t meet accessibility requirements for students and staff with disabilities and replacing pipes that were about to burst, Belanger said.
“You say, ‘Do I make the door wider?’ or ‘I have the sewer blowing up. What do I do?’” he said. “I fix the pipe.”
Regardless of whatever funding the district receives, it won’t have the same buying power as previous bond measures due to pandemic-induced inflation, district officials emphasized.
Plus, more than 90% of the district’s nearly 1,100 portables have surpassed the expected lifespan of at least 20 years, and 2% of portables are older than 60 years, The Fresno Bee reported.
A key district goal is to ensure that every classroom experience is the same across Fresno Unified. To achieve that, the district must modernize classrooms and expand meeting and learning spaces to address overcrowding. Belanger said that Proposition 2 funds could “help … us get to that point.”
Not just the worst schools need modernization. “Because of deferred maintenance,” Idsvoog said, “most likely every school will probably get touched in some way, shape or form. It just won’t be equal values across those schools.
“This still isn’t going to address the need. There’s more than enough need than there is money.”
Some Modesto City schools are left to wonder when it will be their turn for facilities funding
District leaders and staff in Modesto City schools often relish the fact that its campuses, built 50 to 90 years ago, are decades old, full of history, and located in established neighborhoods.
Modesto Elementary School District
- Stanislaus County
- 15, 267 students
- 86% low-income, foster and English learner students
- $10,840 bonding capacity per student*
* Bonding capacity per student is the maximum amount of general obligation bonds a school district can issue at any given time; a district can never go over the ceiling. For elementary school districts it is 1.25% of total assessed valuation; the median in California is $8,541 per student.
But old schools mean outdated structures that no longer meet students’ needs. Modesto elementary schools such as Enslen and Marshall have old cafeterias that are not large enough to accommodate multiple groups of students at the same time.
None of the nearly 400 students in the 95-year-old Enslen Elementary, except those in transitional kindergarten and kindergarten, eat in the small cafeteria because space would be too tight, principal Melody Webb said. The school uses its outdoor seating even during the colder winter or blistering hot summer months.
And Marshall Elementary runs seven lunch periods throughout the day, a non-stop process, principal Jorge Estrada Valencia said.
“Move ‘em in, move ‘em out,” district spokesperson Sharokina Shams said about what schools must do to accommodate all the students.
Many schools got some relief in 2018, through now-depleted Measures D and E repair and modernization bonds passed by the community, to build multipurpose rooms that act as cafeterias and spaces for school assemblies and family engagement events, such as science or literacy nights.
-

Marshall Elementary, which received some renovations this summer. Still, there is an estimated $750 million need in the elementary and high school districts that fall under Modesto City Schools.Credit: Lasherica Thornton / EdSource
-

The cafeteria at the 95-year-old Modesto Elementary School District’s Enslen Elementary isn’t large enough for multiple classes to eat lunch together, so the school uses outdoor seating.Credit: Lasherica Thornton / EdSource
-

Marshall Elementary received some renovations this summer. Still, there is an estimated $750 million need in the elementary and high school districts that fall under Modesto City Schools.Credit: Lasherica Thornton / EdSource
-

Modesto City Schools use district funding to address furniture and equipment needs at its 34 schools. Marshall Elementary, last week, swapped out outdated lunch tables. Despite annual funding for equipment, the district is always identifying additional needs.Credit: Lasherica Thornton / EdSource
-

Marshall Elementary Principal Jorge Estrada Valencia has added mesh lining to an area where special education students catch the bus. The mesh lining partially blocks the sun, but Estrada Valencia hopes that local and state facilities funding, if passed by voters and allocated to Marshall, can add a shading structure to protect students from the elements.Credit: Lasherica Thornton / EdSource
Right now, such events at Enslen have to be planned for a time of the year that, weather permitting, families can enjoy them outdoors.
“We have so much parent involvement that we would love to do Christmas plays or winter celebrations. They can’t fit in there,” Webb said about the Enslen cafeteria. “We make it work, but it would be nice to have a spot.”
Large multipurpose rooms would be the priority for Enslen and Marshall if Measure X, the proposed $85 million bond, passes on Nov. 5 and the school board selects the schools for the funding. The schools are some of the oldest in the district and are likely to be prioritized, Shams said.
“They’ve made do with these for so long,” Shams said of the district’s old buildings that are “much too small for today’s population.”
If Modesto residents pass Measure X, the bond will cost homeowners an estimated average of $23 per $100,000 of a home’s assessed value, based on a school board resolution on the bond measure.
Modesto City Schools has an elementary and high school district under its umbrella and two separate tax bases for each district. That structure limits the district’s ability to provide students with facilities comparable to a traditional unified school district, Shams said. The 2018 Measures D and E for the elementary district and a 2022 Measure L for the high school district were the first local bonds the district had since the early 2000s, causing Modesto City Schools to play catch-up, Shams said.
The district has an annual maintenance plan with allocated funding that addresses ongoing facilities needs.
For example, to accommodate more students this year, Enslen Elementary has turned its computer lab into a classroom and moved its music room to the cafeteria while additional portables are installed to address the growth.
At the nearly 75-year-old Marshall, located in a high-poverty area of Modesto, buildings have been painted, carpeting installed, and roofs with dry rot replaced this summer.
Even so, in both the elementary and high school districts, an estimated $750 million worth of needs exist, including addressing weak flooring that moves when stepped on, in a staff room at Marshall Elementary.
Additional district priorities include multipurpose rooms, single points of entry and safer drop-off and pickup areas, according to Superintendent Sara Noguchi. Multipurpose rooms for the 12 remaining TK-6 schools that were not funded with the 2018 bond are estimated to cost millions more than the proposed $85 million bond.
El Vista Elementary, a 71-year-old school, received a new multipurpose room that serves as a cafeteria, has a stage for events and features a music room as well as other amenities through Modesto City’s 2018 bond measures. That left the even older schools of Enslen and Marshall out of the funding.
“The kids take more pride and ownership in having the school renovated. The upgrades beautify the neighborhood,” El Vista principal Adele Alvarez said about the impact of the school’s renovation, including how all the school’s needs have been met. “I want other schools to have this. I want every school to have a brand new MPR (multipurpose room), a brand new front office, or facilities where students … can take pride in.”
In order to address all needs at its schools, Shams said the school district needs to adopt an ongoing bond program like Elk Grove Unified’s, where every two or four years, there’s a bond measure on the ballot. Such a bold move would require the school board placing a bond on the ballot and the community approving the measure each time.
“We’re trying to repair these really old schools, and if that’s going to be done well and students are going to get what they deserve, it will likely be through an ongoing bond program,” Shams said. “(Measure X) will not meet all the needs. There will be schools that will be very happy to get what they need.
“There will be schools that will say, ‘Well, when is it our turn?’”
Central Unified’s ‘bandaid’ approach won’t address its needs
Worn-out pipes, weathered roofs, dry rotted structures and outdated HVAC and public announcement systems are visible even to the naked eye at decades-old Central Unified campuses.
The district has several facilities that are at least five decades old and are in desperate need of updates to the electrical, mechanical, plumbing, HVAC, fire safety, security and emergency communications systems.
Central Unified
- Fresno County
- 15, 955 students
- 82% low-income, foster and English learner students
- $10,840 bonding capacity per student*
Bonding capacity per student is the maximum amount of general obligation bonds a school district can issue at any given time; a district can never go over the ceiling. For unified districts it is 2.5% of total assessed valuation; the median in California is $25,569 per student.
The district has filled spots that have dry rot and even updated some systems as far as funding allowed.
“We’re just kind of putting bandaids on them currently,” facilities planning director John Rodriguez said.
But the needs require more than a bandaid approach. Old schools in Central Unified still have structures and equipment with now-outdated safety standards, including accessibility requirements for students and staff with disabilities. For example, Herndon-Barstow Elementary, a TK-6 grade school built in 1953 in Fresno, has sinks, bathrooms and water fountains constructed in the 1950s, under safety codes from that time period.
Students in wheelchairs are unable to access most of the school’s bathrooms because the doors to the stalls are too narrow. Visually impaired students run the risk of being injured around the school’s water fountains, constructed in the early 1950s or recently added in the early 2000s, because they lack proper railing.
A lack of access for students with disabilities isn’t the only accessibility issue.
Herndon-Barstow as well as Teague Elementary share their campuses with the district’s maintenance departments, leaving the schools little room for emergency vehicles such as a fire truck to navigate, jeopardizing students’ safety.
-

Central Unified’s facilities planning director John Rodriguez showing the narrow restroom door width.
Credit: Lasherica Thornton / EdSource
-

At Herndon-Barstow Elementary, narrow restroom and stall doors lack ADA compliance for students in wheelchairs, for example.Credit: Lasherica Thornton / EdSource
-

Herndon-Barstow Elementary, built in 1953, has restrooms with outdated urinals that are no longer made, facilities planning director John Rodriguez said.Credit: Lasherica Thornton / EdSource
-

Atop a Herndon-Barstow Elementary School is a HVAC system in need of replacement.Credit: Lasherica Thornton / EdSource
-

Water fountains added to Herndon-Barstow in the early 2000s still don’t meet ADA compliance because the railing doesn’t meet the height requirement for students who are wheelchair bound.Credit: Lasherica Thornton / EdSource
-

In order to meet current ADA compliance, sinks should have not have cabinets underneath because students or staff who are wheelchair bound cannot access them.Credit: Lasherica Thornton / EdSource
-

Both Teague Elementary and Herndon-Barstow Elementary, pictured, in Central Unified share campus space with the district’s grounds departments, restricting access for emergency response to the schools.Credit: Lasherica Thornton / EdSource
Herndon-Barstow and Teague Elementary, along with seven other old schools, will be first in line for Measure X, a $109 million bond measure on the November ballot.
With Measure X, the district can continue upgrading and modifying the aged facilities to ensure safety of students and staff. If Central Unified residents approve Measure X, the school district can also qualify for matching state funds through Prop 2, which “needs to happen” alongside the local bond, Rodriguez said. The Measure will not raise taxes.
If the district can get Prop 2 funds, he said, “our dollars go further.”
Reflecting overall lower property values in the Central Valley, Central Unified’s assessed property per student – a measure of a district’s ability to raise property taxes – is less than a third of the state median of $1.4 million per student. Fresno Unified’s is about one-quarter of the state median per student, according to the Center for Cities+Schools of UC Berkeley.
Larger districts with higher property values will have access to a larger share of the funding, Rodriguez said.
“Larger districts that have a higher tax base are more able to access Proposition 2,” he said. “For small districts like ours, it’s disproportionate. The access and equity just isn’t there.”
With funding, Central Unified also wants to create more classrooms and build new multipurpose rooms to support student achievement, enhance security measures with fencing and additional cameras and construct or renovate transitional kindergarten classes.
Also on the priority list is the plan to replace portables with permanent structures at schools such as Central East High, where most of the campus is portables, many of which are at least 30 years old.
In 2021, a year after the community passed a $120 million bond, the district estimated its total needs to be between $700 and $800 million.
Renovations that have been made over the years can only go so far in addressing needs. The district used millions in federal pandemic relief money and other funding to replace most schools’ outdated ventilation systems “as far as the money could take us,” Rodriguez said.
But Central East still operates an outdated chiller system for heating and air conditioning. A chiller has pipes that run chilled water from the chiller into rooms, producing cool air. A broken chiller would take out the AC in more than 20 classrooms versus updated AC units for individual buildings or classes that limit outages to buildings or rooms. Rather than install a new ventilation system that’s needed, the district had to make the cost-effective decision to update two of the school’s four chillers.
“Sometimes we’re not able to make those changes (that we need),” Rodriguez said.
While Rodriguez hopes that Measure X can mean continued improvements to the HVAC and other systems, he said the money won’t address all the needed repairs.
Some of the schools in line for money are so old that they were built with asbestos paint, which is now known to be a hazardous material if not encapsulated. Much of the funding for those schools would go towards asbestos removal.
“If we don’t get the funding, it would stop that cyclical process (of renovating, improving and upgrading aging facilities); it just stops that momentum,” Rodriguez said. “Our sites will deteriorate, and our students will be disadvantaged by that deterioration, that deficiency.”