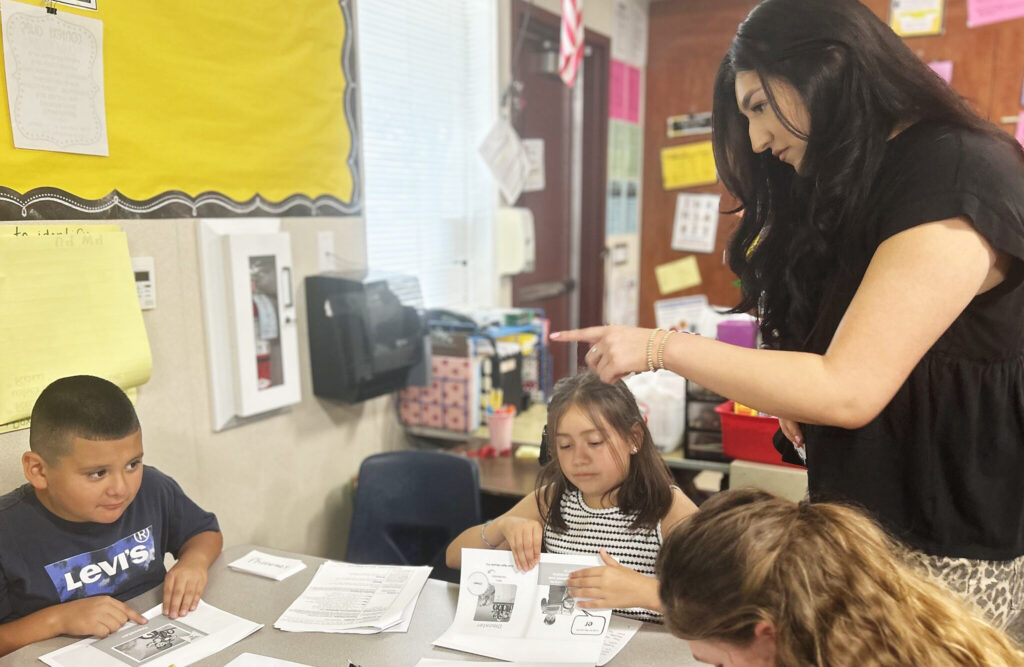
برچسب: Focus

  • California School Dashboard lacks pandemic focus, earns a D grade in report

    California School Dashboard lacks pandemic focus, earns a D grade in report


    Credit: Alison Yin / EdSource

    National surveys have determined that parents significantly understate how far behind children are academically because of pandemic learning setbacks. The A’s and B’s  that their kids have been getting on their report cards don’t tell the full story, concluded a survey of 2,000 parents .

    “To hear parents tell it, the pandemic’s effects on education were transitory. Are they right to be so sanguine? The latest evidence suggests otherwise,” wrote education professors Sean Reardon of Stanford and Tom Kane of Harvard.

    States’ websites that annually report the scores on standardized tests and other valuable data, like chronic absenteeism, could provide a reality check by clearly and easily displaying performance results over time. However, the California School Dashboard, the public’s primary source for school and district performance data, has failed to do that. The Center on Reinventing Public Education concluded this in the report State Secrets: How Transparent Are State School Report Cards About the Effects of COVID? issued Thursday. California was one of eight states to receive a D grade on an A-F scale, behind the 29 states that did better, including 16 states with an A or B.  

    The report focused on how states handled longitudinal data — showing changes in results over multiple years — from pre-Covid 2018-19 or earlier to now. In most states, that multiyear look would show a sharp drop on the first testing after the pandemic, followed by a slow recovery that has not made up for lost ground. For California, the decline in 2021-22, following two years of suspended testing, wiped out gradual gains since the first dashboard in 2014-15.

    “The (California) dashboard makes it hard to identify longitudinal results,” said Morgan Polikoff, professor of education at the USC Rossier School of Education and the lead author of the report. “Because the dashboard never puts yearly data next to each other; you have to pull up multiple years, download the data, and put the data in Excel or something like that if you want to look at longitudinal trends.”

    By contrast, one of seven states to receive an A, Connecticut shows five years of results in bar charts and line graphs for 11 measures.

    Connecticut’s dashboard, praised in the report, shows changes over time for multiple performance measures.
    Source: Connecticut’s Next Generation Accountability Report

    “If we had rated states on something else (e.g., how clearly they presented data for the given year), we would have arrived at different ratings,” the report said.

    Researchers examined longitudinal data for seven metrics: achievement levels in English language arts, math, science and social studies, achievement growth in English language arts and math, chronic absenteeism, high school graduation rates and English learner proficiency and growth. Teams of evaluators from the center, which is based at Arizona State University, used a point system for each metric based on whether it was easy, somewhat difficult, much too difficult or impossible to find longitudinal data.

    “It’s not about having the data — it’s about presenting the data to the public in a way that’s usable,” Polikoff said of California’s dashboard.

    California collects the data for five of the seven metrics. It no longer administers a statewide social studies test. It also doesn’t compile achievement growth using students’ specific scores over time, although the state has been considering this approach for more than six years. Instead, it compares scores of this year’s students with different students’ scores in the same grade a year earlier.  

    Some other states also don’t give a social studies test; California could still have gotten an A grade without it, Polikoff said.

    The California Department of Education said that the dashboard undergoes an annual review for refinements to make sure it is “genuinely accessible and useful to our families.”

    “We always remain open to the feedback and needs of our families, and we look forward to understanding more about the approach taken by the Center for Reinventing Public Education,” Liz Sanders, director of communications for the department, said in a statement.

    She added that School Accountability Report Cards and DataQuest supplement the dashboard and can readily answer questions raised by the Center for Reinventing Public Education. “The dashboard serves a specific purpose to help California’s families understand year-over-year progress at their students’ schools, and the user interface is simplified based on feedback from diverse and representative focus groups of California families,” Sanders said.

    Not a priority

    At the direction of the State School Board, the California Department of Education chose to focus on disparities in achievement as its top priority for the dashboard. For every school and district, it has made it easy to see how 13 student groups, including low-income students, students with disabilities, English learners, and various racial and ethnic groups performed on multiple measures.  

    The state developed a rating system using five colors (blue marking the highest performance and red the lowest). Each color reflects the result for the current year combined with the growth or decline from the previous year. The colors send a signal of progress or concern. 

    However, without reporting longitudinal results for context, the color coding can prove problematic. The statewide chronic absence rate in 2022 was a record high of 30%. Declining 5.7 percentage points in 2023 to 24.3% earned a middle color, yellow signifying neither good nor bad. Yet the chronic absence rate was still at an alarmingly high level. Viewers would have to look closely at the numerical components behind the color to understand that.

    No ability to compare schools and districts

    Unlike some other states’ dashboards, the California School Dashboard also does not permit comparisons of schools and districts. That was by design. Reflecting the view of former Gov. Jerry Brown, the state board focused on districts’ self-improvement and discouraged facile comparisons that didn’t consider the data behind the colors. 

    However, both EdSource’s annual alternative dashboard and Ed-Data, a data partnership of the California Department of Education, EdSource, and the Fiscal Crisis and Management Assistance Team/California School Information Services, encourage multi-school and district comparisons.

    Ed-Data has a five-year comparison of test scores and other metrics. Although this year it no longer starts with 2018-19, the pre-Covid base year for comparisons, viewers can use the year slider above the charts to view data for earlier years.

    EdSource has created graphics showing longitudinal statewide results in math and English language arts, including breakouts for student groups, dating to the first year of the Smarter Balanced testing.

    “If California had reported all of the outcomes in a format like that, it would’ve gotten an A because that’s exactly the kind of comparison we are looking for,” Polikoff said.

    The report separately analyzed the usability of states’ dashboards to determine whether they are easy to use and well-organized. California is one of 16 states rated “fair,” with 23 states rated “great” or “good,” and 11 states, mainly small states like Vermont, but also Texas and New York, rated “poor.”

    “We were struck by how difficult it was to navigate some state report card websites,” the report said. “We found many common pitfalls, ranging from the relatively mundane to the massive and structural.”

    Kansas, for example, lacked a landing page with overall performance data, while Texas school report cards “offer a wealth of data broken down by every student group imaginable” in massive data tables but no visualizations.

    The five states with “great” usability are Illinois, Indiana, Oklahoma, Idaho and New Mexico, the last two of which got an F for longitudinal data.

    “California’s dashboard is far from the worst out there,” said Polikoff. “The reality is little tweaks are not going to cut it. That probably means a pretty substantial overhaul to be usable for longitudinal comparisons. Now, the state might say, ‘We don’t care about longitudinal trends’ and that’s their prerogative, but what purpose is the dashboard trying to serve, and who’s it trying to serve?”

    Answer those questions, he continued, “and then design the dashboard accordingly.”


    Source link

  • PBL Project Design Focus on Content Knowledge and Skills

    PBL Project Design Focus on Content Knowledge and Skills


    Project Design Focus of PBL Image

    PBL Project Design Focus

    When designing a PBL Project, your focus is to teach students academic content area knowledge and skills drawn from district or state standards. Your project also focuses on building students’ ability to think critically, solve problems, collaborate, and communicate (3Cs), which are the 21st Century skills students need to prepare for life and work in today’s world, according to PBL in the Elementary Grades book.

    The book provides a project overview planning form. See below

    PBL Project Overview Form

    On the form, it indicates which standards and skills you are targeting for your project.

    Selecting Content Standards for Your Project

    You are good to go if you have come up with your project ideas by starting from your standards. It is important to remember to align your project with standards.

    Standards that are most important are called “priority standards” that are identify by your school or district you want to use as the focus for your project. Priority standards are often based on what items appear more frequently on state tests.

    If priority standards have not been identified, you can decide for yourself or with colleagues in your grade level what the priority standards are for the content areas included in the project.

    To Start the Alignment Process:

    First decide on the few standards that are most essential for meeting the goals of the project. It is not a good idea to try to include as many standards as possible in the project since students will ne spending so much time on it. Typically, a project should focus only 1 – 3 standards from each academic content area to be included, depending on how specific standards are written.

    If you try to include too many standards, you cannot teach them in any depth and assess them adequately.

    PBL in Elementary Grades book provides an 4th grade Curriculum Map with Projects as an example:

    4th grade Curriculum Map Image

    Another suggestion the book made is to use curriculum guides or scope and sequence documents that contain standards that are “unpacked” into discrete skills and pieces of knowledge. You can use this specific guidance to design project products, assessments, and lesson that align closely with the standards.

    Selecting 21st Century Skills

    Communication, collaboration, and critical thinking/problem solving are the three most important 21st century skills called the “3Cs”. According to PBL in Elementary Grades book these skills and several others are a natural fit with PBL. The book recommends not to assume students are gaining these skills because you designed a challenging project. These skills should be taught and assessed in a project.

    PBL in Elementary Grades book notes you only teach and assess two of the skills if this is your first project. One is oral communication (making presentation) because all projects include presenting to a public audience as an essential element. Presentation skills are called for in the Common Core Standards for English Language Arts, and they are straightforward to teach and assess.

    Collaboration or working in teams is the other skill that is easy to teach and assess. You probably are familiar with group work and cooperative learning, so you already have some basics tools in your toolbox.

    PBL in Elementary Grades book emphasizes the 3Cs are important for success in the 21st century, and that these skills can be taught and assessed in projects. See examples below:

    Collaboration

    • Take responsibility for the quality and timeliness of his or her own work; uses feedback; stays on task during group work.
    • Accepts shared responsibility for the work of the group; helps improve the quality of the work an understanding of other members.
    • Applies or encourages the use of strategies for facilitating discussion and decision making.
    • Manages project by identifying and prioritizing goals and tasks, creating timelines, organizing resources, and monitoring progress.
    • Respects the ideas, opinion, abilities, values, and feeling of other group members; Works well with diverse group members; Encourages group cohesion by using conflict management strategies.

    Communication (When making a presentation)

    • Organizes ideas and develops content appropriate to audiences and situations.
    • Uses effective oral presentation skills.
    • Create media/visual aids that enhance content delivery.
    • Gauges audience reaction and/or understanding and adjusts presentation appropriately.
    • Responds to questions appropriately.

    Critical Thinking/Problem Solving

    • Recognizes and defines problems accurately; raises relevant questions and issues, formulating them clearly and precisely.
    • Gathers pertinent information from a variety of sources; evaluates the quality of information (source, validity, bias).
    • Organizes, analyzes, and synthesizes information to develop well-reasoned conclusions and solutions, judging them against relevant criteria.
    • Considers alternatives; recognizes and assesses assumptions, implications, and practical consequences.

    College and Career Readiness Standards for English Language Arts: Speaking and Listening: Presentation of Knowledge and Ideas Continuum from Kindergarten to Fifth Grade. See Below:

    Hallermann, Sara; Larmer, John; Mergendoller PhD, John. PBL in the Elementary Grades: Step-by-Step Guidance, Tools and Tips for Standards-Focused K-5 Projects (p. 32). Buck Institute for Education. Kindle Edition.

    Teaching students how to think critically and solve problems is more challenging. These are complex skills that cut across several content areas, and most teachers only have experience with instruction that emphasizes factual and procedural knowledge. Assessing critical thinking/problem solving is also challenging, because it is not readily observable.

    Hallermann and Mergendoller suggest other skills might be encouraged in your project, but not explicitly taught and assessed — such as creativity or global awareness. If you’re ambitious, and it’s not your first project, you may wish to add more skills to your list of goals, such as project management, the use of various technological tools, and cross-cultural competence. These are all teachable and assessable. Note that if you want to teach multiple 21st century skills, your project will need to be longer, to build enough time during the project to practice and assess the skills.

    Hallermann, Sara; Larmer, John; Mergendoller PhD, John. PBL in the Elementary Grades: Step-by-Step Guidance, Tools and Tips for Standards-Focused K-5 Projects (p. 33). Buck Institute for Education. Kindle Edition.

    If this is your first PBL project, you might want to review First PBL Project Modest in Scope Achieve Best Results


    Source link