برچسب: dashboard

  • A refresher on the California School Dashboard | Quick Guide

    A refresher on the California School Dashboard | Quick Guide


    Children working together on Chromebooks

    Media arts classes can help children learn how to mix digital skills with the creative impulse.

    Credit: Mountain View Whisman Elementary School District

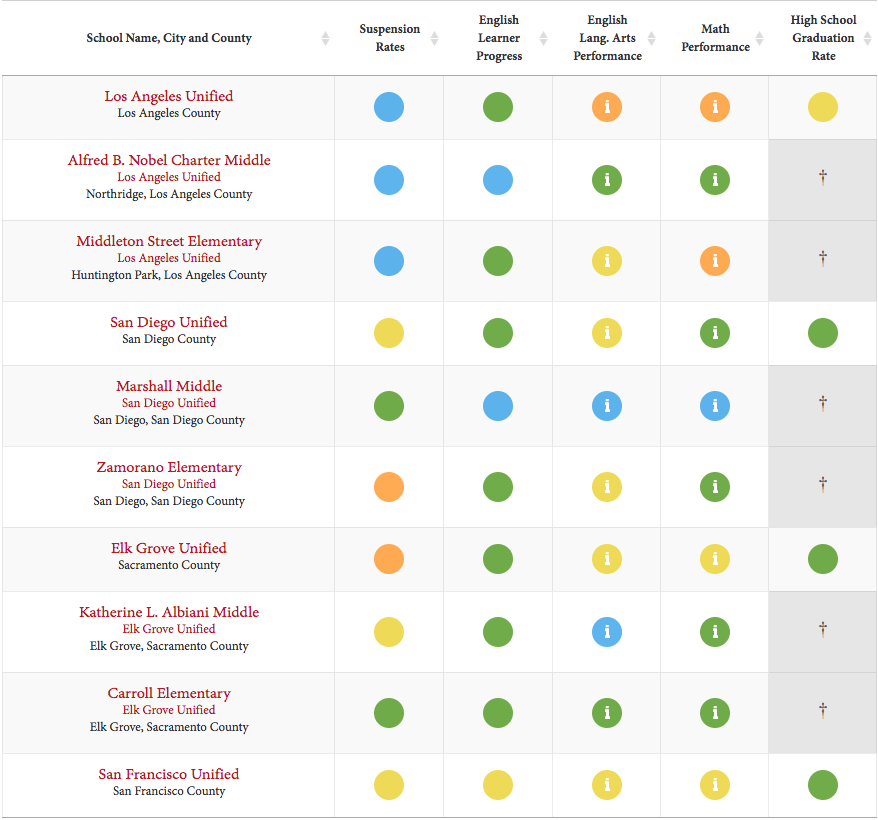
    The California School Dashboard is back in full color for the first time in four years.

    The dashboard, which the California Department of Education will release on Friday, is the state’s academic accountability and improvement tool designed for parents and educators. It rates the performance of every school, district and charter school, along with any of 13 student groups that attend them, with a color on seven indicators of performance, including math and English language arts test scores, chronic absence rates and graduation rates.

    First introduced in 2016-17, the dashboard was suspended because of the pandemic in 2019-20 and 2020-21, and resumed this year with the collection of two consecutive years of data needed to generate color ratings.

    Here’s a guide to the dashboard for first-time viewers and for those who need a brush-up course on how to read and interpret the colors and the data behind them.

    Why the dashboard?

    The Local Control Funding Formula, passed by the Legislature in 2013, required it — or something close to it. 

    Dissatisfied with the Academic Performance Index, which assigned a three-digit ranking to districts based exclusively on test scores, legislators mandated a broader look at school performance and conditions of learning through multiple measures. There would be no summative ranking; instead, there would be components, such as suspension rates, that would provide evidence for specific actions for improvement. The Legislature required that districts and schools highlight lowest-performing student groups, not just districtwide averages for all students that can shroud inequalities. The intent was to tie actions in a district’s three-year improvement strategy, the Local Control and Accountability Plan, or LCAP, to results in the dashboard.

    The dashboard also marks a shift away from the mindset of the federal No Child Left Behind Act. Instead of punishment for low performance, the funding formula promises guidance and assistance to districts with low-performing student groups. As State Board of Education President Michael Kirst and then-state Superintendent of Public Instruction Tom Torlakson wrote in a 2017 commentary for EdSource, “We have a rare opportunity to turn data into direct action. The state is now able to identify specific challenges school districts are facing and is committed to providing assistance rather than the sanctions of the past.”

    Which are the 13 student groups?

    African American, American Indian, Asian, English learners, Filipino, foster youth, Hispanic, homeless, two or more races, Pacific Islander, socioeconomically disadvantaged, students with disabilities, and white.

    What are the performance indicators?

    Chronic absenteeism measures students from kindergarten through eighth grade who were absent at least 10% of school days during the academic year, or at least 18 days.

    English learner progress indicator, which is new this year, measures progress toward English language proficiency by measuring English language learners’ results on the English Language Proficiency Assessments for California from the current to the previous year.  

    Suspension rate measures the percentage of students who were suspended for a total of one full day anytime during the school year (multiple suspensions of the same student are not factored in).

    Graduation rate measures the percentage of students receiving a high school diploma within four or five years or who complete graduation requirements at an alternative school.

    College/career indicator measures the percentage of high school graduates who are prepared for college or a career. It looks at the number of students who completed or fulfilled one or some of the following metrics:  

    • Advanced Placement exams. 
    • A-G course requirements for a state university.
    • A career technical education pathway.
    • College credit through dual enrollment.
    • An International Baccalaureate exam.
    • Leadership/military science program.
    • A pre-apprenticeship.
    • A state and federal jobs program.
    • The State Seal of Biliteracy.
    • Work-based learning experiences.
    • Performance rates on the 11th-grade Smarter Balanced tests in English language arts and math. 

    Schools or districts where 55% of students meet the criteria are rated high performance; at 70%, they are rated very high.

    English language arts indicator measures the Smarter Balanced test results and the California Alternative Assessments for grades three to eight and grade 11. It is determined by students’ average distance in points below or above the score that indicates a student performs at standard for the grade. A school’s or district’s participation rate counts, too.

    Math indicator measures the Smarter Balanced test results and the California Alternative Assessments for grades three to eight and grade 11. It is determined by students’ average distance in points below or above the score that indicates a student performs at standard for the grade. A school’s or district’s participation rate counts, too.

    Why are there colors?

    Seeking to create a tool that encourages improvement, the state board concluded that the most constructive measure would include both the results for the current year and an indication of whether those scores increased or decreased from the year before. A color reflects the intersection between both variables: the current status and one-year change; both factors are given equal weight. Schools with previously very low math scores that show significant improvement the next year, for example, are rewarded by moving up from red to yellow or green. Schools that suspended lots of kids this year compared with the year before will see the color change from green to yellow or orange — a signal that it’s time to pay attention and ask why.

    How are colors determined?

    Source: California School Dashboard

    A look at a five-by-five grid provides the answer. For every indicator, the results for the current year are divided into five performance categories, listed from top to bottom: very high, high, medium, low and very low. Change in performance from the previous year is also divided into five categories, listed from left to right: declined significantly, declined, maintained, increased, increased significantly. As in bingo, mark your X on the intersection of vertical numbers on the left with the horizontal numbers at the top.  

    To illustrate, consider the graduation rate of Santa Ana Unified. Its 89.7% graduation rate in 2023 is 3.3 percentage points higher than the state average, but the decline of 2.8 percentage points from 2022 pushed it from what might have been green or yellow to orange.  

    You have to look at the underlying data to understand a color, especially yellow. It could indicate good news or bad, depending on the change from the year before. It doesn’t mean satisfactory.

    Have the cut scores defining the performance levels and change been reset to reflect learning setbacks resulting from Covid?

    No. The same criteria that determined a red or blue in 2017 applies to 2023. However, because of the suspension of the dashboard during the pandemic, the 2023 dashboard will reset the rating process. Test scores were higher and chronic absences were a lot lower pre-pandemic than in 2023. Color ratings in 2023 understate some of those disparities by comparing 2023 results with those of 2022, the first post-pandemic year.  An EdSource analysis, found in 2019, 82 districts scored very high in math and 47 districts scored very low. In 2023, 63 districts scored very high, and 137 scored very low.

    Why is there no color this year for the college and career indicator?

    The results of the Smarter Balanced tests in 11th grade in math and English are a metric used to determine that indicator. There need to be two years of test results to measure change on the dashboard. No test was given in spring 2021, so there was no score for the class of 2022 and therefore no way to compare it with the 11th grade results for the class of 2023. Next year, there will be a color for the 2024 dashboard, with the publication of 11th grade scores in 2023 for the class of 2024.

    What is the equity report?

    The equity report is what you turn to by clicking on any performance indicator on the home page for any district or school. It takes you to a color breakdown of all 13 student groups with enough students to be measured. Click further, and it will show the underlying data — scores and the change from the year before — for each student group. Comparing the groups reveals disparities and rates of improvement, evidence for setting goals in the Local Control Accountability Plan to close achievement gaps.

    How does the dashboard define what low-performing districts and charter schools qualify for extra help, called differentiated assistance?

    It’s complicated.

    In writing the funding formula, the Legislature said that districts, county offices of education and charter schools should be held accountable for performance in several priority areas. The state’s seven statewide performance indicators fall within them: school climate (suspension rates); pupil engagement (graduation rate and chronic absences) and pupil achievement (the English Learner Progress Indicator and the math and English language arts tests).

    Districts and charter schools are eligible for differentiated assistance when one or more student groups get a red rating in two or more priority areas. They will receive help from a county office of education; poor-performing county offices, which also run schools, will get help from the state.

    In 2023, 466 school districts and county offices of education will be eligible for differentiated assistance; they represent 47% of the total. That’s 151 fewer than in 2022; the biggest factor was a decline in the rate of chronic absenteeism. While still at historic levels, the 5.7 percentage point statewide drop from 30% pushed the state and most districts into yellow, from what would have been red.

    The Legislature also established priority areas for which there are no statewide measures: Basic school conditions, such as appropriately assigned credentialed teachers and clean and functional school facilities; implementation of state academic standards; parent and family engagement, and access to a broad course of study. Districts have local options on how to verify annually that the standards have been met. A failure to meet the standards in a local priority area for two consecutive years can also qualify a district for differentiated assistance.     

    This year, for the first time, districts must address in their Local Control Accountability Plans how they will address student groups performing in the red on any indicator in any school. This new mandate is intended to ensure funding from the Local Control Funding Formula is directed to the students with the most needs.


    Source link

  • Search and compare data from the California School Dashboard, 2023

    Search and compare data from the California School Dashboard, 2023


    On Dec. 14, 2023, the California Department of Education updated the official California School Dashboard with the latest data for schools and districts. You can also view results for 2019, 2018, and 2017.* The dashboard shows achievement and progress, or lack of it, on multiple measures in color codes tied to performance metrics by the state. Enter a search term in the box to search by school, city, district or county. If a school or district does not appear, it means that no data is available. Detailed test scores are available on cells with an “i” (click to see more). For a full explanation, see the notes below the chart.

    * The 2022 California School Dashboard only displays that year of results, without comparisons to the previous year, due to disruptions caused by the pandemic. 


    School Name, City and County Chronic Absenteeism Rate Suspension Rates English Lang. Arts Performance Math Performance High School Graduation Rate English Learners Link
    School Name, City and County Chronic Absenteeism Rate Suspension Rates English Lang. Arts Performance Math Performance High School Graduation Rate English Learners Link

    Notes to Database

    Color Codes and Ratings: The dashboard includes five color-coded performance levels, based on a combination of current performance level and change over the previous year. The color spectrum ranges from red to orange to yellow to green to blue, with red signifying the lowest performance level and blue the highest.

    More information about how the performance levels were calculated is available at the California Department of Education’s website here.

    Column Headings:

    Chronic Absenteeism: Proportion of students who miss 10 percent or more expected days of attendance in a school year. (For a student enrolled for 180 days, this would be 18 or more days.) Note: This indicator is not reported for high schools.

    Suspension Rates: Based on a combination of current suspension rates and changes in those rates over time.

    English Language Arts Performance: Student performance in Grades 3-8 and 11 on the English Language Arts Smarter Balanced tests administered in the current year, combined with whether scores improved, declined or stayed the same compared to the previous year.

    Math Performance: Student performance in Grades 3-8 and 11 on the math Smarter Balanced tests in the current year combined with whether scores improved, declined or stayed the same compared to the previous year.

    High School Graduation Rate: Combined four-year and five-year graduation rates, including current graduation rate along with whether rates have changed over the previous year.

    For more information about how the performance levels were calculated, go to the California Department of Education’s website here.

    For the full dashboard for each school or district, go here.

    Read more:


    Source link

  • California School Dashboard released for the 2022-23 School Year

    California School Dashboard released for the 2022-23 School Year


    Students work together during an after-school tutoring club.

    Credit: Allison Shelley for American Education

    For the first time since 2019, the California Department of Education has fully updated the California School Dashboard that tracks the annual progress of K-12 students on factors such as standardized test scores, chronic absenteeism, suspensions and graduation rates.

    Since its rollout in 2017, the dashboard aims to show the progress of students at the state, district and school level using a color-coded system. It breaks this information down by 13 student subgroups, such as English language learners, disabled students and race and ethnicity. Friday’s update provides a snapshot of the progress made between the 2021-22 and 2022-23 academic years, representing the aftermath of the pandemic’s peak.

    Red signals the poorest performance, followed by orange, yellow and green, while blue signals the best performance. State officials say that anything below green indicates the need for attention and improvement. Amidst the pandemic, the state stopped releasing this information in 2020.

    The dashboard relies on some data, such as test scores and chronic absences, that was released in October. Other data — such as graduation rates and how many students met the entrance requirements to California universities, one measure of career and college readiness — were released Friday.

    For the first time, this year’s dashboard adds a color-coded score to measure how many English learners are making progress toward proficiency on the English Language Proficiency Assessments of California (ELPAC).

    On chronic absenteeism and English learner progress, the state’s status was yellow, a midway point between blue and red. The state’s status was orange — the second-worst status — for its suspension rate, graduation rate and performance on standardized tests for mathematics and English language arts.

    State officials said the results demonstrate California schools are making progress in the wake of the pandemic, which witnessed sharp declines in standardized test scores and a surge in chronic absenteeism.

    “Recovery from the pandemic has been a long process all across the country,” said California State Board of Education President Linda Darling-Hammond, in a statement. “While we have a long way to go, these results show that California is making strides, especially in enabling students to get to school and graduate ready for college and careers.”

    The rate of students graduating from high school who met the minimum course requirements to attend a CSU or UC reached an all-time high: 45.15%. That number has continued to steadily increase throughout the pandemic, up from 41.24% in 2016-17.

    The statewide four-year graduation rate is 86.2%, a decline from last year’s all-time high of 87%. State officials attribute 2021-22’s peak to a loosening of state graduation requirements and grading policies at the height of the pandemic. Officials say this most recent dip is due to a return to pre-pandemic policies.

    The dashboard’s color coding system takes into account both whether a metric is high or low, and also whether that metric has declined, maintained or improved within the past year.

    For instance, the orange ratings for math and English language arts test scores reflect the fact that after huge dips from pre-pandemic scores, there was little change from the previous year’s scores. Math scores edged up 2.6 points and English scores dipped 1.4 points. 

    The state’s chronic absentee rate in 2022-23 was 24.3%. That means nearly a quarter of students missed 10 or more days of school that year. That is a 5.7 point dip from the previous year’s all-time high of 30%. However, it is still a historically poor rate, roughly double the 2018-19 rate of 12.1%. Chronic absentee rates were above 20%, the worst category, in 62% of districts.

    Data shows that chronic absenteeism surged nationwide in the wake of the pandemic, and it hit nearly every school district. Experts have said that sick days from Covid and quarantining can account for part but not all of the rapidly increasing absentee rates. The CDE trumpeted the state’s declining chronic absenteeism rate.

    “This is encouraging news, and our work is not complete,” said Superintendent Tony Thurmond, in a statement. “We have made an unprecedented investment in services that address the needs of the whole child. We can see that those efforts are paying off, but this is only the beginning.”

    But some questioned whether the dashboard’s metrics provide a meaningful portrait of progress in the state.

    The dashboard was created before the pandemic when there were a different set of assumptions about what progress would look like in schools, said Heather Hough, executive director of PACE, a Stanford-based education research organization. Metrics didn’t tend to surge or nosedive year to year before the pandemic. Improvement on metrics like chronic absenteeism or standardized test scores are worth noting, she said, but the dashboard’s focus on one year of change can be misleading.

    “That can mask the concern that we should still be having: A lot of students are far behind where they have been, and large portions of students are not attending school,” Hough said.

    The color coding system has implications for which schools are eligible for additional assistance. Skyrocketing chronic absenteeism rates were largely responsible for a surge in schools that were eligible for differentiated assistance. In 2019, 333 school districts were eligible but by 2022 that number shot up to 617. This year 466 school districts were eligible.

    Advocates for English learners also worry that the way that the dashboard presents metrics is downplaying an urgent issue in education.

    The dashboard shows that about half (48.7%) of English learners in the state advanced at least one level or remained at the top level of English language proficiency, based on their scores on the ELPAC, a test English learners are required to take every year until they reach proficiency. This is about the same number who progressed as last year.

    CDE considers this to be a yellow score — a medium number of students making progress toward English proficiency, and not much change in how many did so. In order to reach green, the number of students making progress toward English proficiency would have to increase by 2 percentage points.

    Martha Hernandez, executive director of Californians Together, an organization that advocates for English learners statewide, said fewer than 50% of English learners making progress each year should be considered very low, or red, rather than medium, or yellow.

    “That seems to be a passing score, so to speak, and really doesn’t create the sense of urgency to really focus on the needs of English learners,” Hernandez said. “We really think the state has low expectations for districts having students make progress.”

    Hernandez said if students advance one level each year, they would achieve proficiency in six years, which is a reasonable expectation based on research. When students take longer than six years to achieve proficiency, they are considered long-term English learners and can struggle in middle and high school.

    Californians Together has advocated for the state to change indicators for English learner progress. The group believes that districts or schools should receive a high, or green, level of progress if at least 70% of English learners progress at least one level in one year. Currently, the state considers 55% of English learners progressing at least one level to be high.

    About a third of English learners (32.7%) in the state remained at one of the same lower levels of English proficiency as the year before on the test. Almost one fifth (18.6%) decreased one level in English proficiency.

    Districts achieved varied scores on English learner progress – 66 were red, 215 orange, 152 yellow, 192 green, and 43 blue.

    In addition, Californians Together criticized the fact that the dashboard rates English learners’ scores on English language arts and math tests together with the scores of students who have achieved proficiency in English in the last four years.

    “It’s a very, very weak picture of the needs of English learners,” said Shelly Spiegel-Coleman, strategic advisor for Californians Together.

    Melissa Valenzuela-Stookey, director of P-16 research at Ed Trust-West, said that the nonprofit that advocates for justice in education, is planning to dig into the data to get insight into what is happening for the state’s most marginalized students, but the initial data is concerning.

    “This data shows that the status quo for students of color is unacceptable, and we’re making alarmingly slow progress — but it also points to schools and districts that are proving that we can do better,” Valenzuela-Stookey said.


    Source link

  • California’s science test will be added to state school dashboard

    California’s science test will be added to state school dashboard


    A high school girl mixes chemicals during a chemistry experiment.

    Credit: Allison Shelley for American Education

    The State Board of Education is moving forward with plans to add the state’s science assessment to the California School Dashboard, making it a new piece of the statewide school accountability system.

    Students first took the online science test in 2019, before Covid forced an interruption of testing in 2020. Starting in 2025, performances by district, school and student groups will receive one of five dashboard colors, designating the lowest (red) to the highest performance (blue) — just as with math, English language arts and other achievement indicators. Each color reflects two factors: how well students performed in the latest year and how much the score improved or declined from the previous year.  

    Science teachers welcomed the move as a way of drawing more attention to science instruction. “Doing so will add visibility to ensure that districts invest in making sure that all California students receive the science ed they deserve,” Peter A’Hearn, a past president of the California Association of Science Educators, told the state board at a hearing March 6.

    “Our biggest frustration is that students have not been getting any or minimal instruction in elementary schools, especially in low-performing and low-socioeconomic schools,” A’Hearn said.

    As required by Congress, all students in grades five, eight and at least once in high school take the California Science Test or CAST. Designed with the assistance of California science teachers to align with the Next Generation Science Standards, the test includes multiple-choice questions, short-answer responses and a performance task requiring students to solve a problem by demonstrating scientific reasoning.

    For the 2022-23 year, only 30% of students overall scored at or above grade standard. Eleventh-grade students did best, with 31.7% meeting or exceeding standard. 

    The test measures knowledge in three domains: life sciences, focusing on structures and processes in living things, including heredity and biological evolution; physical sciences, focusing on matter and its interactions, motion, energy and waves; and Earth and space sciences, focusing on Earth’s place in the universe and the Earth’s systems.

    California replaced its science standards with the Next Generation Science Standards (NGSS) in 2013. NGSS was a national science initiative that stressed hands-on learning, broad scientific concepts and interdisciplinary relationships of various science domains. The state board adopted the state’s NGSS framework in 2016, and textbook and curriculum adoption followed.

    Districts’ implementation has been slow, with no funding specifically dedicated to teacher training and textbook purchases. The pandemic set back momentum, said Jessica Sawko, director of the California STEM Network, a project of the nonprofit advocacy organization Children Now.

    “NGSS pointed us to a higher-quality and richer approach, but it has not yielded statewide equitable access to science,” she said. “There have been shifts in instruction, but they have not been widespread and haven’t resolved a narrowing of access to science, particularly before fifth grade.” She said many districts don’t include goals for science education in their three-year planning document, the Local Control and Accountability Plan. Tracy Unified, which budgeted $768,000 this year for teacher training in NGSS and STEM studies, is an example of one that did (see page 28 of its LCAP).

    Although the science assessment will be part of the state dashboard, the State Board of Education has yet to decide how it will factor into the state and federal accountability systems — if at all. Congress does not require the science test to be included with math, English language arts and graduation rates. Folding the science test into the state system would entitle the lowest-performing districts and student groups to assistance in science instruction from their county office of education.

    Student growth measure, too

    Also at the March 6 meeting, the state board discussed a timetable for adopting a system to measure individual students’ growth on standardized test scores — an idea that has been discussed for nearly a decade. More than 40 states are using a student growth model for diagnosing test scores.

    The state’s current system, which the California School Dashboard reflects, compares the percentage of students who achieved at grade level in the current year with the previous year’s students’ level of achievement. The student growth model, a more refined measure, looks at all students’ individual gains and losses in scale points over time.

    A comparison of the two ways of measuring scores was a factor that led to the settlement last month of the Cayla J. v. the State of California lawsuit. Brought on behalf of students in Oakland and Los Angeles, one of its claims was that Black, Latino and low-income children’s test scores fell disproportionately behind other student groups during the pandemic. 

    The state, using the current method, said that all student groups’ scores fell about the same percentage from meeting standards. Harvard University education professor Andrew Ho’s analysis for the plaintiffs showed that “racial inequality increased in almost all subjects and grades. Economic inequality also increased.” The settlement calls for using scale scores under a student growth model to determine which groups of students will be eligible for state improvement money.

    The state must collect three years of data for a student growth model, which it won’t have until next year. Then the state board must decide whether to use it as a replacement or as a complement to the current system for the state accountability system, said Rob Manwaring, a senior adviser for Children Now.


    Source link

  • California School Dashboard lacks pandemic focus, earns a D grade in report

    California School Dashboard lacks pandemic focus, earns a D grade in report


    Credit: Alison Yin / EdSource

    National surveys have determined that parents significantly understate how far behind children are academically because of pandemic learning setbacks. The A’s and B’s  that their kids have been getting on their report cards don’t tell the full story, concluded a survey of 2,000 parents .

    “To hear parents tell it, the pandemic’s effects on education were transitory. Are they right to be so sanguine? The latest evidence suggests otherwise,” wrote education professors Sean Reardon of Stanford and Tom Kane of Harvard.

    States’ websites that annually report the scores on standardized tests and other valuable data, like chronic absenteeism, could provide a reality check by clearly and easily displaying performance results over time. However, the California School Dashboard, the public’s primary source for school and district performance data, has failed to do that. The Center on Reinventing Public Education concluded this in the report State Secrets: How Transparent Are State School Report Cards About the Effects of COVID? issued Thursday. California was one of eight states to receive a D grade on an A-F scale, behind the 29 states that did better, including 16 states with an A or B.  

    The report focused on how states handled longitudinal data — showing changes in results over multiple years — from pre-Covid 2018-19 or earlier to now. In most states, that multiyear look would show a sharp drop on the first testing after the pandemic, followed by a slow recovery that has not made up for lost ground. For California, the decline in 2021-22, following two years of suspended testing, wiped out gradual gains since the first dashboard in 2014-15.

    “The (California) dashboard makes it hard to identify longitudinal results,” said Morgan Polikoff, professor of education at the USC Rossier School of Education and the lead author of the report. “Because the dashboard never puts yearly data next to each other; you have to pull up multiple years, download the data, and put the data in Excel or something like that if you want to look at longitudinal trends.”

    By contrast, one of seven states to receive an A, Connecticut shows five years of results in bar charts and line graphs for 11 measures.

    Connecticut’s dashboard, praised in the report, shows changes over time for multiple performance measures.
    Source: Connecticut’s Next Generation Accountability Report

    “If we had rated states on something else (e.g., how clearly they presented data for the given year), we would have arrived at different ratings,” the report said.

    Researchers examined longitudinal data for seven metrics: achievement levels in English language arts, math, science and social studies, achievement growth in English language arts and math, chronic absenteeism, high school graduation rates and English learner proficiency and growth. Teams of evaluators from the center, which is based at Arizona State University, used a point system for each metric based on whether it was easy, somewhat difficult, much too difficult or impossible to find longitudinal data.

    “It’s not about having the data — it’s about presenting the data to the public in a way that’s usable,” Polikoff said of California’s dashboard.

    California collects the data for five of the seven metrics. It no longer administers a statewide social studies test. It also doesn’t compile achievement growth using students’ specific scores over time, although the state has been considering this approach for more than six years. Instead, it compares scores of this year’s students with different students’ scores in the same grade a year earlier.  

    Some other states also don’t give a social studies test; California could still have gotten an A grade without it, Polikoff said.

    The California Department of Education said that the dashboard undergoes an annual review for refinements to make sure it is “genuinely accessible and useful to our families.”

    “We always remain open to the feedback and needs of our families, and we look forward to understanding more about the approach taken by the Center for Reinventing Public Education,” Liz Sanders, director of communications for the department, said in a statement.

    She added that School Accountability Report Cards and DataQuest supplement the dashboard and can readily answer questions raised by the Center for Reinventing Public Education. “The dashboard serves a specific purpose to help California’s families understand year-over-year progress at their students’ schools, and the user interface is simplified based on feedback from diverse and representative focus groups of California families,” Sanders said.

    Not a priority

    At the direction of the State School Board, the California Department of Education chose to focus on disparities in achievement as its top priority for the dashboard. For every school and district, it has made it easy to see how 13 student groups, including low-income students, students with disabilities, English learners, and various racial and ethnic groups performed on multiple measures.  

    The state developed a rating system using five colors (blue marking the highest performance and red the lowest). Each color reflects the result for the current year combined with the growth or decline from the previous year. The colors send a signal of progress or concern. 

    However, without reporting longitudinal results for context, the color coding can prove problematic. The statewide chronic absence rate in 2022 was a record high of 30%. Declining 5.7 percentage points in 2023 to 24.3% earned a middle color, yellow signifying neither good nor bad. Yet the chronic absence rate was still at an alarmingly high level. Viewers would have to look closely at the numerical components behind the color to understand that.

    No ability to compare schools and districts

    Unlike some other states’ dashboards, the California School Dashboard also does not permit comparisons of schools and districts. That was by design. Reflecting the view of former Gov. Jerry Brown, the state board focused on districts’ self-improvement and discouraged facile comparisons that didn’t consider the data behind the colors. 

    However, both EdSource’s annual alternative dashboard and Ed-Data, a data partnership of the California Department of Education, EdSource, and the Fiscal Crisis and Management Assistance Team/California School Information Services, encourage multi-school and district comparisons.

    Ed-Data has a five-year comparison of test scores and other metrics. Although this year it no longer starts with 2018-19, the pre-Covid base year for comparisons, viewers can use the year slider above the charts to view data for earlier years.

    EdSource has created graphics showing longitudinal statewide results in math and English language arts, including breakouts for student groups, dating to the first year of the Smarter Balanced testing.

    “If California had reported all of the outcomes in a format like that, it would’ve gotten an A because that’s exactly the kind of comparison we are looking for,” Polikoff said.

    The report separately analyzed the usability of states’ dashboards to determine whether they are easy to use and well-organized. California is one of 16 states rated “fair,” with 23 states rated “great” or “good,” and 11 states, mainly small states like Vermont, but also Texas and New York, rated “poor.”

    “We were struck by how difficult it was to navigate some state report card websites,” the report said. “We found many common pitfalls, ranging from the relatively mundane to the massive and structural.”

    Kansas, for example, lacked a landing page with overall performance data, while Texas school report cards “offer a wealth of data broken down by every student group imaginable” in massive data tables but no visualizations.

    The five states with “great” usability are Illinois, Indiana, Oklahoma, Idaho and New Mexico, the last two of which got an F for longitudinal data.

    “California’s dashboard is far from the worst out there,” said Polikoff. “The reality is little tweaks are not going to cut it. That probably means a pretty substantial overhaul to be usable for longitudinal comparisons. Now, the state might say, ‘We don’t care about longitudinal trends’ and that’s their prerogative, but what purpose is the dashboard trying to serve, and who’s it trying to serve?”

    Answer those questions, he continued, “and then design the dashboard accordingly.”


    Source link

  • Why civic engagement must be integrated into the school dashboard

    Why civic engagement must be integrated into the school dashboard


    State Superintendent of Instruction Tony Thurmond and Chief Justice Patricia Guerrero honored Kennedy High in Anaheim for its outstanding civic learning programs.

    Credit: Courtesy Anaheim Union HSD

    The State Seal of Civic Engagement, approved by the State Board of Education in 2020, marked a vital progression in developing students who are not only academically strong but also civically active and socially aware.

    However, the absence of this seal in the College and Career Indicators (CCI) of the California School Dashboard represents a missed opportunity — until now. Recently, the State Board of Education has requested that the California Department of Education incorporate the seal into the CCI. By incorporating it, we can incentivize schools to cultivate civic responsibility, enhance the relevance of education and elevate student voices. This initiative offers a powerful chance to foster active citizenship, connect learning to real-world challenges, and inspire students to engage meaningfully with their communities.

    The Seal of Civic Engagement, which is affixed to a student’s diploma or certificate of completion, should be added alongside other key indicators like the State Seal of Biliteracy, ensuring it receives the attention it deserves. With local criteria including a minimum GPA of 2.0 in all social science courses and the completion of a civic engagement project, schools would now be held accountable to a higher standard of civic instruction. The inclusion of the civic engagement seal on the California School Dashboard is not only a recognition of student accomplishments but also a catalyst for broader shifts in educational practices that prioritize civic education.

    Incorporating the California Seal of Civic Engagement into the school dashboard will encourage schools to shift away from traditional instructional models and move toward more student-centered approaches. One of the primary benefits is the emphasis on elevating student voice and agency. Rather than positioning students as passive recipients of knowledge, the seal incentivizes schools to create opportunities for students to take on leadership roles, participate in community-based projects and engage in civic dialogue, and ultimately give students a reason to vote and participate in our democracy.

    Student-driven learning experiences will become a central focus, allowing students to take ownership of their education and the role they play in society. This shift fosters not only a deeper understanding of democratic principles but also a sense of responsibility and empowerment. As students take on active roles in addressing real-world challenges, they develop leadership, critical thinking and problem-solving skills, all while becoming more engaged in their communities.

    The connection between civic engagement and student well-being is becoming increasingly evident through research at UCLA and USC. By embedding service learning into the curriculum, schools can create more holistic learning experiences that connect academic content with community service. Civic engagement projects offer students a sense of purpose and belonging, which can significantly contribute to their mental health.

    When students work on projects that address real-world problems, they not only learn about the issues but also engage emotionally and intellectually with the material. Service learning provides an avenue for students to apply what they’ve learned in the classroom to make a tangible impact in their communities, which can enhance their sense of agency and improve their emotional well-being. Schools will be encouraged to develop instructional models that prioritize these types of experiences, ultimately supporting the mental and emotional health of students in ways that extend beyond traditional academic instruction.

    One of the most exciting opportunities provided by the California Seal of Civic Engagement is the potential to integrate civic engagement with career exploration. Schools can align civic projects with career pathway programs, providing students with hands-on learning experiences that are directly related to potential college majors and career interests.

    For example, students interested in public service, environmental sustainability or health care could engage in civic projects that allow them to explore these fields while still in high school. By linking civic engagement with career pathways, schools not only make learning more relevant but also provide students with early exposure to future career opportunities. This shift in instructional focus ensures that students are better prepared for both post-secondary education and the workforce.

    A key feature of the Seal of Civic Engagement is its potential to drive instructional shifts that address pressing societal issues. With its inclusion in the dashboard, schools will be incentivized to create project-based learning opportunities that tackle local and global challenges such as climate change, affordable housing, health care access and mental health.

    By engaging in civic projects that address these critical issues, students develop the skills necessary to analyze problems, research potential solutions and implement action plans. These hands-on experiences prepare students to think critically and creatively, making their learning more meaningful and applicable to real-world contexts. The seal encourages schools to foster a learning environment where students can connect their education to the challenges facing their communities and the world.

    The Seal of Civic Engagement also promotes active citizenship by encouraging schools to design lessons that emphasize democratic participation, voter registration and civic responsibility. By embedding these democratic practices into the curriculum, schools can ensure that students are not only knowledgeable about the issues but also understand the importance of participating in democratic processes.

    This instructional shift prepares students to be informed and engaged citizens beyond graduation, helping to create a more active and participatory democracy. Students who understand the value of their voice and their vote are more likely to carry those values into adulthood, becoming lifelong advocates for their communities and society at large.

    By nudging schools to prioritize civic education, we can prepare a generation of students who are not only academically accomplished but also socially conscious and ready to engage with the challenges of the modern world. From promoting student well-being to encouraging career exploration and addressing critical societal issues, including the Seal of Civic Engagement in the state’s accountability system is a vital step toward creating a more equitable and empowered future.

    •••

    Michael Matsuda is superintendent of Anaheim Union High School District in Southern California.

    The opinions in this commentary are those of the author. We welcome guest commentaries with diverse points of view. If you would like to submit a commentary, please review our guidelines and contact us.


    Source link

  • Search and compare data from the California School Dashboard, 2024

    Search and compare data from the California School Dashboard, 2024


    On Nov. 21, 2024, the California Department of Education updated the official California School Dashboard with the latest data for schools and districts. You can also view results for 2023, 2019, 2018, and 2017.* The dashboard shows achievement and progress, or lack of it, on multiple measures in color codes tied to performance metrics by the state. Enter a search term in the box to search by school, city, district or county. If a school or district does not appear, it means that no data is available. Detailed test scores are available on cells with an “i” (click to see more). For a full explanation, see the notes below the chart.

    * Missing or incomplete years of data from the California School Dashboard are due to the disruptions caused by the pandemic. 


    School Name, City and County Chronic Absenteeism Rate Suspension Rates English Lang. Arts Performance Math Performance High School Graduation Rate English Learners Link
    School Name, City and County Chronic Absenteeism Rate Suspension Rates English Lang. Arts Performance Math Performance High School Graduation Rate English Learners Link

    Notes to Database

    Color Codes and Ratings: The dashboard includes five color-coded performance levels, based on a combination of current performance level and change over the previous year. The color spectrum ranges from red to orange to yellow to green to blue, with red signifying the lowest performance level and blue the highest.

    More information about how the performance levels were calculated is available at the California Department of Education’s website here.

    Column Headings:

    Chronic Absenteeism: Proportion of students who miss 10 percent or more expected days of attendance in a school year. (For a student enrolled for 180 days, this would be 18 or more days.) Note: This indicator is not reported for high schools.

    Suspension Rates: Based on a combination of current suspension rates and changes in those rates over time.

    English Language Arts Performance: Student performance in Grades 3-8 and 11 on the English Language Arts Smarter Balanced tests administered in the current year, combined with whether scores improved, declined or stayed the same compared to the previous year.

    Math Performance: Student performance in Grades 3-8 and 11 on the math Smarter Balanced tests in the current year combined with whether scores improved, declined or stayed the same compared to the previous year.

    High School Graduation Rate: Combined four-year and five-year graduation rates, including current graduation rate along with whether rates have changed over the previous year.

    For more information about how the performance levels were calculated, go to the California Department of Education’s website here.

    For the full dashboard for each school or district, go here.


    Source link

  • California schools recovering from pandemic, dashboard shows

    California schools recovering from pandemic, dashboard shows


    Credit: Allison Shelley for American Education

    Este artículo está disponible en Español. Léelo en español.

    California’s K-12 schools made progress in several areas last school year, including increasing graduation rates slightly, and reducing suspensions and the number of students who were chronically absent from school, according to the School Dashboard released Thursday. 

    The state also had an overall increase in scores on state standardized tests in both English language arts and math, prepared more students for college and careers, and had more students earn a seal of biliteracy.

    The improvements, although incremental in some areas, are an indicator that California schools have made progress in reducing the learning loss and chronic absenteeism that resulted from school closures at the beginning of the Covid-19 pandemic in March 2020.

    “Today’s dashboard results show California continuing to make important strides in post-pandemic recovery,” said California State Board of Education President Linda Darling-Hammond. “We’re getting students back to school, getting more of them prepared for college and careers, and graduating them in greater numbers.” 

    The dashboard, a key part of the state’s accountability system, uses an array of colors to show whether a school or district showed growth or decline in several areas, including chronic absenteeism, suspension and graduation rates; preparation for college and career; progress of English language learners; and on state standardized test scores in math and English language arts.

    Students are considered chronically absent if they miss 10 percent or more of instructional days during the school year.

    Blue identifies schools and districts with the best performance, followed by green, yellow, orange and red. Schools and districts are scored based on their performance that school year, as well as on whether there were increases or decreases since the previous school year. Anything below a green rating indicates a need for improvement, according to state officials.

    This year, the state added science scores from state standardized tests to the mix, but only as an informational item. Next year the scores will be an official indicator, used to help determine whether schools need support from the county or state.

    Fewer school districts require support

    Districts that have a red rating in one or more priority areas are required to receive assistance from their county office of education as part of the California Statewide System of Support. Poor-performing county offices, which also operate schools, receive support directly from the state. 

    Priority areas include school climate (suspension rates); pupil engagement (graduation rate and chronic absences) and pupil achievement (English learner progress and math, science and English language arts tests).

    Because of the progress made by California schools last school year, the number of districts with performance low enough to require support from their county offices of education declined for the second year in a row. This year, 436 districts were qualified for help, compared with 466 last year.

    In 2022, 617 school districts were referred for assistance, largely because of high chronic absenteeism rates, according to the California Department of Education. But over the last two school years, chronic absenteeism rates have declined 5.7 percentage points each year. In 2021-22, almost a third of students were chronically absent.

    Chronic absenteeism continues to decline

    Despite the decline in chronic absentee rates, the state still has to make improvements to reach the 12.1% rate it had in 2019, before the Covid pandemic. The current chronic absentee rate is 18.6%.

    High school students were the most likely to be chronically absent last school year, missing on average 15.6 days of school. Transitional kindergarten and kindergarten students missed an average of 13.9 days, seventh and eighth graders 12.6 days, fourth through sixth graders 11 days, and first through third-grade students 11.5 days. 

    Eleven of the 15 school districts in El Dorado County were designated for differentiated assistance from the county because of high levels of chronic absenteeism in 2022. County Office of Education staff met with leaders from the 11 districts to review data and identify the root causes, said Ed Manansala, El Dorado County superintendent of schools. The county office provided data to districts every month in an effort to zero in on why student groups and individual students were absent and moving toward chronic absenteeism, he said.

     Last year, the county had three school districts on the state list because of chronic absenteeism. This year there were none, Manansala said.

    “To me, it’s a validation that the statewide system of support is working,” he said.

    Long-term English learners added

    While many districts improved their chronic absentee numbers and other indicators last year, avoiding the need for support, 215 districts are on the list, in part, because of the performance of their long-term English learners — a student group that was added this year.

    The performance of long-term English learners on academic tests, graduation rates and other indicators was the leading reason schools and districts were flagged for improvement this year. 

    The dashboard defines long-term English learners as students who speak a language other than English at home and have been enrolled in U.S. schools for seven years or more but have not yet achieved proficiency in English. In the past, the dashboard only included data for English learners as a whole.

    The inclusion of long-term English learners in the dashboard is the result of legislation that advocacy organizations pushed for several years. 

    “It’s a monumental step forward,” said Martha Hernandez, executive director of Californians Together, a statewide organization that advocates for English learners. “Long-term English learners’ needs will no longer be hidden, and they’ll be spotlighted for statewide accountability.”

    Hernandez said it is paramount that school districts use the new data about long-term English learners to develop programs and train teachers on how to help these students in particular. Long-term English learners have needs that differ from recently arrived immigrant students. For example, long-term English learners often have a good command of informal spoken English, but have not mastered reading and writing in the language.

    In addition, Hernandez said districts should also focus on helping students achieve fluency in English faster, so they do not become long-term English learners in the first place.

    “English learners come to school bright and ready to learn, and the system really fails them. (If) they become long-term English learners, it’s not an indication of the students, but really the system’s failure to meet their needs,” Hernandez said. 

    In El Dorado County, there are six districts in need of assistance from the county office of education. Like many districts in California this year, El Dorado Union High School District made the list because of the addition of long-term English language learners to the state metric. Manansala and Mike Kuhlman, superintendent of the high school district, have begun discussions on how to improve the achievement of long-term English learners.

    “We have 12 TK-8 districts that feed into that high school district, so it’s going to become a systemwide discussion,” Manansala said. “Again, we’re going to look at that more closely over these next few years.”

    More earn State Seal of Biliteracy

    The number of students who received the State Seal of Biliteracy on their high school diplomas also increased — up from 52,773 in 2022-23 to 64,261 in 2023-24. This may be due to a law that went into effect in 2024 that offers students more ways to prove their proficiency in English, in addition to a second language.

    In the past, advocates and administrators said many students, particularly English learners, didn’t receive the State Seal of Biliteracy, even though they were bilingual, because there weren’t enough options to prove proficiency in English.

    Graduation rates up slightly

    High school graduation rates in California increased 0.2 percentage points to 86.4% this year. But that was enough to give the state the largest cohort of students to graduate from high school since 2017, with 438,065 students, according to state officials. Of those 227,463 met the requirements to attend the University of California or California State University.

    Graduation rates have stayed fairly stable over the last decade, primarily because many districts allowed juniors and seniors to graduate upon meeting the state’s minimum requirement of 130 units during pandemic closures, instead of the higher number of units most districts required.

    Suspension rates decline

    Suspension rates declined slightly last school year, from 3.5% in 2022-23 to 3.2%.

    The decline in suspension rates was for all student groups, according to the California Department of Education, although there continues to be a focus on disparities in suspensions for African American students, foster youth, homeless students, students with disabilities and long-term English learners.

    Equity report

    Assistance to districts is also based on poor performance by student groups. So, even if a district overall has satisfactory performance, with yellow or even green, it will receive county guidance if the ratings of one or more student groups are red as measured on multiple measures of performance.

    An equity report on the dashboard gives users a look at the progress of the 14 student groups that attend California schools, including African American, American Indian, Asian, English learners, Filipino, foster youth, Hispanic, homeless, two or more races, Pacific Islander, socioeconomically disadvantaged, long-term English learners, students with disabilities, and white students.

    This year, school districts will get assistance to improve outcomes for long-term English learners in 215 districts, students with disabilities in 195 districts, homeless students in 125 districts, foster youth in 104 districts, English learners in 84 districts, economically disadvantaged students in 68 districts, white students in 30 districts, American Indian and Alaska Native in 27 districts, students of two or more races in 19 districts, Pacific Islander students in eight districts, and Asian students in one district, according to an EdSource analysis.

    The number of districts needing help to improve outcomes for African American and Latino students declined this year. Districts will get assistance to help African American students in 51 districts, down from 66 in 2018. Thirty-nine districts will get assistance to help Latino students, down from 44 compared with 2018. 

    “Across California, we’re seeing that when we provide for the most vulnerable in our communities, all students reap the rewards,” said State Superintendent of Public Instruction Tony Thurmond in a statement. “Our migrant students and socioeconomically disadvantaged students show marked improvements in consistent school attendance and graduation rates, reflecting the dedication of our educators and students alike.”


    Source link