California’s children rank in the bottom third of all states in overall well-being, according to a new report released this week.
The authors of the report, “2024 KIDS COUNT Data Book: State Trends in Child Well-Being,” found that over half of California’s 3- and 4-year-olds are not in school, less than one-fourth of its eighth graders are proficient in math, and a greater number children and teens per 100,000 died than in previous years.
“One way to think about it is where we see the most progress are the states who are investing in their children — heavily in their children,” said Leslie Boissiere, vice president of external affairs at the Annie E. Casey Foundation, who oversaw the compilation of the report.
Now in its 35th year and published by the foundation, a private philanthropy and research organization, the annual report measures children’s well-being across 16 indicators within the categories of education, economic well-being, health, and family and community.
Out of all states, California ranked 43rd in economic well-being, 35th in education, 10th in health, and 37th in family and community.
California’s children fared better than most other states only in the health indicator. Even so, the number of babies with low birth-weight slightly increased from 7.1% in 2019 to 7.4% in 2022, as did the number of child and teen deaths, rising from 18 per 100,000 in 2019 to 22 per 100,000 in 2022.
“The movement in indicators generally follows investments, and it depends on the particular state of how they’re investing in their children,” Boissiere said.
This year’s report largely focused on comparisons between 2019 and 2022 data to provide a pre-pandemic and post-pandemic view of how children are faring, Boissiere said. Sources for the data included the U.S. Census Bureau, U.S. Department of Education, the National Center for Education Statistics, the National Assessment of Educational Progress, and the Centers for Disease Control and Prevention.
Impact of low well-being on chronic absenteeism
The authors noted that the report’s findings provide context to the conversation on chronic absenteeism, which is defined as missing 10% or more of the school year.
The percentage of chronically absent students in California skyrocketed from the pre-pandemic rate of 12.1% in the 2018-19 school year to 30% in 2021-22. The reasons for such high absenteeism vary from district to district and even from student to student, but experts agree that the issue is exacerbated when children’s basic needs are not being met.
“What we know is that it’s critically important that all children arrive in the classroom ready to learn and, in order for them to be ready to learn, their basic needs have to be met,” Boissiere said.
National data included in the report highlighted the relationship between absences and academic performance. The more students miss school, the lower their reading proficiency.
In 2022, the percentage of fourth-grade students nationwide scoring proficient at reading was 40% for students with zero absences in the month before they took the National Assessment of Educational Progress, or NAEP. Reading proficiency lowered to 34% with one to two absent days in that month; to 28% with three to four absences; 25% with five to 10 absences, and down to 14% for students who had more than 10 absences in the same one-month time frame prior to taking the NAEP.
The authors also found that racial inequities play a critical role in nearly all the index measures in the report.
“As a result of generations-long inequities and discriminatory policies and practices that persist, children of color face high hurdles to success on many indicators,” the authors wrote.
For example, the authors found “alarming increases” in the rate of child and teen death rates among Black children nationally, and that American Indian or Alaska Native children “were more than twice as likely to lack health insurance.”
Disaggregating racial demographic data also pointed to notable inequities.
For example, authors found that Asian and Pacific Islander children experienced one of the lowest rates of poverty nationally at 11%; the rate of poverty among Burmese children was 29%, 24% for Mongolian children, and 23% for Thai children. The national average for child poverty is 16%, per the report, highlighting the stark poverty rates for many Asian children nationwide.
Looking at distinct racial inequities, the authors found exceptions where children of color were faring better than the national average. For example, Black children were more likely to be in school at ages 3 and 4, to be insured, and to have a head of household with at least a high school diploma. Latino children and teens had lower death rates, and they were also less likely to have low birth-weight.
“Today, kids of color represent a majority of the children in the country, as well as in 14 states, the District of Columbia, Puerto Rico and the U.S. Virgin Islands,” the authors wrote. “The future success of our nation depends on our ability to ensure all children have the chance to be successful.”
State Sen. Roger Niello, R-Fair Oaks, vice chairman of the Senate Budget and Fiscal Review Committee, back to camera, urges lawmakers to reject a measure to reduce the state budget deficit at the Capitol in Sacramento on April 11, 2024.
Many details of the spending plan will be hashed out in the coming days and weeks, but Thursday’s action will allow lawmakers to continue getting paid because it meets the constitutional requirement that they pass a budget before June 15.
The bare-bones plan passed Thursday would increase the size of the can lawmakers had previously contemplated kicking down the road in order to deal with lagging revenue. It would increase the amount of Proposition 98 funding — the amount of the overall general fund that must go to K-12 education and community colleges — that would be suspended in the current year, but with the expectation that much of it will be repaid and revenue will increase in the coming year.
Plenty of details remain unresolved. The Senate and the Assembly rejected $895 million that Gov. Gavin Newsom had proposed in one-time funding to purchase zero-emission school buses, and instead reinstated a cut that Newsom had proposed for the Golden State Teachers Grant Program, which pays $20,000 to teacher candidates who agree to teach in priority schools for four years. A supplemental bill that has not been released will detail how the rest of the money would be used. The Legislature accepted Newsom’s proposed cut of $550 million in facilities for transitional kindergarten and full-day kindergarten on the assumption that money will be included in a facilities bond that the governor and legislative leaders are negotiating to place on the November election ballot.
The framework with the California Teachers Association last month settled the question of how the state would account for an $8.8 billion shortfall in revenue below what the Legislature appropriated for 2022-23. The deal calls for suspending funding still owed for the current year ending June 30 — something that had been done only twice in the past 40 years — by $5.5 billion and delaying paying $2.6 billion appropriated for 2023-24 until 2024-25.
Suspending a portion of the Proposition 98 obligation requires creating a type of IOU that must be repaid in coming years. Newsom avoided outright cutting of TK-12 and community college funding by suspending some state funding and pushing off paying districts from the end of one fiscal year to the start of the next one — a tactic known as deferrals.
The placeholder budget passed on Thursday increases the funding that will be suspended by $2.8 billion. The Legislature assumes that higher income tax revenue next year, based on updated projections that Newsom didn’t have for his revised May budget, will help to pay down the suspended funding. The Legislature also would generate a new source of revenue by accelerating a three-year postponement of deductions that corporations can claim from net operating losses and various business tax credits. That would bring in temporarily $5 billion, of which about $2 billion would go to schools and community colleges under Proposition 98.
Newsom had proposed the three-year interruption to begin in 2025-26. Since businesses haven’t had time to plan an accelerated schedule, Newsom hasn’t said if he’d go along. Resuming the operating deductions and credits would then reduce revenues in future years.
Republicans in the Legislature criticized addressing the state’s budget deficit by raising taxes on the business community and shifting funds around. The budget is “little more than a shell game meant to hide the bleak truth of our financial situation,” said Senate Minority Leader Brian W. Jones, R-San Diego, who blamed overspending for the swing from a massive budget surplus to a deficit in two years.
The advocacy group Children Now, generally an ally of the Democratic leaders on children’s issues, criticized increasing the amount of Proposition 98 suspension and the use of funding deferrals. Suspension, the group said, “should be a last resort, not a tool to manipulate education spending,” adding that suspension, with its creation of an IOU, subjects education to funding volatility and uncertainty about when the money will be repaid.
“While we understand the necessity of suspending Proposition 98 under the current circumstances, a suspension isn’t ideal, and its size should be minimized as California still ranks fifth worst in the nation in terms of student-to-teacher ratios and, similarly, has among the lowest staffing levels for other educators, including support staff, nurses, and administrators,” the letter said.
Senate President pro Tempore Mike McGuire, D-Geyserville, predicted a deal between lawmakers and Newsom as early as next week and that the final budget would be similar to what the Legislature approved.
Long-term English learners who have been enrolled in U.S. schools for more than six years without becoming proficient in the language do worse on California’s math and English language arts tests than English learners who have been enrolled for fewer than six years.
California released data for the first time on long-term English learners’ achievement in standardized tests in math, English language arts and science for the 2022-23 school year, after a bill signed in 2022 required it. Long-term English learners are students who have been enrolled in U.S. schools for six years or more but have not advanced on the English proficiency test in two or more years. The state also released data for those “at risk of becoming long-term English learners,” defined as students who have been enrolled for four or five years and scored at intermediate level or below on the English proficiency test.
In the past, California had separated achievement data for English learners by those who had been enrolled for less than or more than a year, but not for long-term English learners or those at risk of becoming long-term English learners.
As a whole, students classified as English learners tend to do poorly on academic tests precisely because they are still learning English, and once they are reclassified, they tend to do much better.
Yet the data shows that long-term English learners do worse than their counterparts who have been enrolled in U.S. schools for fewer years.
Only 5.4% of long-term English learners met or exceeded English language arts standards in 2022-23, compared with 10.9% of English learners as a whole. In math, only 2.1% of long-term English learners met or exceeded the standards, versus 9.9% of English learners as a whole.
“There’s something really tragic that happens when students are not getting what they need every year, and they’re not feeling successful, and it really shapes their identity as a student,” said Nicole Knight, executive director of English language learner and multilingual achievement at Oakland Unified School District.
Knight said Oakland Unified has been separating the district’s own achievement data by the number of years English learners have been in school and found similar results. “The longer they’re in the system as long-term English learners, at least from a statistical standpoint, they tend to do worse and worse,” she said.
Conor P. Williams, senior fellow at The Century Foundation, said the data is not surprising and is likely due to several factors.
In part, these scores may have to do with the way the state defines English learners. Students who do not do well on academic tests continue to be classified as English learners because California requires students to do as well as their English-speaking peers on English language arts tests, in addition to passing the English Language Proficiency Assessment, in order to be reclassified as fluent.
“The fact that long-term English learners do particularly worse on a lot of academic metrics likely reflects the fact that there is an academic indicator in California’s reclassification criteria. That is not standard in all states,” said Williams. In many states, he said, students only have to pass an English language proficiency test in order to be reclassified as fluent.
Shelly Spiegel-Coleman, strategic adviser of Californians Together, said it’s important to note that most English learners do reclassify within six years. She said long-term English learners may not have received strong English language development support in their early years and probably no instruction in their home languages. She added that some English learners with fewer years of enrollment in U.S. schools may have arrived in the country already knowing how to read in their home languages.
A study by Californians Together showed that more than a third of long-term English learners also have disabilities that qualify them for special education services.
“Sometimes that is an excuse for folks, but those students can also reclassify, (though) it may take them a little more time,” said Knight. She said English learners with disabilities are less likely to receive quality instruction in English language development and quality special education services. “That’s a big issue that districts and schools need a lot more support and guidance with than what we currently have.”
Knight added that being classified as English learners for many years can hurt students’ self-esteem and cause them to become disengaged with school and stop turning in assignments or attending class.
The data is a call to action for districts, said Spiegel-Coleman. She said beginning next year, districts will have to include plans for long-term English learners in their local control accountability plans, or LCAPs. These are plans that every district and charter school must write every year, explaining how they will use state funds to improve educational outcomes for certain groups of students.
“When they’re writing their LCAPs, they need to look at those kids and say what is it we need to do for them?,” Spiegel-Coleman said. “Now that will happen. It will heighten their visibility, for sure.”
Knight said districts also need to offer more training and support for middle and high school teachers to incorporate explicit instruction in the English language, no matter what subject they teach. For example, she said Oakland Unified has worked to train middle school math teachers on how to teach students the language they need to understand in order to figure out a math problem.
She said districts can also help long-term English learners become more engaged in school, for example with internships or career education where they can use their skills in their home language.
The data also shows districts need to do more to help students learn enough English to reclassify as fluent in their first six years of school, before they become long-term English learners, both Spiegel-Coleman and Knight said.
“The number of long-term English learners in our system is really an indictment on our system as a whole, in Oakland and outside of Oakland,” Knight said.
She said some schools in Oakland reclassify almost 30% of their English learner students every year, while other schools reclassify almost none of them.
“That tells us that it’s really about the experiences they’re getting,” Knight said. “So how do we make sure more and more of our classrooms and schools are doing what these schools that have high reclassification rates are doing?”
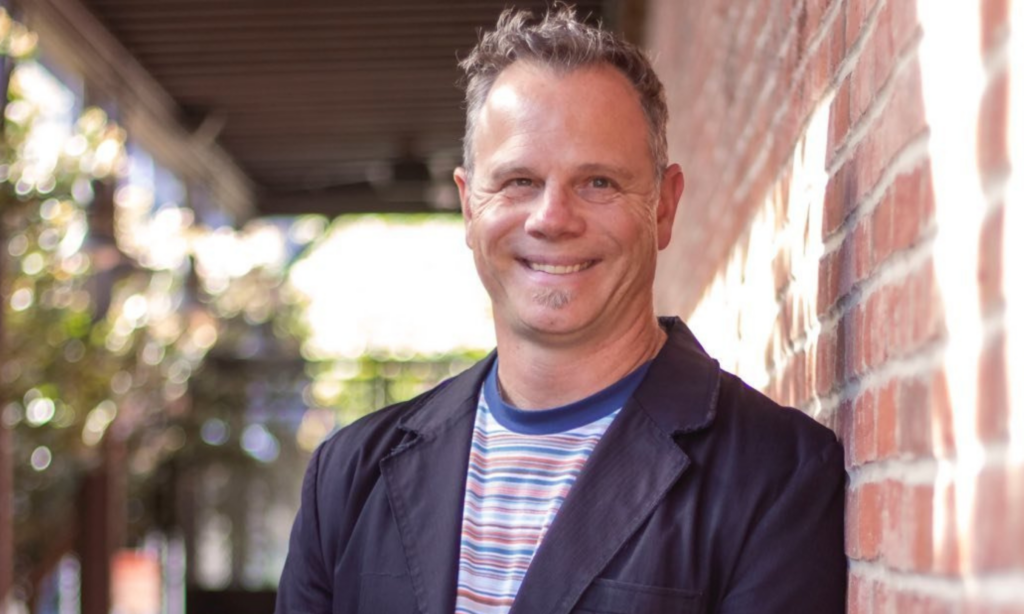
Plenty of conversations in California have focused on recruiting teachers into the profession as a way to grapple with the state’s teacher shortage. This is important, and as a transitional kindergarten teacher, I am acutely aware of how quality teachers can impact our students and communities.
I pursued teaching largely because I want to be the representation I didn’t see growing up. I participated in a teacher residency program that built my confidence in the classroom and taught me to connect with my students by highlighting my own identity. It’s not only the way I was recruited to the profession, it’s also played a role in my retention.
To continue to tackle the teacher shortage, I believe California needs more strong teacher residency programs. Nearly 37% of U.S. public schools experienced at least one teacher vacancy, contributing to nearly half of public school students entering the 2023-24 school year behind grade level in at least one subject. Amid these shortages, California is still reeling from the repercussions of surpassing 10,000 vacancies during the 2021-22 school year. The effects are felt even more so in under-resourced, Latino or Black communities.
At Aspire Richmond Technology Academy, where I teach, I can see how we must prepare educators and then provide the tools for teachers to sustain themselves. It’s how we can prevent shortages and retain teachers down the road.
It was a winding road for me to realize that teaching was my calling. I never envisioned myself becoming an educator, largely because I rarely saw teachers who looked like me or who connected with me on a cultural level. While studies point to the importance of a demographic match between teachers and students, I experienced a real lack of Asian representation in education.
This changed when I went to college. With more exposure to Asian professors, I finally felt seen and represented. I felt empowered that education was a field I could pursue. And I put the puzzle pieces together — that all of my volunteer work and extracurricular activities centered around helping students. By the time I switched majors, I had some catching up to do.
When I learned about teacher residency programs in California, I jumped at the opportunity. I received a master’s degree and a California teaching credential in a single year. Even in my first year of teaching, I felt more prepared than other teacher friends.
While we can’t solve the teacher shortage overnight, here’s how we can ensure we’re training more young people to become highly effective educators and stay in the profession.
First, we need an intensive teacher residency program that builds confidence. ThroughAspire’s teacher residency program at Alder Graduate School of Education, I apprenticed four days a week and had a personal mentor in the classroom with me who provided me with critical one-on-one support. Toward the end of my time as an apprentice, one of the students in our classroom asked my mentor, “So, what’s your job?” This gave me the confidence to teach the following year on my own. I learn best through a hands-on approach, so four days a week in the classroom with one day for intensive seminars and subject-matter courses helped me gain more real life experience.
Second, this wouldn’t be possible without strategic financial supports. We know that systemic inequities, including the high cost of college, hold too many back from pursuing a career in education. Ensuring teacher residents receive a stipend while earning their degree and credential(s) can help. Through a partnership, the program I participated in is helping to support staff members in earning and paying for an undergraduate degree with teaching credentials. Given the importance of representation in the classroom, the partnership prioritizes aspiring teachers of color and those from the local communities.
Finally, we should expand teacher residency programs that are accessible for individuals of all backgrounds. While California has made big investments in teacher residency programs, we also need to focus on effective teacher training initiatives that reflect our school’s communities. When I participated, my teacher residency program focused on “head, heart and hands.” This meant that we integrated theory and research (head), with a culturally responsive equity lens (heart), and our coursework mirrored our field work (hands). Highlighting representation, multiculturalism and identity continues to be stressed throughout the program — and it’s something I hold dear to my heart.
Last week, I proudly watched a kindergarten promotion, which included many of my previous TK students from my student teaching year. Seeing their growth academically, and how much confidence they have gained in themselves and their identities, is another reason why I continue to pursue education. In many ways, their growth reflects my own. And knowing that I contributed a small part to my former and current scholars’ successes, as they flourish in their own ways, brings me a surge of pride.
The programs at Aspire are happening at scale, with more than 36 schools serving more than 15,400 students across California. Not only did my residency program get me into the classroom, it’s played a role in keeping me there. We need more effective residency programs, and this can serve as a model for retaining teachers in California.
The opinions expressed in this commentary represent those of the author. EdSource welcomes commentaries representing diverse points of view. If you would like to submit a commentary, please review our guidelines and contact us.
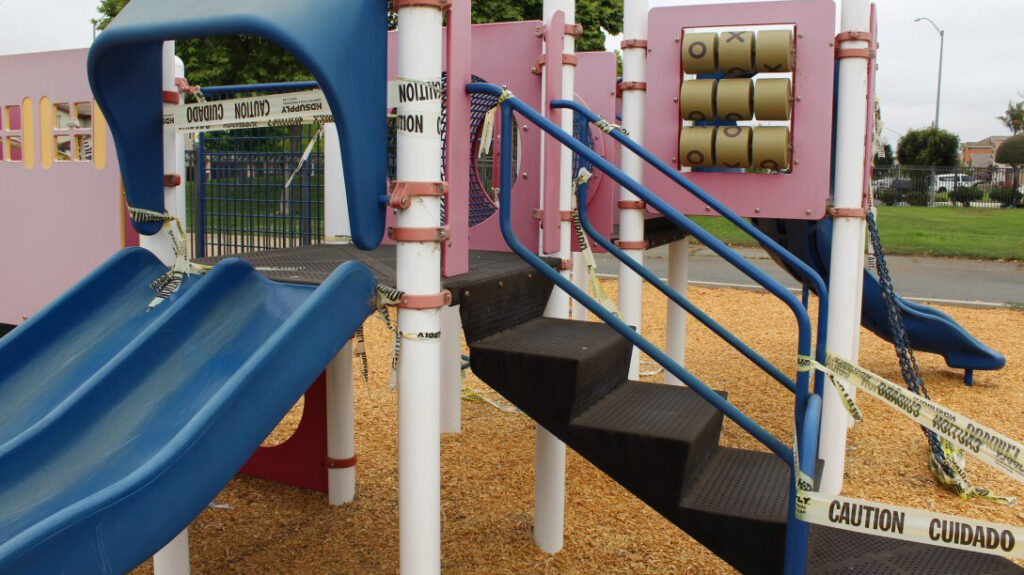
An off-limits, aged and rusting play structure, Santa Rita Union School District
Credit: Santa Rita Union School District
In the coming days, Gov. Gavin Newsom is expected to confirm his commitment to place a state school construction bond on the November ballot.
What he hasn’t committed to yet — but must decide in the next 10 days — is whether to reform a method of sharing state matching money that has long favored property-rich districts over their property-poor neighbors.
Along with a June 27 deadline to write ballot language, Newsom and legislative leaders face the threat of a lawsuit challenging the legality of the present system that ignores vast inequalities in districts’ ability to upgrade and repair schools. The public interest law firm Public Advocates filed its warning, a 21-page demand letter, with state officials in February. Public Advocates is calling for a new method that shares more state bond proceeds with districts that need more help. Their proposal focuses only on repairing and renovating facilities, not new construction.
The possibility of litigation drawing attention to funding inequalities would endanger the chances that a bond would pass — just when the state will run out of distributing the last matching money from the last bond, eight years ago. That would leave the state with no funding to help districts meet the rising cost of school construction.
Newsom’s aides and legislative leaders have expressed interest in proposals for a fairer system of allocating state funding, “but it is far from clear where the equity conversation will land,” said John Affeldt, managing attorney for Public Advocates.
“As long as state bond funding continues to exacerbate rather than redress local wealth disparities, the constitutional problem and our legal demands remain.”
Past California State School Board President Michael Kirst agreed. “We need to complete the job of making California school finance more equitable. This is a long-overlooked and needed area for political action.”
Late last month, Assemblymember Al Muratsuchi, D-Torrance, who chairs the Assembly Education Committee and authored a bill establishing a construction bond, predicted that the measure would be between $10 billion and $12 billion for TK-12 and community colleges. Whether it would include construction money for four-year universities hasn’t been announced.
The Coalition for Adequate School Housing or CASH, the influential lobby representing school districts and school construction contractors, opposes including the University of California and California State University. It argues schools and community colleges need the full $14 billion in Muratsuchi’s bill — and more — to meet higher costs of construction, demands for climate-resilient schools, requirements for transitional kindergarten classrooms, and evolving needs for student wellness and after-school activities.
Talks between Newsom and legislative leaders must also settle how much should be designated for new construction relative to repairing and renovating existing buildings, and how much should be set aside for removing lead in water.
But the most contentious issue will be the distribution formula: determining how much money districts must raise in property taxes to qualify for a matching amount from a state bond. For the past 25 years, every district has ponied up the same percentage match on a first-come, first-served basis: a 50-50 split for new construction and 40% district and 60% match from the state for upgrading facilities.
The result has been predictable: Those districts with higher property values have gotten a disproportionately large piece of the pie.
‘The very definition of a regressive tax’
The Center for Cities + Schools at UC Berkeley examined the state funding distribution of the 813 school districts that received state modernization funding from 1998, when the current distribution method was created, through 2023. The analysis showed that the quintile of districts with the lowest assessed property value — those with a median of $798,000 per student — received $2,970 in modernization funding per student, while the districts in the highest quintile, where the median assessed property value was $2.3 million per student, received $7,910 per student — more than two-and-a-half times as much. As a result, districts with a lower assessed property value per student must impose higher property taxes on its residents than would a higher-wealth district to upgrade a school building.
“Imposing a greater tax burden on a community of lesser wealth is the very definition of a regressive tax,” said Jeff Vincent, co-director of the Center for Cities + Schools.
Compounding the problem of low property values in many districts is the state restriction that limits a district’s bonding limit to 1.25% of a district’s total assessed property value for elementary and high school districts and 2.5% of the total value for unified districts.
Combine those two factors, and you have the dilemma facing hundreds of districts including, the 3,200-student Santa Rita Union Elementary District and neighboring Salinas City Elementary School District, both in Monterey County.
“Our biggest difficulty is bonding capacity. We’ve basically bonded at our allowable capacity, and we did that to try to build up what we need for the state matching in particular,” said Santa Rita Superintendent Melissa Alderman.
The track in need of repair is at New Republic Elementary, Santa Rita Union School DistrictCredit: Santa Rita Union School District
Deteriorating school roof at Lincoln Elementary, Salinas City Elementary School DistrictCredit: Salinas City Elementary School District
Damaged outside window sill of a portable, Laurel Wood Elementary, Salinas City Elementary School DistrictCredit: Salinas City Elementary School District
A deteriorating entrance to an aging portable at Lincoln Elementary, Salinas City Elementary School DistrictCredit: Salinas City Elementary School District
With the latest bonds, Santa Rita nearly topped out at $27 million — far short of the more than $100 million the district needs to renovate, repair, and replace its four elementary and two middle schools at state standards.
The difference would provide what many districts take for granted: There would be appropriately sized gyms for middle school; the deteriorating track would be paved so that their schools could host meets; 40-year-old portable classrooms sitting on dirt would be replaced with more spacious modular classrooms on concrete foundations. There would also be transitional kindergarten classrooms the district can’t build and room for student and family service partnerships that the district has had to decline.
“All of our roofs would not be leaking; all of our gutters would be unrusted; tree roots wouldn’t be breaking up the sidewalks,” Alderman said. “Alarm systems not going off in the middle of the night because it rained too hard and something shorted.”
Santa Rita can generate only $7,740 per student in bond capacity; across the Salinas Valley, Carmel Unified can raise $190,000 per student. With English learners comprising nearly half of students and a high rate of poverty, Alderman worries about adding to families’ property tax burden — even if she could ask for another bond.
Santa Rita qualified for the state’s financial hardship assistance funding for the full cost of projects that exceeded funding capacity, but Alderman says the formula for determining the amount of hardship aid was insufficient.
“We’ve gotten just enough funding to always be making repairs and patching and hoping a big emergency doesn’t happen,” she said.
Salinas City Elementary School District, with 8,200 students whose families are similar to those in Santa Rita, is somewhat better off. It passed two bonds for $175 million two years ago, which has placed “an incredible burden” on the community but will cover about a third of its modernization needs, said Superintendent Rebeca Andrade. She worries whether, after chipping away at replacing roofs, ramps and windows, there will be enough left for a community priority: upgrading kitchens in every school so that children can eat fresh food like the vegetables grown and picked in nearby fields.
Public Advocates’ proposal
Salinas and Santa Rita would be among the districts that would get significantly more state funding under Public Advocates’ proposal.
Instead of a 60% match for all districts, money would be distributed based on assessed value per student. Under its latest proposal, the districts with the most property wealth — Beverly Hills, Carmel Valley, San Francisco Unified, and Sunnyvale School District Elementary in Silicon Valley — would be among those receiving a 5% state match for contributing 95% of the project’s cost.
The property-poorest—Bakersfield, Dinuba, Lindsay, San Bernardino City and Fresno Unified — would get a 95% match for contributing 5%. Salinas City Elementary would get an 81% match for contributing 19%, while Santa Rita would get 87% state funding for contributing a 13% local match, enabling the district to stretch its dollars and broaden its vision for creating a quality learning environment.
Affeldt said something like a 5%-95% scheme is needed to begin to offset local wealth disparities.
The Center for Cities + Schools has also calculated the impact of a 20%-80% match, which would be less progressive while flattening the gains and losses that districts would receive.
But there’s a caveat: The state match provides funding on a per-student basis, not on the size of a project, said Tom Pace, vice chair of CASH and the director of facilities of San Bernardino City Unified. “So we’re talking about a percentage of the grant amount, not a percentage of construction costs,” Pace said. “The majority of the costs associated with building schools are borne by local districts.”
Since the current system of matching funds started in 1998, school districts have raised nearly $3 for $1 contributed by the state — $125 billion to $43 billion, according to the Center for Cities + Schools.
A formula that sends a larger match to districts like San Bernardino would go a long way to solve inequitable funding, Pace said. But it will take an adequate level of state funding to address the full problem, he said. “San Marcos High School is one of the nicest high schools I’ve ever seen. I got confused with (CSU San Marcos) when I drove past,” he said. “There is no way that San Bernardino will ever have a high school that looks like that because of our low assessed value and growth.”
Big tax-base exceptions
There’s a correlation between residents’ income and assessed value per student. The quintile of districts with the highest assessed property per student generally consists of small, wealthy communities like Santa Monica, Beverly Hills, and, in Silicon Valley, Saratoga. The quintile of districts with the lowest property values per student are generally low-income communities.
But there are significant exceptions, including urban areas with big industrial and commercial tax bases. Oakland Unified, with 76% low-income families but $1.6 billion in bonding capacity, and Los Angeles Unified, with 81% low income families but $18.4 billion bonding capacity, would see their modernization match drop from 60% to 55%, under Public Advocates’ proposal. San Diego Unified, the state’s second-largest district, would see its state share drop from 60% to 51%.
CASH, which has underwritten previous campaigns to promote state school facilities bonds and on its own authored the last bond that voters passed, in 2015, also opposes Public Advocates’ proposal. Reforms that would prioritize school facility funding based on lower assessed valuation “appear to create winners and losers and disrupt the stability of the current School Facility Program,” CASH said in a May 23 letter to Newsom and legislative leaders. “CASH advises against hastily adopting significant changes to the (current program) without fully vetting their impact.”
CASH’s position is that improving access to the existing school facilities program is the way to address concerns. Tiny districts with under $15 million in assessed value would automatically get full assistance; its proposal also would reserve 20% of funding for districts that could qualify for up to 100% state aid. “Those typically end up being lower wealth districts that have struggled to provide local matches,” said CASH Chair Alan Reising, the business services administrator for Long Beach Unified.
Public Advocates argues a sliding-scale system would eliminate most of the need for the financial hardship program.
CASH would also permit supplemental funding for priorities like transitional kindergarten classrooms and climate resiliency measures. Public Advocates agrees with this concept and would include community schools’ additional space needs. It also supports setting aside 5% of state funding for technical guidance, since many districts lack the expertise to compete for what has been a first-come, first-served program.
But CASH would maintain at least the current 60% state match for all districts, with some districts entitled up to 70%, based on an index of high-needs students and bonding capacity. It’s a slight variation of Muratsuchi’s AB 247, the current proposal for the November bond. An analysis by Cities + Schools found that the nudge toward equitable funding would have little effect, other than to add costs.
“These are token changes that are really not going to move the needle in any meaningful way,” said Vincent, the co-director of the center.
Analogy with famous Serrano lawsuit
Public Advocates has filed a number of regulatory challenges and lawsuits over the past 25 years on education adequacy and funding, so it’s not surprising that it is focusing on facilities funding. What is surprising is that a similar threat hasn’t risen sooner.
Fifty-three years ago, setting a precedent for the nation, the California Supreme Court struck down relying on local property taxes to fund schools as violating the constitutional right of students in low-wealth districts to have access to an equal education. That led to a state system of equalizing K-12 funding and then, in 2013, to the Local Control Funding Formula. It directs extra resources to districts based on their numbers of English learners, low-income students, and foster children.
Public Advocates argues the current system of funding school facilities is comparable to the property-tax-based system of operating schools that the court rejected in the Serrano v. Priest decision.
Many states insufficiently fund school facilities, but California’s present system remains one of the most regressive because it ignores vast differences in property wealth, Vincent said. Public Advocates based its model on Kansas’ sliding scale.
It’s an open question whether Newsom, legislative leaders, and ultimately voters would agree to a formula with new “winners” and “losers” to achieve a more equitable distribution of state funding.
As an administrator of a district that would gain the most from Public Advocates’ plan and as one of 11 members of CASH’s board of directors, Pace said, “I like the sliding scale; I would just advocate that there be a base amount that you start with.”
Otherwise, he foresees the breaking apart of a unified front for a state bond, and it is critical for today’s children to pass a bond this year, Pace said. “To pass a bond, you have to have a coalition, and coalitions generally don’t vote for things that are equitable, because you’re going to have people that say, ‘Well, if I contribute (to the campaign), what do I get out of it?’”
Kirst, who co-authored the Local Control Funding Formula, nonetheless encourages state leaders to press forward. “The issue has flown under the radar for so many years,” he said. “School construction has been controlled by groups that sponsor the initiative, but that does not excuse the lack of attention.”
UC Berkeley students on campus on Sather road in Berkeley.
Credit: Alison Yin / EdSource
Patrick Acuña entered the University of California, Irvine as an undergraduate. In recovery from methamphetamine and heroin usage, he entered the UC system with the hope of being supported while he was starting a new academic and social journey. Acuña said maintaining his recovery is vital to him because he knows for sure he “doesn’t want to go back to what once was” — staying up for days on end when he was in active addiction.
The normalization of drinking, substance use and other potentially harmful behaviors campuses is a scary reality for folks in recovery. This disconnect from healthier peers can be isolating and damaging, especially because community can serve as an essential support system. For students entering college, this, in addition to academic stress, new financial responsibilities and more, can increase the risk of relapse.
But on-campus collegiate recovery programs can help students navigate these pressures as part of the continuum of care that is essential to maintaining and solidifying recovery.
Unfortunately, UC Irvine lacked a collegiate recovery program that could have supported Acuña in these challenges. Currently, only six out of the 10 UC campuses have a developing or established collegiate recovery program. The programs that do exist vary widely in their staffing capacity and the range of services they provide.
This discrepancy must be addressed; collegiate recovery programs systemwide should be staffed with at least one full-time staff member, a dedicated and safe physical space and institutional funding.
Trey Murray, an undergraduate student at UC Santa Barbara, said, “I remember coming to UCSB, a quarter behind all the other freshmen because I spent the summer in a treatment center. I was terrified of college as a whole and especially scared of navigating school while staying sober. (The collegiate recovery program) provided me with a safe and recovery-supportive environment that was crucial to my success in school and sobriety. (It) gave me a place to fit in on campus and sparked joy and passion in my student life.”
Collegiate recovery programs provide resources such as substance-free social events, harm reduction supplies such as fentanyl test strips and the overdose medication naloxone, campuswide educational programming, recovery housing, referrals to higher levels of care, and support groups led by peers who are familiar with the social isolation and distinct difficulties of maintaining sobriety or reducing their usage in collegiate settings where substance use is a standard part of social experiences.
These programs are a vital support for students in recovery from substance abuse, other behavioral addictions, eating disorders and similar conditions. According to a report from the federal Substance Abuse and Mental Health Services Administration, 1 in 7 people aged 18 to 25 meets the diagnostic criteria for a substance-use disorder. Among college students specifically, that number is closer to 1 in 4. Furthermore, data from the American College Health Association’s National College Health Assessment shows that students at every UC campus are using substances and seeking recovery-supportive communities.
For Acuña, integration of recovery into his everyday life was a much bigger challenge due to the lack of a collegiate recovery program on his campus. “I always have to be vigilant with my recovery; I wouldn’t ever say I have arrived at recovery,” he notes. He didn’t get the needed assistance a collegiate recovery program would have provided regarding hosting on-campus support groups, connecting him to clinicians, allowing him to find a supportive community of peers on campus, and providing an accessible, safe place to go when faced with stressors, activators or urges. Instead, he had to find ways to travel off campus and relied largely on other forms of peer support through student organizations and identity-based clubs such as Underground Scholars to have community and connection with his peers. These organizations, however, are not specifically geared for recovery.
An undergraduate student shared why they had chosen to attend UC Santa Cruz, which has a staffed and funded collegiate recovery program: “My biggest fear in coming to college was relapsing. Having (a collegiate recovery program) during my college experience with its substance-free events and programming, as well as support groups to meet people with shared experiences, has been tremendously helpful in my recovery.”
Recovery as a process is more taxing than a full-time job, as it requires constantly challenging the unhelpful coping mechanisms one has been using for so long, and collegiate recovery programs can support students especially well through their on-campus presence and support.
Preliminary research shows that collegiate recovery programs contribute to better academic outcomes. Data from Texas Tech University, which is home to one of the country’s oldest collegiate recovery programs, suggests that its members have higher graduation rates and higher GPAs than the general student body. Data collected from such programs nationwide show that participating students have almost a 90% graduation rate compared with a 61% institutionwide graduation rate.
As Esse Pink, a master’s student at UCLA, said, “Without the UCLA collegiate recovery program, my life trajectory would be far worse. I would not have stayed sober, I would not have graduated with my bachelor’s, I may not even be alive.”
•••
Aditi Hariharan is a third year student at UC Davis, majoring in both political science and nutrition science (public health emphasis). She served as the ACQUIRE vice chair on behalf of the UC Student Association in 2023-24.
The opinions expressed in this commentary represent those of the author. EdSource welcomes commentaries representing diverse points of view. If you would like to submit a commentary, please review our guidelines and contact us.
This story was updated to more accurately describe the data availability issues. Details.
Public data posted by the California Department of Education has been incomplete, often outdated and occasionally inaccurate, forcing legislators to pass laws based on old data, researchers to delay inquiries and journalists to grapple with inaccurate information.
Californians, living in a state known globally as a center of innovation and technology, have had to cope with a state education agency that has admittedly lacked the staffing and the policies to provide much-needed data, EdSource reporting has found.
As a result, there are gaps in the knowledge needed by lawmakers, researchers, journalists and others to evaluate state programs and policies, from teacher demographics, to how many English learners become fluent in English each year, to how districts have spent a $50 million court settlement to improve early literacy.
Obtaining data from the California Department of Education (CDE) has been difficult, said Christopher Nellum, executive director of The Education Trust-West, one of the state’s most prominent social justice and advocacy organizations. There have been delays in the public release of data and a lack of consistency when it comes to the annual publication of key data sets, he said.
“In an ideal world, we would have a legislature in a state that is making data-informed decisions about legislation, and then making data-informed decisions about assessing the efficacy or impact of investments, or the interventions, and this is difficult in the state of California right now,” Nellum said.
The CDE collects data about student achievement and demographics, enrollment, course information, discipline, graduation rates, staff assignments and other data, much of it mandated by legislation.
Some data have not been updated by the department for as long as five years. The most recent available data for teacher demographics, pupil-teacher ratios, course enrollment, and class size is from 2018-19.
“In an ideal world, we would have a legislature in a state that is making data-informed decisions about legislation, and then making data-informed decisions about assessing the efficacy or impact of investments, or the interventions, and this is difficult in the state of California right now.”
Christopher Nellum
The dashboard that tracks the annual progress of K-12 students on standardized tests, chronic absenteeism, suspensions and graduation was also suspended or only partially updated due to the pandemic-related school closures until Dec. 2023. The Legislature suspended the reporting of state and local indicators on the 2020 and 2021 dashboards and, because the state didn’t have prior-year data to measure growth in 2022, that year’s dashboard was published without the full-color display.
Cindy Kazanis, the director of the Analysis, Measurement and Accountability Reporting Division at CDE, said many of the delays in reporting data have resulted from “not having enough boots on the ground.” The department is in the process of recruiting and hiring 17 new staffers.
New state mandates and changes in the way data is collected also have impacted data collection, Kazanis said. The five-year delay in updating some data is because the department has a backlog of reports and data that must be reconfigured because the state changed course codes in 2018-19, she said.
Legislation based on old data
An EdSource examination of recent state education bills shows that legislative staff have sometimes had to rely on outdated CDE data to complete analysis meant to help legislators make decisions about whether to pass laws.
One example is an analysis of Assembly Bill 2097, which used department data from 2018-19, the most recent year it was available, to show computer science offerings in California high schools, and the number and gender of students enrolled in them. The bill, if passed, will require school districts to offer computer science courses to high school students, who will be required to complete a one-year course before graduating.
An analysis of Assembly Bill 2429 also relied on data from five years ago. The legislation mandates health education courses, required by some districts to graduate, including instruction on the dangers of fentanyl use. The legislation passed on June 13.
“The committee may wish to consider that course-taking data, which is important for policy analysis and evaluation, has not been updated by the CDE since the 2018-19 school year,” stated the analysis. “The CDE reports that this data will be updated in 2024.”
Since 2018, legislators also have required that several new datasets be added to the CDE website, including absenteeism by reason, a stability rate, restraint and seclusion, special education, college-going rates, teacher assignment monitoring outcomes, five-year graduation rates and homeless students by dwelling type, according to the CDE.
Assembly Bill 1340, signed by Gov. Gavin Newsom in October, mandates that the department post test scores, suspensions, rates of absenteeism, and graduate and college-going rates for students with disabilities, disaggregated by federal disability category, on its website.
The analysis of the bill for the Assembly Education Committee was terse. “When this committee is asked to evaluate the effect of a policy on a subset of students with disabilities — for example, students who are visually impaired — it requires data about this subgroup of students’ progress on academic and other measures. Under current CDE practice, a single number for all students with disabilities is shown, obscuring important information about students’ progress, which is needed for evidence-based policymaking and to provide transparent information for the public,” it read. Legislators could not be reached to comment.
Unreliable public information
EdSource journalists working on news stories have struggled in several cases to obtain accurate, up-to-date data from the California Department of Education. This year, EdSource had to twice remove data after publication because the analysis was based on incorrect data that the department had published on its website. In both cases, school district officials notified CDE that they had inadvertently submitted incorrect data to the department, but the agency did not correct the information online.
The timing of data releases has also been an issue. When CDE refused to publicly release state test scores after districts began releasing the information to parents, EdSource enlisted legal help to require CDE to comply with the California Public Records Act.
In September 2022, just months before the election that re-elected Tony Thurmond as state superintendent of public instruction, the CDE refused an EdSource request for Smarter Balanced test scores, saying they would not be released until sometime later in the year. EdSource wrote about the delay and enlisted an attorney to write a letter outlining why the data was public information. Within a week, the department announced the scores would be released in October, before the election. The Legislature subsequently required the department to release test scores annually by Oct. 15.
Nonprofits, schools share data
Because of the difficulty obtaining education data from the state, many nonprofits and collaboratives have started collecting their own data or creating online tools, so the public can more easily access CDE data.
The Education Trust-West, which has campaigned for clear and accessible data through its Data for the People initiative for over a decade, developed a data visualization tool that uses public data on California K-12 and higher education systems. Because much of the data comes from the CDE, information is limited to what the department has made available.
CORE Districts, a collaborative of nine California school districts serving more than a million students, collects data directly from districts for its Insights Dashboard. CORE collects data from its member districts, as well as 124 other school districts and charter schools, so that comparisons can be made. But the effort doesn’t come near reporting on all nearly 1,000 districts.
“We regularly get requests from researchers to look at our data,” said Rick Miller, CORE Districts’ chief executive officer. “Going through the CDE process is so cumbersome.”
Lack of data stymies researchers
Education data that is not being collected or made publicly available recently became the central topic of a gathering of California researchers discussing educator diversity, said Kai Mathews, project director for the California Educator Diversity Project at UCLA.
“What we realized is that some people had some information that’s not publicly available, and it largely depended on past relationships,” Mathews said. “So some data is actually probably collected, it’s just not publicly shared with all of us.”
Mathews and Nellum agree that a lack of updated teacher demographic data is particularly perplexing, given the teacher shortage and the number of workforce issues facing teachers. The Education Trust-West has had to delay some of its work because it hasn’t been able to obtain teacherdata, Nellum said.
“That is bad for students. It’s bad for schools. And, of course, it’s bad for any sort of hope we have of advancing equity,” Nellum said.
EdSource requested updated teacher demographic information from CDE earlier this year for a series of stories on recruiting and retaining Black teachers, an issue Superintendent of Public Instruction Thurmond had called a priority. The data was last updated in 2018-19, despite being submitted to the department annually by school districts. After sending five email requests over a month, the reporter never received the data from the CDE. Instead, the reporter used data from 2020-21, the most recent year available, from the National Center for Education Statistics.
Alix Gallagher, the director of strategic partnerships at Policy Analysis for California Education (PACE), says the lack of data on universal transitional kindergarten makes it unclear whether the state is optimizing the annual investment it is making in the grade. California will spend an estimated $3 billion a year by 2025-26, when universal transitional kindergarten (TK) will be offered to all 4-year-olds, Gallagher wrote in a commentary on the PACE website.
The state should collect data on the features of transitional kindergarten programs and on student outcomes from transitional kindergarten through second grade, to better understand the effectiveness of transitional kindergarten, she wrote.
“Right now there isn’t publicly available data for roughly the first third of a kid’s career in the public schools,” Gallagher told EdSource. “We now have universal access to TK, kindergarten, first, second and third grades. And, at the end of third grade, kids take the SBAC (Smarter Balanced Assessment). And that’s the first time, as a system, we know anything about kids’ learning.”
In fact, this year’s test scores show 57% of third-graders reading below grade level and 55% doing mathematics below grade level.
CDE data division staffing up
An annual $3 million investment from the state will allow CDE to add 17 new employees to improve data reporting to the public, Kazanis said. Twelve of the new employees have been hired. The Analysis, Measurement and Accountability Reporting Division currently has 66 employees.
Some of those resources are headed to CDE as part of the state’s launchof the first phase of its Cradle-to-Career Data System sometime this year. The longitudinal data system will provide tools to help students achieve their goals and deliver information on education and workforce outcomes, according to the website. It may also give researchers the data they are seeking.
“I’m hopeful though, because the Cradle-to-Career data system is working on a teacher dashboard, which I know will have a lot of the data that we have been waiting for,” said Nellum, who also is a member of the Cradle-to-Career (C2C) Advisory Board. Nellum spoke to EdSource for this story as a representative of The Education-Trust West and not as a member of the C2C board.
Eight of the employees will make up the new Data Visualization and Insights Office. It will collect data at the request of state policymakers and the California State Board of Education and work to make publicly available data more user-friendly, Kazanis said.
The state funding includes $300,000 to move the release date of the California School Dashboard data up incrementally each year until the annual release date is Oct. 15. This is expected to happen in 2026. Last year, data which includes test scores, graduation rates and student demographics was released on Dec. 15. Two data teams work on the dashboard full-time all year, Kazanis said.
The influx of new staff is expected to allow the department to revamp DataQuest to make it more user-friendly, Kazanis said. The new teacher reports, for example, will allow the user to make comparisons among districts, she said.
Seven new positions will focus entirely on generating teacher data, Kazanis said.
“We’ve wanted to get out from under this backlog, but part of it was recognizing that we did need more resources, and we need dedicated resources to be focused on teacher data.”
Friday: California launches the Cradle-to-Career data system, a long-awaited project to track student progress
This story has been changed to correct the spelling for Tony Thurmond, California superintendent of public instruction and to reflect that some data sets have not been updated for the past five years, not seven years as originally stated. The paragraph about the California School Dashboard has been updated to make clear that the dashboard was suspended by the Legislature during the Covid pandemic.
This high school wood shop, built in 1954, will not qualify for modernization funding until the district brings an outside entranceway added in the 1970s up to code – an additional expense that Anderson Valley cannot afford, according to Superintendent Louise Simson.
Courtesy: Anderson Valley Unified School District
Gov. Gavin Newsom and the Legislature are wrestling over how to dole out facilities funding for the projected November ballot bond initiative, and my fear is that when all is said and done, small rural school districts will not get their fair funding share at the table. The result will be that students attending schools that have the least political power and the highest facility needs will be, once again, left behind. And more often than not, those are students who are socio-economically disadvantaged and of color. Sadly, the quality of a student’s educational facilities experience in California has become defined by a student’s ZIP code.
Too often, our small rural school systems, which are facing extreme enrollment decline and a lack of bonding capacity, lag far behind nearby more populated school districts. It is unfathomable to me why a student 45 minutes away can receive one educational experience, while students in a small rural district receive another.
During my superintendency at Anderson Valley Unified School District, a 70-year-old school system in rural Mendocino County, I was faced with facilities that were in an extreme state of deterioration. An unincorporated town of just 1,650 people had passed a bond measure back in 2012; but the $8 million they were able to get out was nowhere near enough to remediate the aging infrastructure.
When I arrived in 2021, the community stepped up again, passing an additional $13 million bond with an overwhelming 71% of the vote. With assessed valuations so low and with no real estate development on the horizon due to a lack of a municipal water and sewer system infrastructure, we were only able to pull out $6 million. Throw in on top of that two failed septic systems requiring replacement that topped$1 million with the indignity of students and staff using porta-potties for four months; a plethora of classrooms that hadn’t been touched since Dwight Eisenhower was president; and buildings that were out of compliance with mold and seismic codes, and you have the picture of instructional facilities inequity that just made the instructional divide even greater. And we are not alone. Similar conditions are common for those that don’t have a powerful voice in the Legislature and the lobbying community.
Small, rural districts like mine are run by a district office of three or four people. We are just trying to keep up with the tsunami of reports that the California Department of Education expects us to produce and, in our spare time, do what is best for kids. Wealthier districts exacerbate the disparity with their massive education foundations that create endowment programs that provide even more opportunity for those that need it the least.
It is time for the governor and the Legislature to give students in these crumbling school systems their fair share and create some educational equity on the facilities side. The bureaucracy of the hardship application process is not doable for small rural school systems to navigate by themselves. Small districts end up taking what little money they have for facilities and spending it on expensive consultants that know their stuff but cost the equivalent of a monthly teacher’s salary, to move the applications through the process.
Governor, if you want educational equity, this is how you create it:
I don’t need technical assistance. I need money to navigate the process. Allocate a funding stream for small rural schools systems to contract with architects and consultants to move applications through the facilities-hardship process outside my existing budget.
If a facility is more than 50 years old and hasn’t been remodeled, let’s use some common sense and engage in a different process. I shouldn’t have to demonstrate mold, seismic or structural hazards. This building is not an equitable learning environment for kids. Let’s get it done and stop the busy work.
I hope that the governor and legislative partners hear the plea of our rural students and leaders and don’t leave us behind again. What has gone on in the disproportionality of school facility funding for decades and decades will eventually be tested in the court systems, if something doesn’t change, and the poor condition of the deteriorating rural sites will attest to a judgment that will prevail.
Education in California should be based on equal opportunity to access quality programs and facilities, no matter where you live or whether your parents pick crops or work in tech. Something has got to change on the funding and facilities side if we want to talk about real equity for all kids.
The opinions expressed in this commentary represent those of the author. EdSource welcomes commentaries representing diverse points of view. If you would like to submit a commentary, please review our guidelines and contact us.
Starting today, with the sole exception of the 9 a.m. post about censorship, there will be no more posts on Saturday or Sunday. I meant to write and say, NONE! But I could not resist the story about cartoonist Art Spiegelman.
Temecula Valley Unified School District board member Joseph Komrosky.
Credit: Temecula Valley Unified
The Temecula Valley Unified School District’s future remains murky following a close recall election that ousted Joseph Komrosky, the district’s conservative school board president.
Four of the district’s five seats will be up for grabs — with two board members up for re-election in November and two seats previously held by conservative members needing to be filled. Komrosky told EdSource in an email that he will likely run for re-election. Still, his departure from the school board has kindled a renewed optimism for many that the district will be able to re-focus on student academic performance and well-being.
“I’m looking forward to getting back to working on issues of supporting student success and safety in classrooms,” said Edgar Diaz, the president of the Temecula Valley Educators Association, the district’s teachers union.
“That’s my excitement….Our board meetings can get back to that, versus having to listen to controversial issues being brought up and then passed without any sense of discussion or listening.”
Komrosky’s departure will leave the board with three members — of whom, only Jennifer Wiersma was part of the district’s previously held conservative majority; conservative school board member Danny Gonzalez resigned in December.
Wiersma also said in a statement to EdSource that she looks forward to “focusing on student achievement and academics for all populations, striving to improve school safety and continuing to encourage parents to be involved in their child’s education,” regardless of the outcome.
She maintains, however, that “it’s been an honor to serve this community with Dr. Komrosky.”
The recall race was tight — with about 51% of voters opting to remove Komrosky from office. Ultimately, he lost by only 212 votes.
“I am proud to have fulfilled all of my campaign promises as an elected official,” Komrosky said in a statement to EdSource. “My commitment to protecting the innocence of our children in Temecula schools remains unwavering.”
The lead up
Temecula Valley Unified’s conservative majority took the helm in December 2022 — and proceeded to ban critical race theory that December.
The board also passed a widespread policy in August that requires school officials to notify parents if their child shows signs of being transgender.
Despite widespread backlash — including from state officials such as California Attorney General Rob Bonta — Riverside County Judge Eric A. Keen ruled in February that the district can continue to implement its transgender notification policy while litigation is pending.
“Anyone who uses their position to attack LGBTQ+ youth is unfit to serve in public office, and we are pleased to see Dr. Komrosky’s political career come to an appropriate end,” said Tony Hoang, the executive director of Equality California, in a media release.
The PAC also decided not to pursue a recall election against Gonzalez who resigned and moved to Texas.
“This is a democracy. This is where people vote, and they make the decisions. It’s not for me to tell the people of that trustee area how to vote or what to vote for,” said Temecula Valley Unified school board member Schwartz.
“They know what’s going on. They’ve seen how those three board members have behaved; and obviously, they were not happy with what was going on, and they changed their minds. So, I think democracy is alive and well in Temecula, and it’s a good thing.”
Looking ahead
With Komrosky recalled, Temecula Valley Unified’s school board now includes Wiersma, along with Allison Barclay and Steven Schwartz, both of whom are up for re-election this November.
Meanwhile, Wiersma will take over as the board’s president because she previously served as the school board’s clerk.
“I’m proud Dr. Komrosky has courageously kept his campaign promises, despite the unrelenting boardroom lawfare and personal attacks on his family by the teacher’s union, community activists, and even our own Governor, Gavin Newsom,” Wiersma said in a statement to EdSource.
“People underestimate the steep learning curve and tremendous amount of pressure that comes with challenging the status quo as a school board president.”
Pack maintained that the recall is a “happy surprise,” but that he is shocked that so many voters opted to keep Komrosky — and emphasized that their work will continue, leading up to November.
“[Partisan politics is] going to be something we’re going to be dealing with for a little while longer,” Pack said. “We’re going to have to work extra hard to get some of those people to see the light and realize national-style politics don’t belong here.”